Scaling analysis of the magnetic-field-tuned quantum transition in superconducting amorphous In–O films
Abstract
We have studied the magnetic-field-tuned superconductor-insulator quantum transition (SIT) in amorphous In–O films with different oxygen content and, hence, different electron density. While for states of the film near the zero-field SIT the two-dimensional scaling behaviour is confirmed, for deeper states in the superconducting phase the SIT scenario changes: in addition to the scaling function that describes the conductivity of fluctuation-induced Cooper pairs, there emerges a temperature-dependent contribution to the film resistance. This contribution can originate from the conductivity of normal electrons.
pacs:
PACS numbers: 71.30 +h, 74.40 +kThe scaling analysis is an important experimental tool for studying quantum phase transitions. For two-dimensional (2D) disordered superconductors, alongside with the zero-field superconductor-insulator transition (SIT) as driven by disorder change in the film, there exists a SIT that is induced by a normal magnetic field. A scenario of the field-induced SIT was proposed in Ref. [1]: at zero temperature the normal magnetic field alters the state of a disordered film from superconducting at low fields, through a metallic one at the critical field with the universal sheet resistance close to k, to an insulating state at fields . The SIT was supposed to be continuous with the correlation length of quantum fluctuations, diverging as , where the critical index . At a finite temperature the size of quantum fluctuations is restricted by the dephasing length with the dynamical critical index , which determines the characteristic energy and
is expected to be equal to for SIT.
The ratio of these two length parameters defines the scaling variable so that near the transition point () all data as a function of should fall on a universal curve
| (1) |
Although small in the scaling region, temperature dependent corrections with the leading quadratic term are expected to the critical resistance [1, 2].
The above theoretical description is based on the concept of electron pair localization which has been supported by a recent publication [3]. In that paper it is shown that for 2D superconducting films with sufficiently strong disorder the region of fluctuation superconductivity, where the localized electron pairs
occur, should extend down to zero temperature. In this region the unpaired electrons are supposed to be localized because of disorder in a film.
So far, a theory of the field-driven 3D quantum SIT has not been created. An idea to consider the quantum SIT for 3D disordered systems in zero magnetic field in terms of charged boson localization [4] was not at first accepted because the fluctuation superconductivity region was regarded to be small. In fact, as was shown later in Ref. [5], the fluctuation region enlarges as the edge of single electron localization is approached. This gives an opportunity to apply the scaling relation deduced for 3D boson localization [6] also for the field-induced SIT description
| (2) |
where is a universal function and the scaling variable is assumed to have the same form as defined by Eq. (1).
From Eqs. (1) and (2) it follows that in the vicinity of the isotherms are straight lines with slopes
| (3) |
where is the system dimensionality. Because the behaviours of the resistance in the relations (1) and (2) are very different, the problem of the film dimensionality is of major importance.
Data obtained in experimental studies on -In–O [7], -Mo–Ge [8], and -Mo–Si [9] followed the 2D scaling relation (1) except for the universality of the value.
This was regarded as evidence of existence of SIT. The failure in satisfying the scaling relations in ultrathin Bi films [10] was interpreted as indication of the absence of SIT and crossover observation between different flux-flow regimes. Studies [7, 8, 9] did not give arguments backing boson localization. At the first time such arguments are appeared by interpretation of the resistance drop at high fields observed on -In–O films [12, 13].
Here, we perform the detailed study of the scaling relations near the field-induced SIT for different states of an -In–O film. We find that the 2D scaling relation (1) holds for film states near the zero-field SIT but progressively fails as the zero-field SIT is departed from. This failure is manifested by the appearance of an extra temperature-dependent term in the film resistance.
The experiments were performed on 200 Å thick amorphous In–O films evaporated by e-gun from high-purity target onto a glass substrate [14].
This material proved to be very useful for investigations of the transport properties near the SIT [7, 11, 12, 15, 16]. Oxygen deficiency compared to fully stoichiometric insulating compound In2O3 causes the film conductivity. By changing the oxygen content one can cover the range from a superconducting material to an insulator with activated conductance [15]. The procedures to change reversibly the film state are described in detail in Ref. [12]. To reinforce the superconducting properties of our films we used heating in vacuum up to a temperature from the interval 70 – 110∘C until the sample resistance got saturated. To shift the film state in the opposite direction we made exposure to air at room temperature. As the film remains amorphous during these manipulations, it is natural to assume that the treatment used results mainly in a change of the total carrier concentration and that there is a critical concentration corresponding to the zero-field SIT.
The low-temperature measurements were carried out by a four-terminal lock-in technique at a frequency of 10 Hz using two experimental setups: a He3-cryostat down to 0.35 K or Oxford TLM-400 dilution refrigerator in the temperature interval 1.2 K – 30 mK. The ac current was equal to 1 nA and corresponded to the linear regime of response. The aspect ratio of the samples was close to one.
We investigated three different homogeneous states of the same amorphous In–O film [17]. We characterize the sample state by its room temperature resistance . Assuming that the disorder for all states is approximately the same, we have for the carrier density , i.e., the smaller , the deeper the state in the superconducting phase and, hence, the larger the value of .
| State | , k | , k | , T | , K-1 |
|---|---|---|---|---|
| 1 | 3.4 | 7.8 | 2.2 | 0 |
| 2 | 3.1 | 8 | 5.3 | -0.1 |
| 3 | 3.0 | 9.2 | 7.2 | -0.6 |
The parameters of the investigated states are listed in Table I. State 1 is the closest to the zero-field SIT and state 3 is the deepest in the superconducting phase.
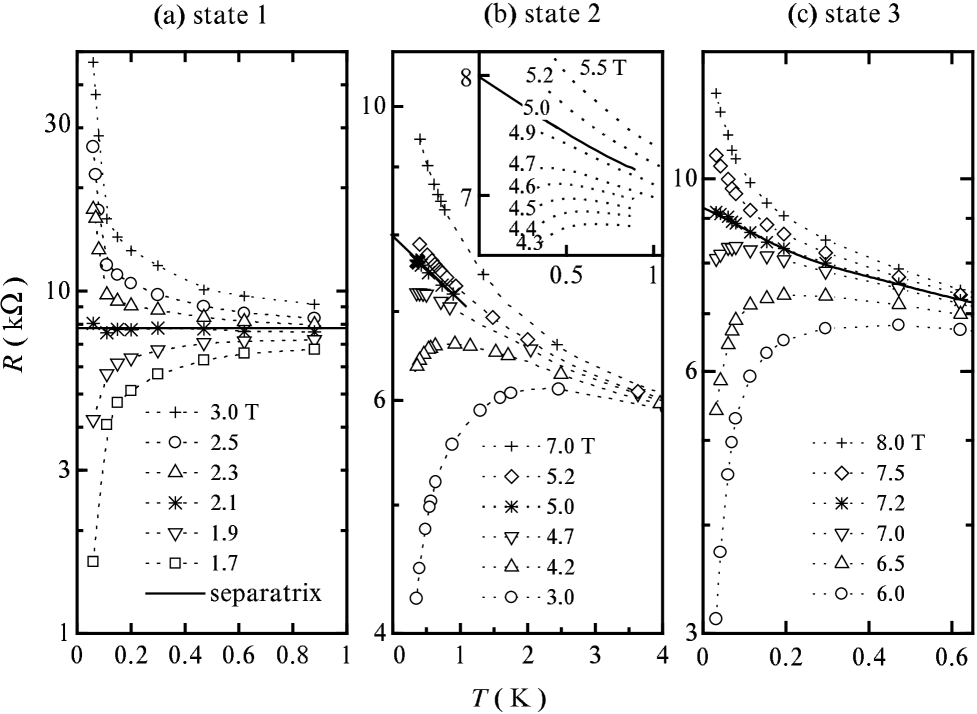
Sets of the isomagnetic curves for all studied states are depicted in Fig. 1. For each set the curves can be divided roughly into two groups by sign of the second derivative: the positive (negative) sign corresponds to the insulating (superconducting) behaviour. Henceforth, the boundary isomagnetic curve between superconductor and insulator, which corresponds to the boundary metallic state at , will be referred to as separatrix. While for state 1 it is easy to identify the horizontal separatrix in accordance with Eq. (1), for states 2 and 3 the fan and separatrix are ”tilted”, i.e., each of the curves in the lower part of the fan is a maximum at a temperature which shifts with . To determine the separatrix one has to extrapolate the maximum position to for which it is good to know the extrapolation law as the accessible temperature range is restricted.
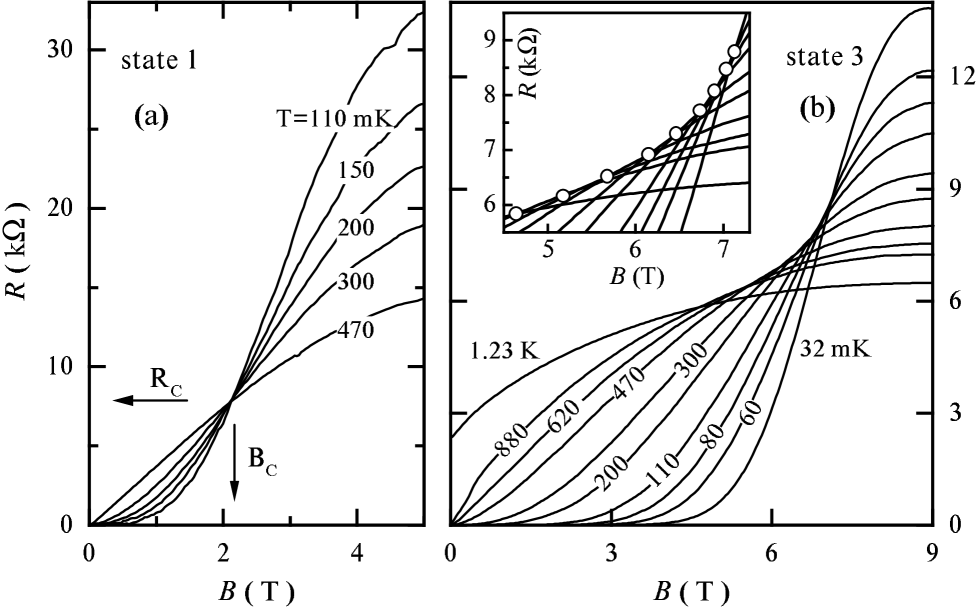
The absence of a horizontal separatrix for states 2 and 3 can also be established from the behaviour of isotherms (Fig. 2). As seen from the figure, the isotherms of state 1 cross at the same point () whereas those of state 3 form an envelope.
To determine and for states 2 and 3 we use the simplest linear extrapolation to of the functions and , see Fig. 3. The open symbols correspond to the maximum positions on isomagnetic curves (Fig. 1) and the filled symbols represent the data obtained from the intersections of consecutive isotherms [19] (Fig. 2): if two consecutive isotherms at close temperatures and intersect at a point (), the isomagnetic curve at the field reaches its maximum at .
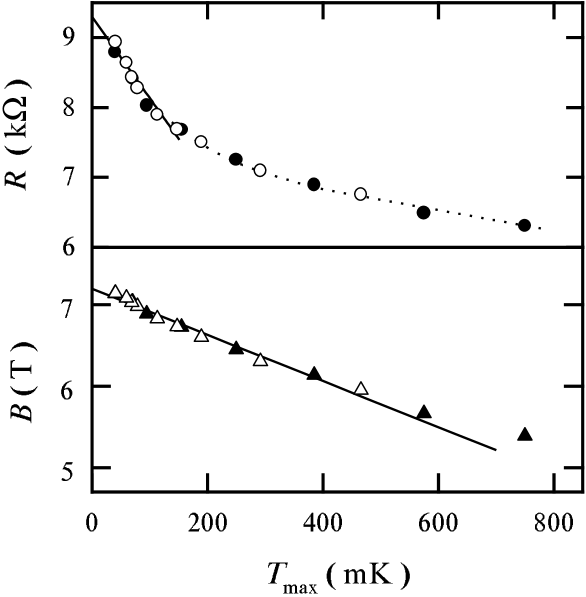
As seen from Fig. 3, the dependence is weak and so we believe that the linear extrapolation is good to extract . In contrast, the accuracy of the determination of is poor.
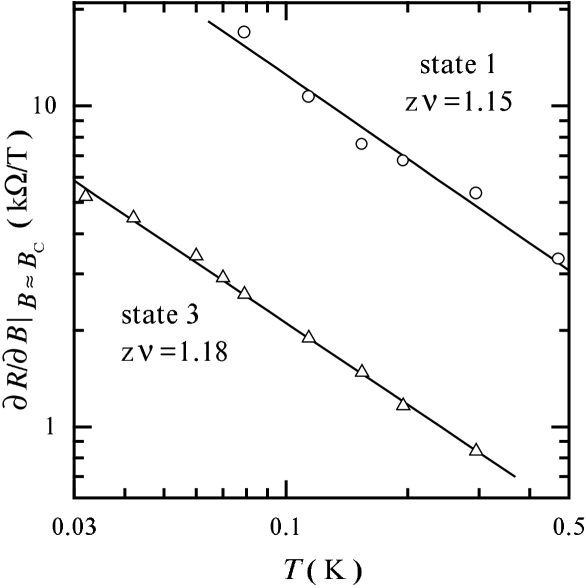
The derivative near as a function of temperature is shown in Fig. 4. The exponent turns out to be the same within experimental uncertainty for the film states 1 and 3 and is in agreement with results of Refs. [7, 8] where authors argued observation of the field-induced 2D SIT for states close to the zero-field SIT. This fact is in favour of 2D SIT scenario also for deeper film states in the superconducting phase.
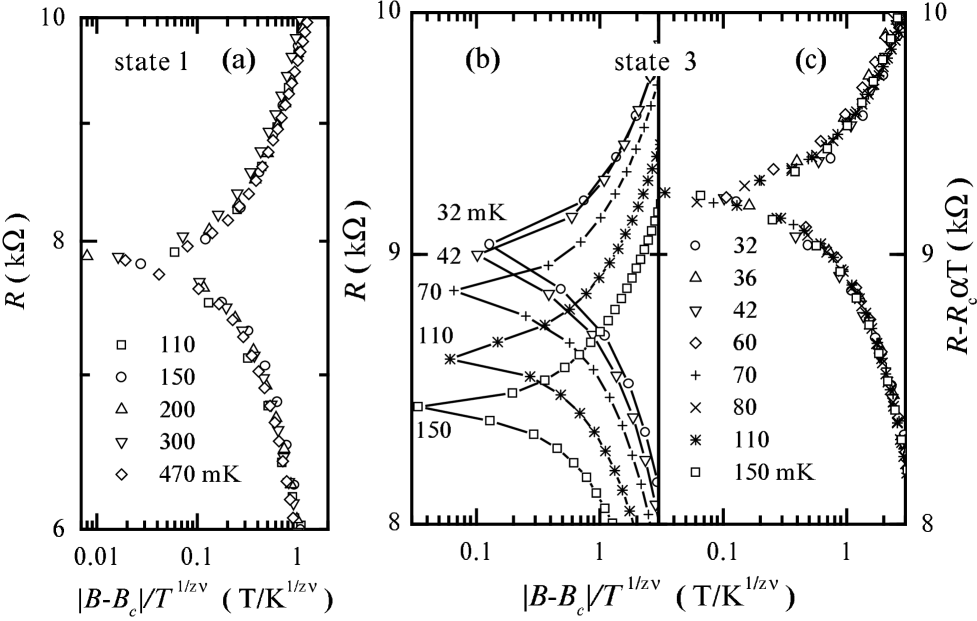
Knowing and the scaling exponent we can replot the experimental data as a function of scaling variable (Fig. 5). As seen from Figs. 5a and b, for state 1 the data collapse onto a single curve whereas for state 3 we obtain a set of similar curves shifted along the vertical axis. Subtracting formally from the linear temperature term (where is a factor) does reveal the 2D scaling behaviour for state 3 (Fig. 5c). We note that the procedure of dividing the experimental data in Fig. 5b by , which corresponds to the formula (2) for 3D scaling, does not lead to success.
Thus, we find that the 2D scaling holds for states near the zero-field SIT while the data for deeper states in the superconducting phase are best described by the relation (1) with an additive temperature-dependent correction
| (4) |
To get a basis for the formal analysis of the experimental data we have to answer two questions: (i) whether our film is really 2D; and (ii) what is the physical origin for the temperature dependence of ? In the first case we need to compare the film thickness with characteristic lengths. These are the coherence length (where is the mean free path in normal state) in superconducting state and the dephasing length [1, 2] that restricts the diverging correlation length in the vicinity of quantum SIT. Knowing the normal state film resistance k at K and assuming that we deal with the amorphous 3D metal in which the mean free path is normally close to the lowest possible value , we estimate the length Å. If we crudely evaluate the field at T as determined for state 3, we get
upper limit of
Å and Å at K. This supports the 2D scenario of quantum SIT although in the normal state the film turns out to be 3D.
With respect to the temperature-dependent , at finite temperatures the conductivity of the film near should include the contribution from localized normal electrons in addition to the conductivity defined by the diffusion of fluctuation-induced Cooper pairs [3, 8]. It is the normal electron conductivity that explains the non-universality of the critical resistance [8] as well as the additional term in Eq. (4). We write this term in the general form because the linear extrapolation used is likely to break in the vicinity of .
So, all of the experimental observations can be reconciled with the 2D scaling scenario. Intriguingly, the same scaling behaviour has been established in a parallel magnetic field [21]. Although not in favour of 2D concept, this fact indicates that the restrictions imposed by the theory [1] may be too severe.
We would like to mention an alternative way to make up for the term in Eq. (4): to introduce the temperature-dependent field defined through the constancy of . Formally both ways are equivalent and correspond to shifts of the isotherms in Fig. 2 either along the -axis or along the -axis so that in the vicinity of transition a common crossing point is attained. In contrast to the normal behaviour of the critical fields in superconductors, the so-defined increases with temperature. This can be interpreted in terms of temperature-induced boson delocalization.
In summary, in experiments on amorphous In–O films with different oxygen content we have found a change of the field-driven 2D SIT scenario as the film state departs from the zero-field SIT. For deep film states in the superconducting phase, in addition to the universal function of scaling variable that describes the conductivity of fluctuation-induced Cooper pairs, there emerges a temperature-dependent contribution to the film resistance. This contribution can be attributed to the conductivity of normal electrons.
We gratefully acknowledge useful discussions with V. Dobrosavljevich and A.I. Larkin. This work was supported by Grants RFBR 99-02-16117 and RFBR-PICS 98-02-22037 and by the Programme ”Statistical Physics” from the Russian Ministry of Sciences.
REFERENCES
- [1] M.P.A. Fisher, Phys. Rev. Lett. 65, 923 (1990); M.P.A. Fisher, G. Grinshtein, and S.M. Girvin, Phys. Rev. Lett. 64, 587 (1990).
- [2] S.L. Sondhi, S.M. Girvin, J.P. Carini, and D. Shahar, Rev. Mod. Phys. 69, 315 (1997).
- [3] A. Larkin, Ann. Phys. (Leipzig) 8, 785 (1999).
- [4] A. Gold, Z. Phys. B 52, 1 (1983).
- [5] L. Bulaevskii, A. Varlamov, and M. Sadovskii, Sov. Phys. Solid State 28, 997 (1986).
- [6] M.P.A. Fisher, P.B. Weichman, G. Grinstein, and D.S. Fisher, Phys. Rev. B 40, 546 (1989).
- [7] A.F. Hebard and M.A. Paalanen, Phys. Rev. Lett. 65, 927 (1990).
- [8] A. Yazdani and A. Kapitulnik, Phys. Rev. Lett. 74, 3037 (1995).
- [9] S. Okuma, T. Terashima, and N. Kokubo, Solid State Commun. 106, 529 (1998).
- [10] J.A. Chervenak and J.M. Valles, Jr, cond-mat. /9909329/
- [11] M.A. Paalanen, A.F. Hebard, and R.R. Ruel, Phys. Rev. Lett. 69, 1604 (1992).
- [12] V.F. Gantmakher, M.V. Golubkov, J.G.S. Lok, and A.K. Geim, JETP 82, 951 (1996).
- [13] V.F. Gantmakher, M.V. Golubkov, V.T. Dolgopolov, G.E. Tsydynzhapov, and A.A. Shashkin, JETP Lett. 68, 345 (1998).
- [14] The films were kindly presented by A. Frydman and Z. Ovadyahu from Jerusalem University.
- [15] D. Shahar, and Z. Ovadyahu, Phys. Rev. B 46, 10917 (1992).
- [16] J.J. Kim, J. Kim, and H.-L. Lee, Phys. Rev. B 46, 11709 (1992).
- [17] Observation of so-called quasireentrant states for the field-driven SIT was reported in Refs. [7, 16, 18] and explained by inhomogeneities and single-particle tunneling between superconducting grains [18]. This interpretation is supported in our experiments by the fact that the quasireentrant behaviour observed in some film states disappeared as a result of annealing the sample in vacuum for several additional hours after its resistance had already saturated. We do not discuss quasireentrant states in the present paper.
- [18] Y. Liu, D.B. Haviland, B. Nease, and A.M. Goldman, Phys. Rev. B 47, 5931 (1993).
- [19] Similar extrapolation procedure for determining has been used in Ref. [20] where metal-insulator transition in 2D system was studied and the carrier density was used as the driving parameter.
- [20] Y. Hanein, D. Shahar, J. Yoon, C.C. Li, D.C.Tsui, and H. Shtrikman, Phys. Rev. B 58, R7520 (1998).
- [21] V.F. Gantmakher, M.V. Golubkov, V.T. Dolgopolov, G.E. Tsydynzhapov, and A.A. Shashkin, Ann. Phys. (Leipzig) 8, SI-73 (1999).