CA Models for Traffic Flow: Comparison with Empirical Single-Vehicle Data
Abstract
Although traffic simulations with cellular-automata models give meaningful results compared with empirical data, highway traffic requires a more detailed description of the elementary dynamics. Based on recent empirical results we present a modified Nagel-Schreckenberg cellular automaton model which incorporates both a slow-to-start and an anticipation rule, which takes into account especially brake lights. The focus in this article lies on the comparison with empirical single-vehicle data.
1 Introduction
For a long time the modelling of traffic flow phenomena was dominated by two theoretical concepts (for a review, see e.g. [1]): Microscopic car-following models and macroscopic models based on the analogy between traffic flow and the dynamics of compressible viscous fluids. Both approaches are still used widely by traffic engineers but for practical purposes they are often not suitable, e.g. an efficient implementation for computer simulations of large networks is not possible. Macroscopic models use a large number of parameters which have partly no counterpart within empirical investigations. Moreover, the information which can be obtained using macroscopic models is incomplete in the sense that quantities concerning individual cars cannot be introduced or derived directly.
In order to fill this gap cellular automata (CA) models have been invented [2]. CA’s are microscopic models which are by design well suited for large-scale computer simulations. A comparison of the simulations with empirical data shows that already very simple approaches give meaningful results. In particular they can be used to simulate dense networks like cities [3] which are controlled by the dynamics at the intersections. However, for highway traffic a more detailed description of the dynamics seems to be necessary.
Recent empirical results show the existence of metastable states in traffic dynamics and the occurrence of synchronised flow [4, 5, 6], which can be identified by vanishing cross-correlations of the local density and the local flow [7]. Moreover, a detailed analysis of single-vehicle data [7] revealed important facts for the microscopic modelling of traffic. The time-headway distribution shows two characteristic peaks. Small time-headways () are a result of cars or clusters of cars moving with small headway but large velocity, a time-headway of can be identified with the drivers efforts for safety: It is recommended to drive with a distance of seconds. Additionally, the distance-headway gives the most important information for the adjustment of the car’s speed for the correct description of the car-car interaction. This is introduced in several models by the so-called optimal velocity (OV) curve. It has been shown that one universal optimal velocity curve for all density regimes does not exist, but individual curves for different densities can be calculated (see the article of Neubert et al. in these proceedings for more details). In fact, some model extensions of the CA model proposed by Nagel and Schreckenberg (NaSch) [2] exist which are capable to reproduce metastable states [8] or small time-headways [9, 10], but up to now it it not possible to generate synchronised traffic and the correct microscopic properties mentioned above.
Here we propose a new CA model generalising the NaSch model and some earlier extensions. We compared our simulations with the corresponding data used in [7]. The simulation data are evaluated by an artificial counting loop, i.e. we measured the speed and the time-headway of the vehicles at a given link of the lattice. This data set is analysed using the methods suggested in [7]. In particular the density is calculated via the relation where and are the mean flow and the mean velocity of cars passing the detector in a time interval of minute. This dynamical estimate of the density gives correct results only if the velocity of the cars between two measurements is constant, but for accelerating or braking cars, e.g. in stop-and-go traffic, the results do not coincide with the real occupation. In addition to the aggregated data also the single-vehicle data of each passing car are analysed. Although the empirical data have been obtained on a two-lane highway, the simulations are performed on a single-lane road with one type of cars, because the empirical results show no systematic lane dependence which is a consequence of the applied speed limit.
2 New Approach
Traffic networks can be classified as complex systems of a multitude of individual interacting agents. In contrast to urban traffic where the flow is dominated by intersections, signals etc., car characteristics like different maximal velocities, acceleration capabilities and car lengths become important on highways. In order to allow for a more realistic modelling of these characteristics we reduce the cell length of the standard NaSch model (see [2] for a detailed description of the model) to a length of . The acceleration and randomisation remains unaltered with one site per time step of which leads to a velocity discretisation of which is slightly above ”comfortable” acceleration of about [11].
The update rules of the new model combine the original NaSch model and some recent extensions, namely a slow-to-start rule [8] and an anticipation term [9, 10]. The slow-to-start rule allows to tune the velocity of the upstream front of a traffic jam directly. It turns out that for a realistic choice of the parameters the outflow of a jam does not achieve the capacity of the road. This empirical fact is known to lead to the existence of metastable states.
The next step towards a more realistic description of especially highway traffic is to introduce anticipation effects, i.e. the adjustment of speed also takes into account the expected behaviour of the leading vehicle. Anticipation leads to a much more efficient lane-usage in multi-lane traffic. Although both modifications significantly increase the realism of the simulations a complete description of traffic highway traffic is not yet possible. The main problem with the existing discrete models is that they fail to reproduce platoons of slow moving vehicles. These patterns are not as stable as in real traffic, i.e. the models overestimate the probability to form large compact jams.
This deficiency motivated us to prolong the range of interactions if a braking maneuver of the leading vehicle happens or, more figurative, we equipped the vehicles with brake lights. The event driven interaction leads to a timely adjustment of speeds and therefore to a more coherent movement of the vehicles in dense traffic. We implemented the reaction to a brake light simply by an increased randomisation parameter .
3 Validation of the Model
Obviously, the fundamental diagram of the new model coincides very well with the empirical data (Fig. 1). In comparison we observe a more narrow distribution of densities. This further narrowing is simply an artifact of the discretisation of the velocities which determines the upper limit of detectable densities.
The slow-to-start rule has been introduced in order to reduce the outflow of a jam. This rule is responsible for the formation of large jams at high densities. To measure the outflow we used a megajam initialisation. Obviously, the outflow is reduced considerably (inset of Fig. 1). Using the autocorrelation function of the measured local density of a system initialised with a megajam it is possible to determine the jam velocity. A detailed analysis leads to a value of about .

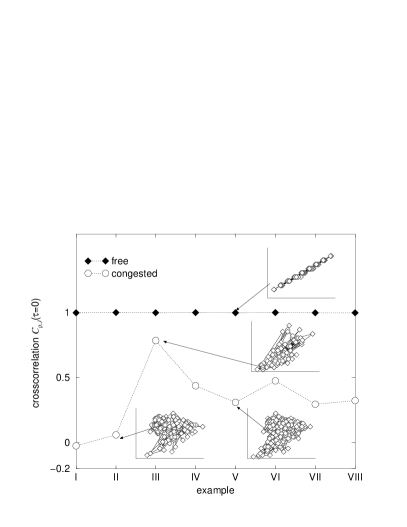
As a next step for the validation of the model we compared single-vehicle data of the simulation with the corresponding empirical data. In order to give a correct comparison of our simulation data with the data of Neubert et al. we tried to identify the three traffic states found in [7]. We therefore analysed the local data by means of the average velocity. A contiguous time series of minute averages above was classified as free flow, otherwise as congested flow. In Fig. 1 the cross-covariance of the flow and the local measured density for different traffic states is also shown. In the free-flow regime the flow is strongly coupled to the density indicating that the average velocity is nearly constant. Also for large densities, in the stop-and-go regime, the flow is mainly controlled by density fluctuations. In the mean density region there is a transition between these two regimes. At cross-covariances in the vicinity of zero the fundamental diagram shows a plateau which supports the interpretation of [7] that synchronised flow leads to . In the further comparison of our simulation with the corresponding empirical data we used these traffic states for synchronised flow data and congested states with for stop-and-go data.
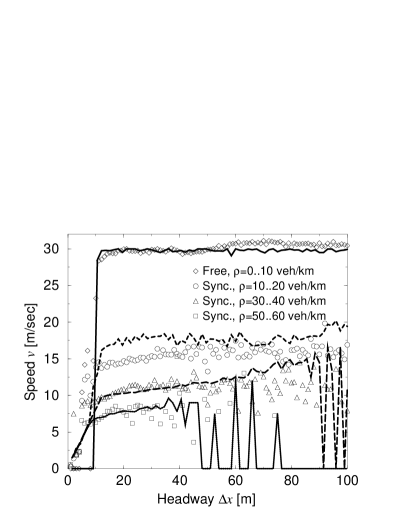
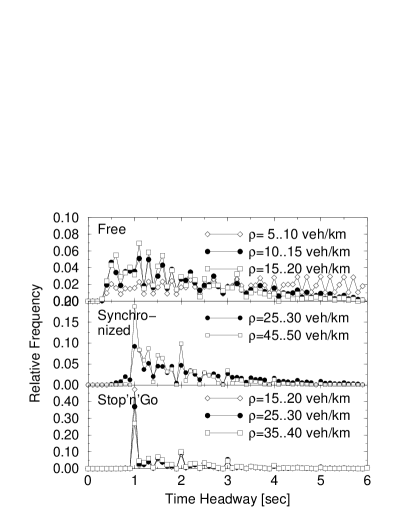
For the correct description of the car-car interaction the distance-headway (OV-curve) gives the most important information for the adjustment of the velocities. For densities in the free-flow regime it is obvious that the OV-curve (Figure 2) deviates from the linear velocity-headway curve of the NaSch model. Due to anticipation effects smaller distances occur, so that driving with is possible even within very small headways. This strong anticipation becomes weaker with increasing density and cars tend to have smaller velocities than the headway allows so that the OV-curve saturates for large distances. At headways of about the simulation data are in good agreement with the empirical ones, but for large distances the acceleration behaviour of the NaSch model cannot be suppressed so that the velocity increases with the headway. In Fig. 2 the time-headway distributions for different density regimes are shown. The time-headways are calculated via the relation with a resolution of . Due to the discrete nature of the model large fluctuations occur. In the free-flow state the anticipation rule is responsible for time-headways smaller than . The ability to anticipate the predecessors behaviour is getting weaker with increasing density so that small time-headways are nearly vanished in the synchronised and stop-and-go state. Two peaks arise in these states: The peak at a time of can be identified with the driver’s efforts for safety: It is recommended to drive with a distance of sec. Nevertheless, with increasing density the NaSch peak at a time of (in the NaSch model the minimal time-headway is restricted to ) becomes dominant. The higher the density the stronger this peak structure is pronounced.
4 Summary and Discussion
Based on empirical data we tried to find a simple extension of the original NaSch model which is able to reproduce metastable states and synchronised flow as well as microscopic features like density-dependent OV-curves and characteristic time-headways.
First of all, the original NaSch cell length had to be reduced for a more realistic acceleration behaviour which is especially important on highways. For a more realistic car-car interaction anticipation terms seem to play a crucial role. On the one hand, anticipation of the predecessors movement in the next time step allows small time-headways and therefore high flows. On the other hand, braking anticipation by means of brake lights enables a driver to anticipate an imminent velocity reduction due to a jam. It is this braking anticipation which leads to synchronised states and to increased time-headways which results in plateaus in the local fundamental diagram.
Unfortunately, in this short contribution it is not possible to describe all the features of the new model [12]. For example, a finer discretisation of the NaSch model or the corresponding limit leads to metastable states analogous to the VDR-model which can be characterised by an order parameter.
For a further validation of this approach it is necessary to extend the model to multi-lane traffic. The implementation of the new model in the Online-Simulation of the Autobahn network in Nordrhein-Westfalen should show its suitability for realistic traffic simulations.
References
- [1] Chowdhury, D., Santen, L., and Schadschneider, A., Curr. Sci. 77, 411 (1999) and Physics Reports (in press).
- [2] K. Nagel, and M. Schreckenberg, A cellular automaton model for freeway traffic, J. Physique I 2, 2221 (1992)
- [3] J. Esser, and M. Schreckenberg, Microscopic simulation of urban traffic based on cellular automata, Int. J. of Mod. Phys. C8, 1025 (1997).
- [4] B.S. Kerner, Experimental features of self-organization in traffic flow, Phys. Rev. Lett. 81, 3797 (1998).
- [5] B.S. Kerner and H. Rehborn, Experimental properties of phase transitions in traffic flow, Phys. Rev. Lett. 79, 4030 (1998).
- [6] B.S. Kerner and H. Rehborn, Experimental features and characteristics of traffic jams, Phys. Rev. E 53, R1297 (1996).
- [7] L. Neubert, L. Santen, A. Schadschneider, and M. Schreckenberg, Single-vehicle data of highway traffic: A statistical analysis, Phys. Rev. E60, 6480 (1999)
- [8] R. Barlovic, Santen L., Schadschneider A. and Schreckenberg M., Metastable states in cellular automata for traffic flow, Eur. Phys. J 5, 793 (1998)
- [9] W. Knospe, L. Santen, A. Schadschneider and M. Schreckenberg, Disorder effects in cellular automata for two-lane traffic, Physica A 265, 614 (1999)
- [10] C.L. Barrett and M. Wolinsky, Emergent Local Control Properties in Particle Hopping Traffic Simulations, in D.E. Wolf, M. Schreckenberg and A. Bachem (eds.), Traffic and Granular Flow, World Scientific (1996)
- [11] Institute of Transportation Engineers (1992). Traffic Engineering Handbook, Washington, DC.
- [12] W. Knospe, L. Santen, A. Schadschneider and M. Schreckenberg, in preparation