Roughening and preroughening transitions in crystal surfaces with double-height steps
Abstract
We investigate phase transitions in a solid-on-solid model where double-height steps as well as single-height steps are allowed. Without the double-height steps, repulsive interactions between up-up or down-down step pairs give rise to a disordered flat phase. When the double-height steps are allowed, two single-height steps can merge into a double-height step (step doubling). We find that the step doubling reduces repulsive interaction strength between single-height steps and that the disordered flat phase is suppressed. As a control parameter a step doubling energy is introduced, which is assigned to each step doubling vertex. From transfer matrix type finite-size-scaling studies of interface free energies, we obtain the phase diagram in the parameter space of the step energy, the interaction energy, and the step doubling energy.
Much attention has been paid to the phase transitions in crystal surfaces since they show rich critical phenomena. The interplay between roughening and reconstruction results in interesting phases, such as a disordered flat (DOF) phase, as well as flat and rough phases [1]. In the DOF phase the surface is filled with macroscopic amount of steps which are disordered positionally but have up-down order. Several solid-on-solid (SOS) type models have been studied, which reveals that the DOF phase is stabilized by the repulsive step-step interactions [2, 3, 4] or by specific topological properties of surfaces, e.g., Si(001) [5].
The SOS type model studies have been done in cases where the nearest-neighbor (NN) height difference, , is restricted to be equal to or less than 1 in units of the lattice constant. However, in real crystals there also appear steps with . For example, double-height steps on W(430) become more favorable than single-height steps at high temperatures since they have lower kink energy [6]. In this paper we investigate the phase transitions in crystal surfaces in the presence of the double-height steps with , especially focusing on the stability of the DOF phase. We study a generalized version of the restricted solid-on-solid (RSOS) model on a square lattice with the Hamiltonian given in Eq. (2). We study the model under the periodic and anti-periodic boundary conditions, from which various interface free energies are defined. The interface free energy is calculated from numerical diagonalizations of the transfer matrix, and the phase diagram is obtained by analyzing their finite-size-scaling (FSS) properties.
In the RSOS model the surface is described by integer-valued heights at each site on a square lattice. (The lattice constant in the direction is set to 1.) Only the single-height step (S step) with is allowed. It was found that the RSOS model with NN and next-nearest-neighbor (NNN) interactions between height displays the DOF phase when the NNN coupling strength is large enough [2]. The NNN coupling accounts for the repulsive interactions between parallel (up-up or down-down) step pairs. Parallel step pairs cost more energy than anti-parallel (up-down or down-up) step pairs.
The double-height step (D step) is incorporated into the RSOS model by relaxing the restriction on the NN height difference to . We only consider quadratic NN and NNN interactions between heights since they are sufficient to describe the key feature of the phase transitions. The total Hamiltonian is written as
| (1) |
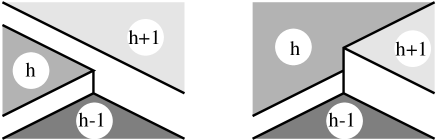
where and denote the pair of NN and NNN sites. With this Hamiltonian, a D step costs more energy than two separate S steps by an amount of per unit length. Even though the D steps are energetically unfavorable, we will show that their effect is not negligible. We also consider a step-doubling energy to study the effect of the step doubling. It is assigned to each vertex where two S steps merge into a D step (see Fig. 1). The electronic state at step edges may be different from that at a flat surface, which contributes to the step energy. When two S steps merge into a D step, the electronic state near the vertex may be changed. The change leads to an additional energy cost, which is reflected by . When is positive (negative), it suppresses (enhances) the step doubling. The Hamiltonian including and the step-doubling energy is then given by
| (2) |
where is the total number of step-doubling vertices. (For a notational convenience the energy is measured in unit of .) The model with the Hamiltonian Eq. (2) with and with the restriction will be referred to as the RSOS3 model, and the model with the Hamiltonian Eq. (2) and with will be referred to as the RSOS5 model.
In a continuum description phase transitions in crystal surfaces are described by the sine-Gordon model
| (3) |
where is a real-valued local average height field, the stiffness constant, and the fugacity of -charge [7]. In the renormalization group sense is irrelevant at high temperatures where the model renormalizes to the Gaussian model with a renormalized stiffness constant describing the rough phase. As temperature decreases, becomes relevant at a roughening transition temperature. There appear two kinds of low temperature phases depending on the sign of : For positive the Hamiltonian favors an integer average height and hence the surface is flat. For a negative it favors a half-integer average height. Since the microscopic height is integer-valued, the surface can take the half-integer average height by forming steps with up-down order, i.e., the surface is in the DOF phase. As temperature decreases further, the sign of changes and the surface falls into the flat phase. At the roughening transition between the rough phase and the flat or DOF phase, the renormalized stiffness constant takes the universal value of . The flat and DOF phases are separated by the preroughening transition characterized by [7].
The phase boundaries can be obtained using FSS properties of the interface free energies. Consider the model on a finite square lattice rotated by under the various boundary conditions (BC’s): The periodic BC, with integer , and the anti-periodic BC, with . They will be referred to as BC’s (the upper (lower) sign for the (anti-)periodic BC’s). The free energy is obtained from the largest eigenvalue of the transfer matrix. Detailed description of the transfer matrix set-up can be found in Ref. [2, 5]. The boundary conditions except for the BC induce a frustration in the surface. The interface free energy is defined as the excess free energy per unit length under the BC with from that under the BC:
| (4) |
with the partition function satisfying the -BC.
The interface free energies have characteristic FSS properties in each phase. In the rough phase they show the universal scaling in the semi-infinite limit as
| (5) | |||||
| (6) |
where is the renormalized stiffness constant of the Gaussian model and is the aspect ratio of the lattice constants in the horizontal and vertical directions [2, 8]. In the flat phase and are finite because at least one step is induced under the and BC’s, while is exponentially small in since the BC may not induce any steps [2]. In the DOF phase the BC does not induce any frustration in the step up-down order, but the and BC’s do. So is exponentially small in , and and are finite [2]. From these FSS properties the roughening points can be estimated from
| (7) |
where the universal value of at the roughening transition is used in Eq. (5). The preroughening points between the flat and the DOF phase can be estimated from the crossing behaviors of or , which converges to zero in one phase and diverges to infinity in the other phase as grows.
The estimation of transition points using the interface free energies suffers from slow convergence due to corrections to the scaling. They may smooth out the crossing behaviors of and at the preroughening transitions for small . But one can safely cancel out leading corrections to scaling by taking the ratio or the difference of them, which can be seen as follows. Consider the lattice version of the continuum model in Eq. (3). It is obvious, using the transformation , that the model under the BC is the same as that under the BC with replaced by for odd . It yields the relation
| (8) |
So if one neglects all higher order contributions from , the location of is found from the condition or with
| (9) |
It is not influenced by correction-to-scalings from . Therefore the relation can be used to get the point more accurately. One can easily see that for negative and for positive . It approaches 1 in the rough phase and at the preroughening transition points, diverges in the DOF phase, and vanishes in the flat phase as .

In the RSOS3 model the exact point with is known along the line [7]. It is called the self-dual point and is located at . From numerical studies of the RSOS3 model transfer matrix, we could obtain the exact value of with error less than by solving even with small system size , which indicates that is a useful quantity to determine the preroughening transition points accurately. It will be used in the analysis of the RSOS5 model.
We first consider the RSOS5 model in a special case of and compare its phase diagram with that of the RSOS3 model to have insight into the role of the D step. At low temperatures the D step is unfavorable due to larger free energy cost than the S step. So the nature of the low temperature phase in the RSOS5 model is not different from that in the RSOS3 model, i.e., the flat phase. At high temperatures, the surface is in the rough phase in the RSOS3 model. Since the rough phase is critical and there is no characteristic length scale, there will be no difference between S and D steps. So the RSOS5 model will also have the rough phase as a high temperature phase. There is significant difference in intermediate temperature range, where the repulsive step interactions stabilize the DOF phase in the RSOS3 model. Without the D steps the parallel steps have less meandering entropy than anti-parallel ones. It is energetically unfavorable for parallel steps to approach each other closer than the interaction range while anti-parallel steps can approach each other at will [2]. However, if one allows the D step, two parallel S steps can approach each other and form a D step without the interaction energy cost. Provided that the energy cost of the D step is not too high, the presence of the D step reduces repulsive interaction strength effectively and enhances the meandering entropy of parallel steps. Then it will suppress the DOF phase.
To see such effects quantitatively, we calculate the ratio for the RSOS3 model and the RSOS5 model with along a line (see Fig. 2). The strip width for the transfer matrix is , and for the RSOS3 model and , and for the RSOS5 model. The RSOS3 model displays the roughening and the preroughening transitions along the line , which is manifest in Fig. 2(a). There are three regions where dependence of is distinct with each other. The surface is in the rough phase with negative in the small (high temperature) region, where approaches from above. And the surface is in the DOF (flat) phase for the intermediate (large) region, where grows (vanishes). The roughening and preroughening transition points are estimated from Eq. (7) and with in Eq. (9), respectively, which are represented by broken vertical lines.
The situation changes qualitatively in the RSOS5 model. As can be seen in Fig. 2(b), is always less than 1, and there are only two regions with distinct dependence of . In the small region approach from below, and in the large region vanishes as increases. They correspond to the rough phase with positive and the flat phase, respectively. The roughening transition point is estimated from Eq. (7) and represented by the broken vertical line. It shows that the DOF phase is suppressed in the presence of the D step. We have also checked that is always less than 1 () and the DOF phase does not appear at any values of and in the RSOS5 model with .

We can argue the reason why the DOF phase disappear in the presence of the D step as follows. Consider two parallel S steps merging at a vertex. If the D step is not allowed, the possible vertex configuration is as shown in Fig. 3(a) and the energy cost for such configuration is . On the other hand, if the D steps is allowed, the step doubling may occur in two ways as shown in Fig. 3(b) with the energy cost . Though the step doubling costs more energy (), entropic contribution of the step doubling () may lower the free energy of parallel steps below than the value without the step doubling. Our numerical results above show that the step doubling suppresses the DOF phase entirely in the case. In our model a D step costs more energy than two separate S steps. The two energy scales may be comparable to each other in a more realistic model, where the suppression effect will be stronger.

From the above arguments, one finds that the step doubling plays an important role in phase transitions. So we introduce a new term in Eq. (2) with the step-doubling energy and study the phase diagram in the parameter space . When (), the step doubling is favored (suppressed). One can easily expect that the DOF phase does not appear for negative .
For positive the step doubling is suppressed and the effect of the step interaction becomes important. So we expect there appears the DOF phase in the positive side of the parameter space. In Fig. 4 we show the ratio for and along the line . Though the convergence is not good, compared with Fig. 2(a), one can identify three regions as the rough, DOF, and flat phases from the dependence of . The roughening point between the rough phase and the DOF phase is estimated using Eq. (7), and the preroughening point using for . They are denoted by broken vertical lines.
We obtain the phase diagram in the whole parameter space using the conditions for the roughening transition boundary and for the preroughening transition boundary. It is obtained for strip width , and . Since the maximum we can handle is small, the convergence of the phase boundary is poor especially as one approaches . But there is no qualitative change in shape. So we only present the phase diagram obtained from in Fig. 5. The region under the surface represented by broken lines corresponds to the rough phase. The DOF phase is bounded by the surfaces of broken lines and solid lines. The region above the surfaces corresponds to the flat phase. One should notice that there is a critical value of , approximately , smaller than which the DOF phase does not appear.

In summary, we have studied the phase transitions in the RSOS5 model with the Hamiltonian in Eq. (2) with D steps as well as S steps. We have found that the D step, which has not been considered in previous works, plays an important role in phase transitions in crystal surfaces. The presence of the D step reduces the strength of the repulsive interaction between parallel steps through the step doubling, and hence suppresses the DOF phase. We also found that the step-doubling energy is an important quantity which characterizes a surface upon the roughening.
I would like to thank D. Kim and M. den Nijs for helpful discussions. I wish to acknowledge the financial support of Korea Research Foundation made in the program year 1997. This work is also supported by the KOSEF through the SRC program of SNU-CTP.
REFERENCES
- [1] M. den Nijs, Chap. 4 in The Chemical Physics of Solid Surfaces and Heterogeneous Catalysis, Vol. 7, edited by D. King (Elseview, Amsterdam, 1994).
- [2] K. Rommelse and M. den Nijs, Phys. Rev. Lett. 59, 2578 (1987); M. den Nijs and K. Rommelse, Phys. Rev. B 40, 4709 (1989).
- [3] S. Prestipino, G. Santoro, and E. Tosatti, Phys. Rev. Lett. 75, 4468 (1995).
- [4] P.J.M. Bastiaansen, J. F. Knops, Phys. Rev. B 53, 126 (1996).
- [5] M. den Nijs, J. Phys. A 30, 397 (1997); J.D. Noh and M. den Nijs, J. Phys. A 30, 7375 (1997).
- [6] S. Dey, S. Kiriukhim, J. West, and E.H. Conrad, Phys. Rev. Lett. 77, 530 (1996).
- [7] M. den Nijs, Phys. Rev. Lett. 64, 435 (1990).
- [8] Y.M.M. Knops, B. Nienhuis, H.J.F. Knops, and H.W.J. Blöte, Phys. Rev. B 50, 1061 (1994).