Revised version
LU TP 96-01
Binary Assignments of Amino Acidsfrom Pattern Conservation
Anders Irbäck111irback@thep.lu.se and Frank Potthast222frank@thep.lu.se
Department of Theoretical Physics, University of Lund
Sölvegatan 14A, S-223 62 Lund, Sweden
To appear in Protein Engineering
Abstract
We develop a simple optimization procedure for assigning binary values to the amino acids. The binary values are determined by a maximization of the degree of pattern conservation in groups of closely related protein sequences. The maximization is carried out at fixed composition. For compositions approximately corresponding to an equipartition of the residues, the optimal encoding is found to be strongly correlated with hydrophobicity. The stability of the procedure is demonstrated. Our calculations are based upon sequences in the SWISS-PROT database.
1 Introduction
An amino acid sequence is a message in 20-letter code that determines the shape and function of the protein. This message is degenerate; amino acids may be exchanged to a certain degree without affecting the functionality of the protein in a drastic way [2]. For example, it has been demonstrated that the function of repressor is very tolerant to exchanges of core residues as long as the pattern of hydrophobicity remains unchanged [3]. The nature of the degeneracy can be probed by analyzing the Dayhoff mutation matrix [4] with respect to conservation of different physico-chemical properties. Results of such studies convincingly show that hydrophobicity plays a central role in the formation of protein structure [5].
As a first-order approach to the structure of proteins, it may therefore be tempting to take a simple two-letter code where the residues are classified as either hydrophobic or hydrophilic. A two-letter code can contain much structural information, as shown by studies of simplified models such as the lattice-based HP model [6] or the off-lattice model of Refs. [7, 8]. However, there are possible ways to reduce a 20-letter code to a binary code, and it is not obvious that the most efficient encoding is closely related to a specific physico-chemical property such as hydrophobicity.
In this note we present a simple optimization procedure for assigning binary values, , to the amino acids. The quantity which is optimized is the degree of pattern conservation in groups of closely related proteins sequences. In order to avoid trivial solutions, the optimization is carried out for a fixed number of , . Depending on , the optimal code may or may not have a simple physico-chemical interpretation. Here we shall focus on the results for , which turn out to be strongly correlated with hydrophobicity. Although not unexpected (cf Ref. [5]), this finding underlines the importance of hydrophobicity as the method is free from physico-chemical inputs. Furthermore, it should be stressed that the method is global in the sense that all possible encodings, for fixed , are considered.
Our calculations are based on groups of protein sequences extracted from the SWISS-PROT database [9], each group corresponding to a fixed length and a single protein but different species. Using a simple measure of similarity within these groups, the degree of pattern conservation is maximized. Although the procedure ignores problems due to insertions and deletions of residues, it turns out to be fairly robust. The robustness was tested by separately analyzing different parts of the data set. In this way one can also study the stability of individual binary values, and assign refined, non-binary, values to the residues.
Our method is somewhat related to the method of “optimal matching hydrophobicities” by Sweet and Eisenberg [10]. In this method hydrophobicity values are determined from mutation probabilities [4] by using an iterative procedure. Our method uses mutation frequencies rather than probabilities, and has the advantage that there is no need to specify initial values.
Another optimization procedure for determining hydrophobicity values has been proposed by Cornette et al. [11]. This method uses secondary-structure data rather than mutation data; sequence segments that form -helices are analyzed using Fourier methods. The hydrophobicity scale is obtained by maximizing of the strength of the signal for the 3.6 residue period characteristic of the -helix. A similar method has been used for detecting patterns in biologically related sequences [12].
The paper is organized as follows. In Sec. 2 we describe our method. In Sec. 3 we discuss the stability of the method and the results obtained. We end with a brief summary in Sec. 4.
2 Method
2.1 Forming groups of sequences
In our calculations we have used a set of sequence groups extracted from the SWISS-PROT database, release 31 [9]. Each group consisted of sequences with the same protein name and length , but different biological sources. All possible groups of this type were formed for . As an example, one of the groups is shown in Fig. 1. In order to test the size dependence of the results, the data set was divided into two parts corresponding to (380 groups containing 1251 sequences in total) and (227 groups, 717 sequences), respectively.

In forming these sequence groups we have ignored problems related to insertions and deletions of residues. This was done in order to keep the method as free as possible from physico-chemical inputs. It is possible that the method can be improved by incorporating some carefully chosen alignment technique. Also, the groups are small; typically, they contain three to four sequences. It is therefore important to check the stability of the procedure, which will be done in Sec. 3.
In our analysis we have removed uncertain sequences by ignoring all entries in the database containing the feature keys UNSURE (indicates uncertainties in the sequence), NON_TER (an extremity of the sequence is not the terminal residue) and NON_CONS (two residues in the sequence are not consecutive). Furthermore, we removed sequences containing the letters B (denoting Asp or Asn), Z (Gln or Glu) and X (any amino acid).
2.2 Comparing binary assignments
A binary encoding of the amino acids is a mapping from the original 20-letter alphabet to a two-letter alphabet, which we shall write as where specifies the amino-acid type. Using the sequence groups described above, we shall assign a number to each encoding . The quantity provides a measure of pattern conservation and will be optimized. To define we proceed in three steps.
First we define the distance between two arbitrary amino-acid sequences and of the same length ,
| (1) |
is the usual Hamming distance between the binary strings and and takes integer values between 0 and . Note that remains unchanged under a simultaneous change of the signs of all ’s, i.e., for all and if for all . This implies a twofold degeneracy in space.
Next we define a measure of the flucuations within one group of sequences. For a group labeled consisting of the sequences (all having the same length) we put
| (2) |
where the normalization is chosen so as to make the scaling of linear in (the sum has terms). A low value signals high degree of similarity between the binary strings. The calculation of is illustrated in Fig. 1 for two different ; is high to the left and low to the right.
The quantity will not have a unique minimum unless the group labeled is large. Finally, we therefore take a set of different sequence groups and define the optimal encoding as
| (3) |
where
| (4) |
It is not meaningful to minimize over all possible , since vanishes if is a constant. In order to avoid this trivial solution, we have performed minimizations for different fixed numbers of positive ’s, . The twofold degeneracy mentioned above disappears when is held fixed and . Furthermore, the symmetry implies that it is sufficient to consider . The number of distinguishable encodings varies from 20 for to 92378 for .
3 RESULTS
3.1 Minimizing
We have performed the minimization described in the previous section for and and for . In this subsection we present the results and discuss the robustness of the procedure. In the next subsection we discuss the interpretation of the results.
The minimizations were carried out in a straightforward way by enumerating all possible encodings, which turned out to be feasible for all . In Table 1 we show the minimum of , , for different and . The interpretation of depends on , as will be discussed below. Results for different are therefore not to be thought of as corresponding to some fixed property such as hydrophobicity (the results for are strongly correlated with hydrophobicity, as will be shown below).
| A | C | D | E | F | G | H | I | K | L | M | N | P | Q | R | S | T | V | W | Y | |
|---|---|---|---|---|---|---|---|---|---|---|---|---|---|---|---|---|---|---|---|---|
| 1 | + | |||||||||||||||||||
| 2 | + | + | ||||||||||||||||||
| 3 | + | + | + | |||||||||||||||||
| 4 | + | + | + | + | ||||||||||||||||
| 5 | + | + | + | + | ||||||||||||||||
| 6 | + | + | + | + | + | + | ||||||||||||||
| 7 | + | + | + | + | + | + | + | |||||||||||||
| 8 | + | + | + | + | + | + | + | + | ||||||||||||
| 9 | + | + | + | + | + | + | + | + | + | |||||||||||
| 10 | + | + | + | + | + | + | + | + | + | + | ||||||||||
| 1 | ||||||||||||||||||||
| 2 | + | + | ||||||||||||||||||
| 3 | + | + | + | |||||||||||||||||
| 4 | + | + | + | + | ||||||||||||||||
| 5 | + | + | + | + | + | |||||||||||||||
| 6 | + | + | + | + | + | + | ||||||||||||||
| 7 | + | + | + | + | + | + | + | |||||||||||||
| 8 | + | + | + | + | + | + | + | + | ||||||||||||
| 9 | + | + | + | + | + | + | + | + | + | |||||||||||
| 10 | + | + | + | + | + | + | + | + | + | + |
From Table 1 it can be seen that the size dependence of the results is fairly weak, and that the structure of varies slowly with . These observations indicate a certain degree of stability. In order to check the stability of the method in more detail, we divided the data set into blocks (see Table 2) and performed a separate optimization for each block. In Table 3 we show the results of these calculations for . For each block the irrelevant overall sign of (see Sec. 2) was chosen so as to minimize the Hamming distance to for the full data set. For the full data set the overall sign was fixed by setting . The results shown in Table 3 clearly demonstrate the stability of the method; for example, it can be seen that twelve of the amino acids have been assigned the same binary value in twelve or more of the fourteen independent block calculations. Note that the stability of the assignment is amino-acid dependent. This will be used below to define a refined, non-binary, scale.
| Block | First entry | Last entry | No. of sequences | No. of groups |
|---|---|---|---|---|
| B1 | ACBP_BOVIN | CRBL_VESXA | 158 | 51 |
| B2 | CSPA_ECOLI | FER_SYNY4 | 161 | 45 |
| B3 | FER_ARCLA | LYS3_SHISO | 149 | 52 |
| B4 | MAST_POLJA | NXS2_NAJNI | 158 | 45 |
| B5 | NXSB_LATCR | PYY_RANRI | 169 | 40 |
| B6 | REV_SIVA1 | S10A_HUMAN | 155 | 47 |
| B7 | S10B_BOVIN | VA15_VARV | 152 | 53 |
| B8 | VB09_VACCC | YVDC_VACCV | 149 | 47 |
| C1 | ACP_BRACM | CYC_KLULA | 117 | 33 |
| C2 | CYC_BRAOL | H3_VOLCA | 119 | 39 |
| C3 | H3_ACRFO | NU3C_WHEAT | 121 | 36 |
| C4 | NU3M_ASCSU | RL20_ECOLI | 124 | 33 |
| C5 | RL20_MAIZE | VAL3_TYLCV | 116 | 41 |
| C6 | VDBP_CAMVC | YV1_TYLCH | 120 | 45 |
| A | C | D | E | F | G | H | I | K | L | M | N | P | Q | R | S | T | V | W | Y | |
| Full | + | + | + | + | + | + | + | + | + | + | ||||||||||
| B1 | + | + | + | + | + | + | + | + | + | + | ||||||||||
| B2 | + | + | + | + | + | + | + | + | + | + | ||||||||||
| B3 | + | + | + | + | + | + | + | + | + | + | ||||||||||
| B4 | + | + | + | + | + | + | + | + | + | + | ||||||||||
| B5 | + | + | + | + | + | + | + | + | + | + | ||||||||||
| B6 | + | + | + | + | + | + | + | + | + | + | ||||||||||
| B7 | + | + | + | + | + | + | + | + | + | + | ||||||||||
| B8 | + | + | + | + | + | + | + | + | + | + | ||||||||||
| Full | + | + | + | + | + | + | + | + | + | + | ||||||||||
| C1 | + | + | + | + | + | + | + | + | + | + | ||||||||||
| C2 | + | + | + | + | + | + | + | + | + | + | ||||||||||
| C3 | + | + | + | + | + | + | + | + | + | + | ||||||||||
| C4 | + | + | + | + | + | + | + | + | + | + | ||||||||||
| C5 | + | + | + | + | + | + | + | + | + | + | ||||||||||
| C6 | + | + | + | + | + | + | + | + | + | + |
Another way to test the stability is to study the distribution of . In Fig. 2 we show two histograms of corresponding to and , respectively, for . These histograms were obtained using the full data sets. Also using the full data set, we then computed for each from the block analysis. The positions of these fourteen values are shown in Fig. 2. They are all located in the low 0.1% tails of the histograms, which gives another demonstration of the stability of the method.

3.2 Interpretation
It is well-known that physico-chemical properties can be extracted from mutation probabilities, as, e.g., in the method of Sweet and Eisenberg [10]. Our approach is different since it is based on mutation frequencies rather than probabilities. Somewhat surprisingly, it turns out that physico-chemical information can be obtained in this way also.
In our method the optimized quantity is defined as the total number of pattern-breaking bits, without reference to the frequency of occurrence of the amino acids. In this way emphasis is put on the overall degree of pattern conservation rather than the values assigned to individual amino acids. Whether the individual amino-acid values still contain useful information is a priori unclear. A necessary condition for that is, of course, that the corresponding degree of pattern conservation is relatively high. If, on the other hand, the mutations are more random, then the assigned values tend to reflect the frequency of occurrence of the amino acids; the procedure then tends to put rare amino acids in the smallest group (corresponding to if ).
In Fig. 3 we show amino-acid frequency [16] against for the results corresponding to . As can be seen from this figure, there is a strong correlation between frequency and binary value for . This does not necessarily imply that the binary values solely reflect frequency; for example, W and C, the amino acids with for (), are not only rare but have, in fact, been found to be the least mutable residues [17]. However, it is clear that in order to extract any physico-chemical information for a more detailed analysis is required, which is beyond the scope of the present paper.

For it is clear that the binary values contain non-trivial information since the correlation between binary value and frequency is fairly weak. In what follows we shall discuss the results for in some detail.
In order to take into account the fact that the stability of the binary value is amino-acid dependent, we begin by forming the average of the results from the block analysis;
| (5) |
where denotes the result obtained using data block . As the size dependence was found to be weak, the average has been taken over all the blocks in Table 2 ().
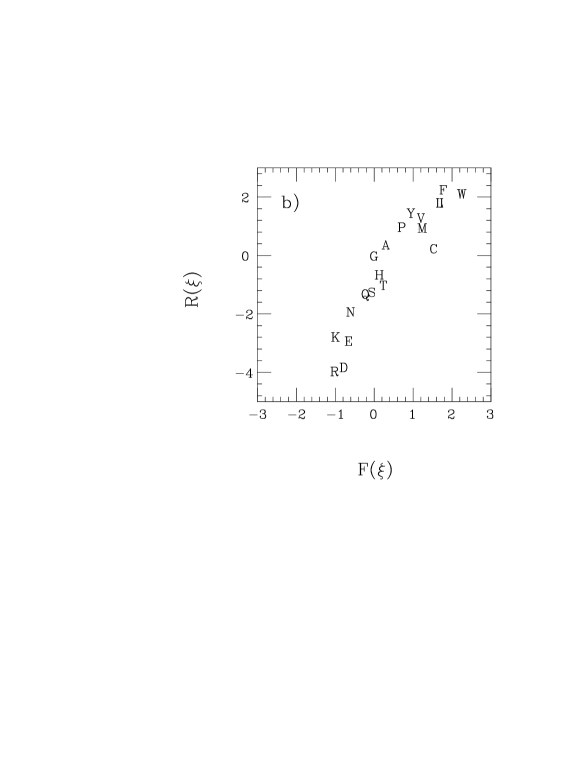
In Fig. 4a we have plotted against hydrophobicity, using the scale of Fauchère and Pliska [13]. From this figure it is clear that is strongly correlated with hydrophobicity. The correlation coefficient is 0.91, which, in fact, is a representative value for what Cornette et al. typically found when comparing various existing hydrophobicity scales [11]. As an example, we show in Fig. 4b the scale of Fauchère and Pliska against that of Roseman [14] (correlation coefficient 0.93). The correlation between and hydrophobicity is much stronger than that between and frequency of occurrence (correlation coefficient -0.32).
The correlation between and hydrophobicity becomes weaker as decreases, but remains fairly strong down to .

4 Summary
We have developed a simple optimization procedure based on pattern conservation for assigning binary values to the amino acids. In this method the optimal encoding is determined by a global search at fixed composition, i.e., fixed value of the parameter . The interpretation of the optimal encoding depends on . For we have shown that the results are strongly correlated with hydrophobicity. Since the method is global and free from physico-chemical inputs, this finding illustrates the importance of the hydrophobicity pattern.
The stability of the method was demonstrated by applying it to independent sets of protein sequences. The method can probably be improved by incorporating some sequence alignment technique. However, it is important that this is done in such a way that the amount of physico-chemical input is kept at a minimum. The method can easily be generalized to non-binary scales.
As an example of a possible application of our method, let us mention the question of how the statistical distribution of amino acids along functional protein sequences differs from a random distribution. This question has recently been addressed using binary assignments based on hydrophobicity [15]. By studying long-range correlations, it was demonstrated that protein sequences differ from random sequences in a statistically significant way. Alternative assignments such as those presented here may be useful in studying the nature of these deviations from randomness.
Acknowledgements
We thank Carsten Peterson, Roberto Ugoccioni and Christian Witt for
useful discussions.
References
- [1]
- [2] See e.g. Bowie,J.U., Reidhaar-Olson,J.F, Lim,W.A. and Sauer,R.T. (1990), Science, 247, 1306–1310.
- [3] Lim,W.A. and Sauer,R.T. (1989) Nature, 339, 31–36.
- [4] Dayhoff,M., Schwartz,R.M. and Orcutt,B.C. (1978) In Dayhoff,M. (ed.), Atlas of Protein Sequences and Structures, vol. 5, supplement 3, pp 345–352, National Biomedical Research Foundation, Silver Spring, Md.
- [5] For a review, see Taylor,W.R. (1986) J. Theor. Biol., 119, 205–218.
- [6] Lau,K.F. and Dill,K.A. (1989) Macromolecules, 22, 3986–3997.
- [7] Stillinger,F.H., Head-Gordon,T. and Hirshfeld,C.L. (1993) Phys. Rev., E 48, 1469–1477.
- [8] Irbäck,A. and Potthast,F. (1995) J. Chem. Phys., 103, 10298–10305.
- [9] Bairoch,A. and Boeckmann,B. (1994) Nucleic Acids Res.22, 3578–3580.
- [10] Sweet,R.M. and Eisenberg,D. (1983) J. Mol. Biol., 171, 479–488.
- [11] Cornette,J.L., Cease,K.B, Margalit,H., Spouge,J.L., Berzofsky,J.A. and DeLisi,C. (1987) J. Mol. Biol., 195, 659–685.
- [12] Viari,A., Soldano,H. and Ollivier,E. (1990) CABIOS, 6, 71–80.
- [13] Fauchère,J. and Pliska,V. (1983) Eur. J. Med. Chem. , 18, 369–375.
- [14] Roseman,M.A. (1988) J. Mol. Biol., 200, 513–522 (1988).
- [15] Irbäck,A., Peterson,C. and Potthast,F. (1996) Proc. Natl. Acad. Sci. USA, 93, 9533–9538.
- [16] Creighton,T.E. (1993) Proteins: Structures and Molecular Properties. W.H. Freeman and Company, New York.
- [17] Jones,D.T, Taylor,W.R. and Thornton,J.M. (1992) CABIOS, 8, 275–282.