Cross-spectral analysis of physiological
tremor and muscle activity.
II. Application to synchronized EMG
J. Timmer1,
M. Lauk1,2,
W. Pfleger1 and
G. Deuschl3
1Zentrum für Datenanalyse und Modellbildung, Eckerstr. 1, 79104 Freiburg, Germany
2Neurologische Universitätsklinik Freiburg, Breisacher Str. 64, 79110 Freiburg, Germany
3Neurologische Universitätsklinik Kiel, Niemannsweg 147, 24105 Kiel, Germany
(to appear in Biological Cybernetics)
We investigate the relationship between synchronized muscle activity and tremor time series in (enhanced) physiological tremor by cross-spectral analysis. Special attention is directed to the phase spectrum and its possibilities to clarify the contribution of reflex mechanisms to physiological tremor. The phase spectra are investigated under the assumptions that the EMG synchronization was caused by a reflex, respectively a central oscillator. In comparison of these results to phase spectra of measured data we found a significant contribution of reflexes. But reflexes only modify existing peaks in the power spectrum. The main agents of physiological tremor are an efferent pace and the resonant behavior of the biomechanical system.
1 Introduction
The contribution of reflex loops to (enhanced) physiological tremor is still a matter of debate (Elble and Koller 1990). Most experiments investigating this topic used some kind of manipulation of the system. For example, Lippold (1971) cooled the limb in order to reduce the velocity of nerve conduction, Rack et al. (1978) examined the reflex response to enforced sinusoidal movement of the limb and Young and Hagbarth (1980) investigated several manoeuvres that affect the stretch reflex to enhance physiological tremor (ETP). We intend to investigate the role of reflex mechanisms by cross-spectral analysis of surface electromyogram (EMG) and accelerometer data (ACC) without perturbing the system externally. Former applications of this technique to physiological tremor are given in (Fox and Randall 1970; Pashda and Stein 1973; Elble and Randall 1976; Iaizzo and Pozos 1992). These authors interpreted the phase spectrum at single, fixed frequencies in terms of delays between the EMG and the AC.C We examine the whole phase spectrum and investigate whether the phase spectrum can help to clarify the role of reflexes in EPT.
Typical EPT usually shows two significant peaks in the ACC power spectrum. These peaks exhibit a different behavior if the hand is loaded. While often indistinguishable located around 10 to 12 Hz if the hand is not loaded, one peak moves to lower frequencies under increasing loads. This peak is called mechanical peak since it depends on the mechanical properties of the musculosceletal system. An EMG peak at the same frequency shows up occasionally. The frequency of the second peak does not vary under moderate loading and is always accompanied by a peak in the EMG power spectrum (Hömberg et al. 1987; Elble and Koller 1990). This peak is called neurogenic. It is still controversial whether these EMG synchronizations result from reflex loops, by chance synchronization or from a central oscillator (see Allum et al. 1978; Stiles 1980; Christakos 1982; Allum 1984; Elble and Koller 1990 for a review). The two latter hypotheses can not be distinguished by cross-spectral analysis.
For both hypotheses of reflex mechanisms and non-reflex mechanisms, we calculate the power spectrum, the cross-correlation function and the phase spectrum. In the case of the non-reflex hypothesis, it is possible to derive these quantities analytically. In the case of reflexes, some kind of nonlinearity has to be introduced into the feedback system which hinders an analytical treatment. Based on a stochastic feedback system for the effects of reflexes we perform simulation studies to understand the behavior of the cross-correlation function and the spectra. This model is a generalization of the deterministic model introduced by Stein and Oguztöreli (Stein and Oguztöreli 1975, 1978; Oguztöreli and Stein 1975, 1976, 1979; Bawa et al. 1976a, 1976b).
It should be mentioned that the well developed theory of Volterra - Wiener kernel estimators, which has been successfully applied to model physiological feedback systems (Marmarelis 1989) can not be applied to the problem under investigation since it requires the input data of the system, which are not available here.
We do not intend to derive a quantitative model of the reflex mechanism. We will use the phase spectra as an indicator for the presence of reflex contributions by comparing the predicted phase spectra under both hypotheses with those estimated from measured data. For both cases the mechanical properties of the hand are modeled by an autoregressive process of order to two (AR[2]) covered by observational noise (Stiles and Randall 1967; Randall 1973; Rietz and Stiles 1974; Elble and Koller 1990; Gantert et al. 1992). The synchronized (possible) non-reflex part of the rectified EMG is also described by an AR[2] process. We claim no physiological significance for this EMG model; it is used solely as a description of the data and an approximation to the true statistical behavior of this part of the EMG. Since we only investigate second order statistical properties of the signals this description is adequate if the power spectra of the model and the data are similar. This model is justified by the over-all consistent description of the phenomena observed in the data.
In a companion paper (Timmer et al. 1998), we have described the recording conditions, the mathematical methods and their application to EMG and ACC data for cases where the EMG does not show significant synchronization.
This paper is organized as follows. In the next section we discuss the characteristic features of the phase spectrum between EMG and ACC assuming that the synchronized EMG does not result from a reflex mechanism. In Section 3 we give the corresponding results assuming a significant contribution of reflex loops. In Section 4 we give the results for 35 data sets recorded from 19 subjects.
2 Non reflex mechanisms
In this section, we show the expected behavior of the different kinds of spectra assuming that the synchronized EMG activity is not caused by any reflex loop. Such a synchronization can result from motor units firing asynchronously at similar rates (Christakos 1982) or some central oscillator. Cross-spectral analysis will not be able to distinguish between peripheral and central non-reflex mechanisms. We first show results of simulations and then applications to measured data.
2.1 Simulations
If the synchronization of the EMG is not caused by a reflex, the position of the hand, (the ACC is obtained by differentiating twice), is described by an AR process driven by colored noise. Denoting uncorrelated EMG activity by , the synchronized EMG by , and a possible time delay of the effect of the EMG on the ACC by , the model reads:
| (1) | |||||
The parameters and describe the physical properties of the hand/muscles system, i.e. resonance frequency and damping rate . and were chosen in order to simulate the desired power spectra of the EMG. Observational noise was added to obtain the measured EMG and ACC. The power spectrum of the ACC is given by (15) of the companion paper (Timmer et al. 1998). The phase spectrum does not depend on the properties of the EMG activity. Fig. 1 gives the results for the case that the EMG peak shows a higher frequency (14 Hz, ) than the resonance frequency of 10 Hz (, ) of the hand. This situation is similar to that often found in physiological tremor when the hand is loaded. Fig. 1a shows the power spectra of EMG and ACC, Fig. 1b the coherency spectrum and Fig. 1c the phase spectrum which is displayed periodically for a range of . Fig. 1d the cross-correlation function. In Fig. 2, results for the opposite peak frequency location ( ) are displayed. This situation is similar to the finger tremor with a resonance frequency of about 20 Hz, whereas the EMG spectrum remains usually unchanged. Note, that the phase spectrum only depends on the resonant system.


Phase spectra like those in Fig. 1 und 2 have been interpreted in earlier publications only at the frequency of maximum coherency in terms of a delay (Pashda and Stein 1973; Elble and Randall 1976) by . Obviously, such an interpretation might be misleading, since no delay is included in the process. The frequency of maximum coherency is determined by the frequency dependent signal to noise ratio ((27) of the companion paper) und usually occurs at the peak frequency of the EMG. The phase spectrum evaluated at the peak frequency of the EMG only contains the information whether the resonance frequency of the hand/muscle system is located above or below the EMG peak frequency.
The cross-correlation function is difficult to interpret. The period of the cross-correlation function is mainly determined by the frequency of highest coherency and modulated by frequencies of medium coherency. Obviously, the time-lag where the cross-correlation function shows its maximum may, in general, not be interpreted as a time delay between the processes. The magnitude of the cross-correlation function is similar for positive and negative lags. Especially for negative time lags, it exceeds significantly the 5 % significance level of of zero cross-correlation derived under the assumption that at least one of the independent processes is white noise. The reason is that the autocorrelation function of both processes and the true cross-correlation function enters the correlation structure of the estimated cross-correlation function here. Thus, large values of the cross-correlation function for negative time lags, suggesting an effect from the ACC on the EMG, do not necessarily indicate the involvement of a reflex loop.
2.2 Application to measured data and modeling
Fig. 3 shows the results of an analysis of a physiological hand tremor showing an EMG synchronization at approximately Hz. It resembles to Fig. 1. The behavior of the coherency can be explained as an effect of observational noise by (27) of the companion paper. In order to show that these results can be interpreted in the framework of linear models we fitted a model of seven parameters according to (1,2.1) to the empirical data. The seven parameters are periods and relaxation times describing the EMG and the mechanical properties of the hand, the variance of the observational noise covering EMG and ACC and the amount of additional unsynchronized EMG activity. By Equations (2,3,4,5,13,15,22,23,27) of the companion paper these parameters can be estimated from the data. Fig. 4 shows the results of a simulation of the fitted model. All quantitative details of Fig. 3 are reproduced by the model.


3 Reflex mechanisms
Pioneered by the work of Lippold (Lippold 1957, 1970) various experiments were performed to clarify the effect of reflex mechanisms on physiological tremor. In most of these experiments a mechanical or electrical stimulus was applied to measure the response of the muscle (Rack et al. 1978, Hagbarth and Young 1979, Matthew 1994). By cross-spectral analysis we studied the role of reflexes in physiological tremor without perturbing the system, i.e. the stimulus for the reflexes is the tremor itself.
3.1 Simulations
To investigate the phenomena that might be induced by reflex mechanisms, we use a stochastic feedback system which applies a sigmoidal nonlinearity describing the activation function of the motoneurons. The effects of such an activation function in a deterministic framework simulating spinal as well as cortical feedback delays were introduced by Stein and Oguztöreli (Stein and Oguztöreli 1975, 1978; Oguztöreli and Stein 1975, 1976, 1979). The reflex model of Stein and coworkers includes the muscle length and velocity. We use the tremor amplitude and velocity. Because of the small amplitude these quantities are proportional. In order to study the influences of reflex mechanisms on the spectra, we used the following model. Denoting the reflex induced EMG by , the unsynchronized EMG activity by , the movement of the hand by , a possible time delay of the effect of the EMG on the hand by , and the reflex loop delay by we receive:
| (3) | |||||
For the function we chose the tangens hyperbolicus with gain ; and describe the physical properties of the musculosceletal system. models the length dependent and the velocity dependent reflex. Observational noise was added to both processes. Its standard deviation was 10 % of the standard deviation of the noise free data. Note, that (3,3.1) form a nonlinear stochastic delay differential equation.
Due to the nonlinear activation function, in general, the spectra can not be calculated analytically. We performed simulation studies in order to investigate the behavior of the spectra. The unique result for various settings of the parameters is, that
-
•
the EMG power spectrum shows a peak at the same frequency as the ACC power spectrum. The former might be hidden by the observational noise.
-
•
in accordance with Oguztöreli and Stein (1975) the frequency of the oscillation is a complex function of the delays and the properties of the hand and muscles. Fig. 5a displays the reflex induced frequency shift in dependence on the delay of the reflex loop. Fig. 5b shows this shift as a function of the characteristic period of the mechanical system.
-
•
the phase spectrum is given by the mechanical properties of the hand/muscle system represented by and , i.e. not dependent on the reflexes.
-
•
the peaks of the ACC are sharper in presence of a reflex than without, in accordance with experimental findings (Marsden 1984).


In general a non-reflex and a reflex component might show up in the EMG. For this case, the models (1,2.1) and (3,3.1) have to be combined to:
A representative example for this model without any reflex loop , i.e. model (1,2.1), is given in Fig. 6a-c. The non-reflex EMG peak at 10 Hz () causes an ACC peak at the same frequency.
The ACC peak located at 5 Hz refers to the resonant behavior of the hand (). As mentioned in Section 3.3 of the companion paper (Timmer et al. 1998) the phase spectrum is determined by the resonance properties of the hand/muscle system. Fig. 6d-f displays the results for a delay of the reflex loop of 35 ms corresponding to a possible segmental stretch reflex (Noth et al. 1985). was chosen equal to minus one.


The ACC peak caused by the resonant behavior of the hand is shifted to a higher frequency of 6.3 Hz. But the phase spectrum is invariant and still represents the characteristic features of the mechanic properties of the hand/muscle system that have shown up in the ACC power spectrum of Fig. 6a. Therefore, a significant difference in the peak frequency estimated from the phase spectrum and the power spectrum indicates a contribution of the reflex to the oscillation. There might be parameter constellations as shown in Fig. 5 where a reflex does not lead to any shift of the resonance frequency. Thus, we modify in the empirical study the mechanical properties of the system by loading the hand with different weights to increase the probability of detecting a possible contribution of a reflex loop.
The peak frequency is estimated from the phase spectrum by fitting the expected theoretical phase spectrum to the empirical one as described in Section 3.3 of the companion paper. The model contains a possible time delay , the parameters and of the AR[2] process describing the properties of the hand/muscle system. Furthermore, the twofold differentiation to obtain the ACC from the movement of the hand is considered. Therefore, the theoretical phase spectrum consists of the sum of (20,22) of the companion paper and an offset corresponding to (21). The peak frequency is determined by (2,3,14) of the companion paper from the estimated parameters and .
Note that the coherency at the frequency of the reflex induced EMG peak increases due to the larger signal to noise ratio in accordance with (27) of the companion paper.
3.2 Application to measured data
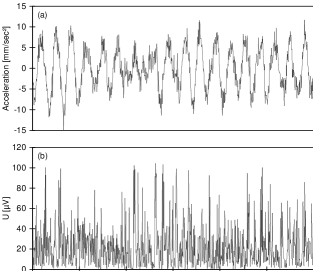
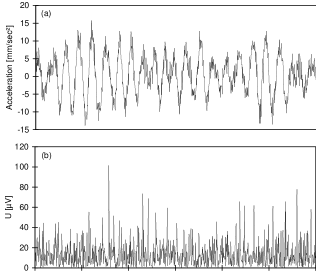
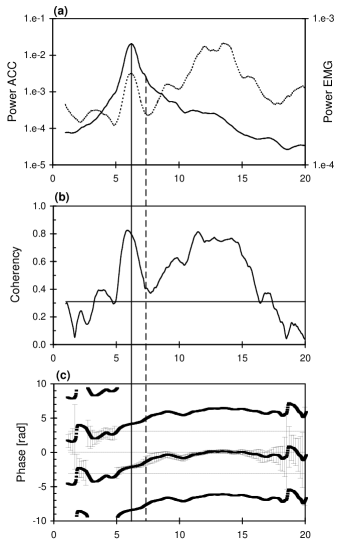
Fig. 7 and Fig. 8 display 3 s segments of data recorded from two subjects with ETP. Fig. 9 and 10 show the results for these two examples. In Fig. 9a the mechanical peak of the ACC at Hz is accompanied by a peak in the EMG, located at the same frequency. The neurogenic EMG peak around Hz causes a shoulder in the ACC power spectrum according to (15) of the companion paper. Because of the increased signal to noise ratio at the peaks, the coherency in Fig. 9b shows significant values there. The phase spectrum in Fig. 9c exhibits the expected shape in dependence on the resonance properties of the hand/muscle system. The frequency of the mechanical system estimated by fitting the analytical phase spectrum (20,21,22) of the companion paper to the estimated phase spectrum is Hz. The peak in the ACC power spectrum, representing the mechanical resonance frequency, is located at Hz (the calculation of the confidence regions is explained in Section 3.3 of the companion paper). Therefore, as the probability that the two frequencies are the same is less than , we conclude that the reflexes contribute significantly to this tremor.
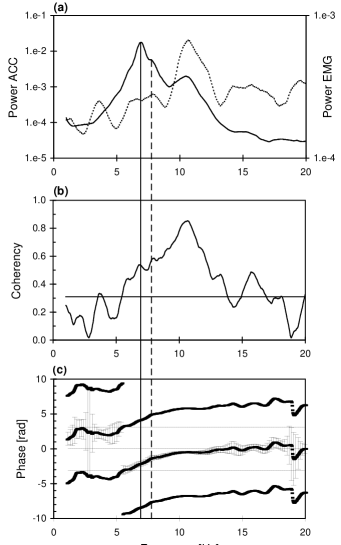
In Fig. 10a the mechanical peak at Hz is not accompanied by a significant peak in the EMG. The neurogenic peak at Hz causes a further peak in the ACC power spectrum. The frequency of the mechanical system estimated from the phase spectrum is Hz. An estimation in the ACC spectrum yields to Hz. Thus, again, a reflex mechanism is involved (p 0.01). Due to the reflex contribution one would expect a peak in the EMG spectrum located at the mechanical ACC peak. It might be not observable since the induced EMG activity does not exceed the observational noise significantly.
4 Results
In this section we report the results obtained by applying methods introduced to 57 recordings of physiological tremor and EMG measured from 19 subjects. For each subject the data were recorded without loading the hand, with a load of 500 gr and 1000 gr in order to modify the resonance frequency of the hand.
As described in Section 3.1 above and Section 3.3 of the companion paper, we fitted theoretical phase spectra to the empirical phase spectra to estimate the frequency of the mechanical system. If no reflex mechanism was involved this frequency would be located at the peak frequency in the ACC power spectrum.
To obtain a good fit of the phase spectra it was always necessary to correct for the spurious time delay which is present because we modeled a continuous time processes by a discrete time model due to (23) of the companion paper. No further time delay was found in the data. In 24 of the 57 recordings the errors in the phase spectrum were too large to obtain reliable results. This is caused by a poor coherency due to a small signal-to-noise ratio. Thus, only 35 data sets were included in the analysis.
The differences between the frequencies estimated from the phase and the ACC power spectrum for different loadings of the hand are given in Fig. 11. The error-bars represent the confidence interval. Under the hypothesis that the reflex does not contribute to the process only two of the data points should not be consistent with a zero difference at a significance level of 5 %. 19 data points are significantly different from zero. On the one hand this result show that reflexes play a role in ETP. On the other hand it shows that a simple segmental stretch reflex is not sufficient to explain this finding. This is indicated by the behavior of the peak frequency differences in dependence of the loading. Simulation studies like those presented in Fig. 5 show that the difference should become more positive under loading. The results allow no clear cut decision on this but the different trend suggests the involvement of more complex reflex structures in the process, maybe a combination of different reflex loops.

5 Summary
We investigated the relation between synchronized EMG and ACC of physiological tremor by cross-spectral analysis. The phase spectrum between EMG and ACC depends only on the mechanical properties of the hand/muscle system, i.e. the driven part of the system, but not on the characteristics of the driving force. The behavior of the coherency with respect to the peaks of EMG and ACC power spectra can be explained by its dependence on the observational noise. Usually the maximum coherency is located at the frequency of the EMG peak. Therefore, the value of the phase spectrum at the frequency of the EMG peak may not be interpreted as a delay. It only provides information about the relative location of the mechanical resonance frequency and the synchronization frequency in the EMG. The time delay of reflex loops can shift the resonance peak frequency, but do not affect the phase spectrum. Thus, in both cases with and without a contribution of reflexes, the phase spectrum provides the information about the frequency of the mechanical peak that would show up in the absence of any reflex. Therefore, a significant difference in the peak frequency of the ACC power spectrum and that calculated from the phase spectrum gives evidence for a contribution of reflexes to the tremor. In 35 time series recorded from 19 subjects with ETP, we found clearly that reflexes contribute to this tremor. The sign of the difference was found to be opposite to that expected for segmental reflexes from simulation studies suggesting that more complex structures are involved.
There is no evidence in the data that reflex loops primarily cause the tremor. They alter the frequency, relaxation time and amplitude of existing oscillations to some degree. This holds for the mechanical peak as well as for the so called neurogenic, i.e. centrally evoked, peak. Therefore, the primary cause of ETP is the resonant behavior of the hand and a synchronized EMG activity that is either generated centrally or due to the recruitment strategy of motoneurons.
References
-
Allum JHJ, Dietz V, Freund HJ (1978) Neuronal mechanisms underlying physiological tremor. J Neurophys 41:557-571
-
Allum JHJ (1984) Segmental reflex, muscle mechanical and central mechanisms underlying human physiological tremor. In: Findley LJ Capildeo R (Eds.) Movement disorders: Tremor. London. Macmillan, pp. 135-155
-
Bawa P, Mannard A, Stein RB (1976a) Effects of elastic loads on the contraction of cat muscles. Biol Cybern 22:129-137
-
Bawa P, Mannard A, Stein RB (1976b) Predictions and experimental tests of a visco-elastic muslce model using elastic and inertal loads. Biol Cybern 22:139-145
-
Christakos CN (1982) A study of the electromyogram using a population stochastic model of skeletal muscle. Biol Cybern 45:5-12
-
Elble RJ, Koller WC (1990) Tremor. The Johns Hopkins University Press, Baltimore
-
Elble RJ, Randall JE (1976) Motor-unit activity responsible for 8- to 12-Hz component of human physiological finger tremor. J Neurophys 39:370-383
-
Fox JR, Randall JE (1970) Relationship between forearm tremor and the biceps electromyogram. J Appl Neurophys 29:103-108
-
Gantert C, Honerkamp J, Timmer J (1992) Analyzing the dynamics of hand tremor time series. Biol Cybern 66:479-484
-
Hagbarth KE, Young RR (1979) Participation of the stretch reflex in human physiological tremor. Brain 102:509-526
-
Hömberg V, Hefter H, Reiners K, Freund HJ (1987) Differential effects of changes in mechanical limb properties on physiological and pathological tremor. J Neuro Neurosurg Psychiatry 50:568-579
-
Iaizzo PA, Pozos RS (1992) Analysis of multiple EMG and acceleration signals of various record length as a means to study pathological and physiological oscillations. Electromyogr clin Neurophysiol 32:359-367
-
Lippold OCJ (1957) The rhythmical activity of groups of motor units in the voluntary contraction of muscle. J Physiol 137:473-487
-
Lippold OCJ (1970) Oscillation in the stretch reflex arc and the origin of the rhythmical 8-12 c/s component of physiological tremor. J Physiol 206:359-382
-
Lippold OCJ (1971) Physiological tremor. Scientific American. 65-73
-
Marmarelis VZ (1989) Volterra–Wiener Analysis of a class of nonlinear feedback systems and application to sensory biosystems . In: Physiological System Modeling, Ed.: VZ Marmarelis. New York, Plenum Press. pp. 1-52
-
Marsden CD (1984) Origins of normal and pathological tremor. In: Findley LJ Capildeo R (Eds.) Movement disorders: Tremor. London. Macmillan, pp. 37-84
-
Matthew PBC (1994) The simple frequency response of human stretch reflexes in which either short- or long-latency components predominate. J Physiol 481:777-789
-
Noth J, Podoll K, Friedemann H (1985) Long-loop reflexes in small hand muscles studied in normal subjects and in patients with Huntington’s disease. Brain 108:65-80
-
Oguztöreli MN, Stein RB (1975) An analysis of oscillations in neuro-muscular systems. J Math Biol 2:87-105
-
Oguztöreli MN, Stein RB (1976) The effects of multiple reflex pathways on the oscillations in neuro-muscular systems. J Math Biol 3:87-101
-
Oguztöreli MN, Stein RB (1979) Interactions between centrally and peripherally generated neuromuscular oscillations. J Math Biol 7:1-30
-
Pashda SM, Stein RB (1973) The bases of tremor during a maintained posture. In: Control of Posture and Locomotion, Ed.: RB Stein, KG Pearson, RS Smith, JB Redford. New York. Plenum. Press pp 415-419
-
Randall JE (1973) A Stochastic Time Series Model for Hand Tremor. J Appl Physiol 34:390-395
-
Rack PMH, Ross HF, Brown TIH (1978) Reflex response during sinusoidal movement of human limbs. In: Cerebral motor control in man: Long loop mechanisms. Prog. clin. Neurophys. Vol 4, Ed.: JE Desmedt. Karger, Basel. pp. 216-228
-
Rietz RR, Stiles RN (1974) A viscoelastic mass mechanism as a basis for normal postural tremor. J Appl Physiol 37:852-860
-
Stein RB, Oguztöreli MN (1975) Tremor and other oscillations in neuromuscular systems. Biol Cybern 22:147-157
-
Stein RB, Oguztöreli MN (1978) Reflex involvement in the generation and control of tremor and clonus. In: Physiological tremor, pathological tremor and clonus. Prog. clin. Neurophys. Vol 5, Ed.: JE Desmedt. Karger, Basel. pp. 28-50
-
Stiles NS, Randall JE (1967) Mechanical factors in human tremor frequency. J Appl Physiol 23:324-330
-
Stiles NS (1980) Mechanical and Neural feedback factors in postural hand tremor of normal subjects. J Neurophys 44:40-59
-
Timmer J, Lauk M, Pfleger W, Deuschl G (1998) Cross-spectral analysis of physiological tremor and muscle activity. I. Theory and application to unsychronized EMG. submitted to Biol Cybern.
-
Young RR, Hagbarth KE (1980) Physiological tremor enhanced by manoeuvres affecting the segmental stretch reflex. J Phys 43:248-256