Star formation in the nuclei of spiral galaxies
Abstract
Recent observations with the Hubble Space Telescope (HST) have revealed that a large fraction of late-type (Sc and later) spiral galaxies harbor a bright, compact stellar cluster in their dynamical centers. Statistics of the mass, age, and star formation history of these clusters as a function of their host galaxy’s Hubble type can be used to constrain models of secular galaxy evolution. Since late-type spirals by definition do not possess a prominent bulge, their nuclear clusters are more easily separated from the underlying disk population. Their spectroscopic properties can thus be studied from ground-based observations. Here, I will discuss plans for, and first results of, a program to study a sample of known nuclear clusters in late-type spirals. For one galaxy (IC 342), we have used high-resolution near infrared spectroscopy to determine the cluster mass directly via its stellar velocity dispersion. The analysis conclusively shows a very low mass-to-light ratio for the nuclear cluster in \objectIC 342, indicative of a young cluster age ( 50 Myrs). From probability arguments, this result favors the scenario that such bursts are a recurrent phenomenon in late-type spiral nuclei.
keywords:
Galaxies: Nuclei – Galaxies: Evolution1 Introduction
Galactic nuclei are a unique physical environment as evidenced by massive black holes, active galactic nuclei of various flavors, and a star formation history that is very different from their host disks. While it is plausible that the nucleus might have unusual properties in galaxies with steep, cuspy light profiles, the gravitational potential vanishes in diffuse, non-singular galaxies without a central black hole. In these cases it not at all intuitive why the nucleus should be the site of vigourous star formation. It therefore came as a surprise when recent HST data revealed the presence of prominent compact nuclear sources in many spiral galaxies of all Hubble types ([\astroncitePhillips et al. 1996, \astronciteMatthews et al. 1999, \astronciteBöker et al. 1999a, \astronciteCarollo1999]). More specifically, this is true for virtually all galaxies with exponential bulges - mostly galaxies of type Sc or later. Because the nuclear sources in most cases are resolved with HST, they are interpreted as stellar clusters.
The processes that lead to the formation of stellar clusters in the very center of galaxies are not well understood, and many questions remain to be answered: Is the cluster formation process self-regulating in the sense all clusters form over similar timescales? How stable are nuclear clusters? Is a stellar bar required to funnel gas into the central regions?
The presence of such clusters is also interesting in the context of the ongoing debate on galaxy bulge formation. It is known from numerical simulations (e.g. [\astronciteNorman, Sellwood & Hasan1996]) that the growth of a central mass concentration can destroy stellar bars on short timescales. The bar undergoes a vertical ”buckling” instability, during which stars are heated into orbits above the galaxy plane. The result is a triaxial system that much resembles a galaxy bulge.
While this process is both plausible and appealing, there are also problems related to it. First, the observed high fraction of barred galaxies seems to contradict the notion that stellar bars are easily destroyed by central mass concentrations. Second, if the above scenario was true, then destruction of the bar would disable an effective funneling mechanism for the gas to reach the galactic center. As a consequence, repeated nuclear cluster formation is prevented.
Both these arguments can in principle be overcome if more and more massive bars form in a recurrent way. Building a galaxy bulge via repeated cycles of the bar formation - gas inflow - cluster formation - bar destruction cycle therefore seems like a possible alternative to theories in which the bulge properties are largely determined during the collapse of the primordial gas cloud.

Understanding the formation history of nuclear star clusters provides a new and important diagnostic to test the above scenario. Reliable statistics of nuclear cluster ages will directly test whether or not they form in a repetitive cycle. For this reason, we have initiated a program to obtain high-quality spectra of the nuclear clusters of a sample of late-type, face-on spirals for which the cluster can be separated from the galaxy disk in ground-based observations.
In this paper, I will describe our methods to derive the cluster ages from the observations and give an example for the successful application in Sec. 2. Sec. 3 discusses the preliminary evidence for repetitive cluster formation, and Sec. 4 describes plans for an observational program which will put the analysis on much firmer statistical footing.
2 Age-dating nuclar clusters
It is well known from a number of population synthesis codes (e.g. [\astronciteBruzual & Charlot1993, \astronciteLeitherer et al. 1999]) that the mass-to-light ratio of a stellar cluster is a sensitive age indicator. We have chosen the K-band for our analysis for the following reasons. Firstly, galactic nuclei are often affected by high and non-uniform dust obscuration. The near-infrared is much less sensitive to extinction than the optical: . Secondly, the near-infrared emission is dominated by the evolved stellar population, and therefore gives a better representation of the stellar mass distribution than optical bands in which gaseous emission lines often contribute significantly. For both reasons, it is often easier to identify the true nucleus of a galaxy at near-infrared wavelengths. The third reason for choosing K-band is that it contains the bandhead at 2.2936, a prominent absorption feature which arises in the atmospheres of cool giants and supergiants. This feature is located in a spectral region with favorable observing conditions and has been shown to be a powerful diagnostic for stellar kinematics in external galaxies, as discussed in detail by [*]gaf95.

Our methodology for deriving the ratio is based on the “Gauss-Hermite Pixel Fitting Software” developed by [*]mar94. In brief, the observed surface brightness profile is deprojected under the assumption of spherical symmetry, and the three-dimensional velocity dispersion profile is calculated by solving the Jeans equation for a spherical isotropic system. The results are then projected along the line of sight and convolved with the instrumental profile to yield a prediction for the observed velocity dispersion. This dispersion scales as , and we determine the that produces the observed .
Two observational ingredients are needed for the above recipe to yield a reliable value. In addition to a high-quality, high-resolution spectrum - yielding the cluster’s velocity dispersion - it is essential to also obtain an accurate surface brightness profile. Typical diameters of nuclear clusters are 0.2\arcsec ([\astronciteCarollo1999]), therefore imaging with HST-like resolution is required.
2.1 The showcase: IC 342
We recently were able to successfully apply the above method to the nuclear cluster of IC 342 ([\astronciteBöker et al. 1999b]). For these observations, we used the near-infrared spectrograph CSHELL ([\astronciteTokunaga et al. 1990, \astronciteGreen et al. 1993]) at the NASA InfraRed Telescope Facility (IRTF) to determine the from the shape of the CO (0-2) bandhead. Figure 1 shows the spectrum in comparison to a number of stellar templates that were used to derive a value of . Together with an archival HST V-band image, we used the observed velocity dispersion to derive the cluster mass-to-light ratio according to the method outlined in 2. Our data imply = 0.05 / and a total cluster mass of .
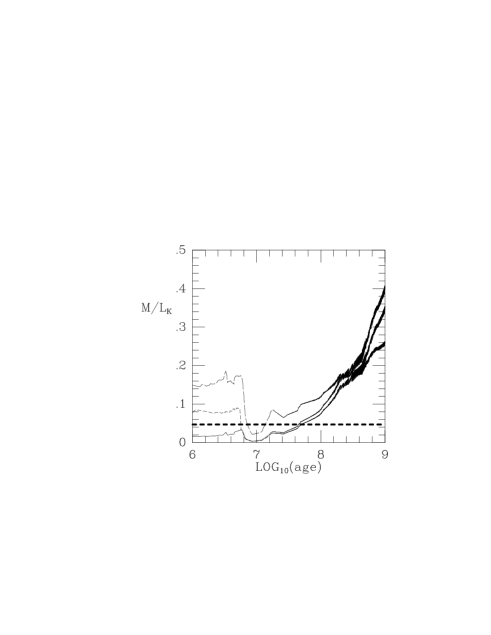
In order to derive the cluster age, we compared these results to predictions from population synthesis models such as the “Starburst99” package of [*]lei99. We used an instantaneous burst model for our comparison which is justified by the high equivalent width (EW) of the CO absorption as demonstrated in an earlier paper ([\astronciteBöker, Förster-Schreiber & Genzel1997], hereafter BFG97). Fig. 2 shows that - quite independent of the assumed Initial Mass Function (IMF) - the nuclear cluster in IC 342 is rather young, namely less than 50 Myrs.
2.2 Dealing with extinction
In galactic nuclei, dust extinction can significantly affect the observations, even at nearinfrared wavelengths. However, if values for both color and mass-to-light ratio are available from the observations, it is possible to perform a consistency check on the assumed extinction. This is demonstrated in Fig. 3 which for three different IMF’s shows possible combinations of age and extinction which explain the observed color and ratio, respectively. Locations where the two lines intersect indicate age/extinction combination which are consistent with both observables. The allowed combinations have ages in the range years, and between and . This range includes the value (i.e., ) that was adopted for our analysis based on the results of BFG97, and the age that we derived for the nuclear cluster.
3 Repetitive cluster formation?
Given the young age and low mass-to-light ratio of the IC 342 nuclear cluster, one is led to ask whether its formation was the first of this kind. The presence of an underlying older population is not ruled out by our observations, but there are constraints on the amount of light and mass that such a population could contribute. These constraints are based on the observed EW of the CO bandhead at 2.29 which is given by . Here, is the fraction of the total light contributed by an old population. The EW for single-burst population models decreases with age, so the observed EW sets an upper limit on , namely .
Although an old population can only contribute a small fraction of the observed light, its contribution to the total mass of the cluster may be significant. For the same mass, a burst that happened yrs ago would be 3 magnitudes fainter in the K-band than the young population that dominates the light ([\astronciteBruzual & Charlot1993]). An old population that formed yrs ago, roughly the age of the universe, would be 5 magnitudes fainter. In the latter case it could be times as massive as the observed young population and still only have . The total mass of the cluster is fixed, so in this scenario the young population would need to have a mass-to-light ratio that is 15 times smaller than previously inferred, which implies . This is roughly the smallest value that can be plausibly explained with a single-burst population model (cf. Fig. 2), and cannot be ruled out. So while we can conclude that the light of the cluster is dominated by a young population, this is not necessarily true for the mass.

For the Galactic center, spectroscopy of individual stars is possible, and such data provide solid evidence for multiple periods of star formation ([\astronciteKrabbe et al. 1995]). In general, however, it is a difficult task to identify multiple star formation events from the integrated light of stellar populations, and even more so to find a unique solution to their star formation history. The best hope for answering whether or not stellar clusters form repeatedly in the nuclei of spiral galaxies stems from a statistical analysis of their frequency and age.

3.1 Statistics so far
IC 342 is not the only galaxy known to harbor a young population of stars in its nucleus. The Milky Way, for example, underwent a recent starburst some 3 Myrs ago ([\astronciteKrabbe et al. 1995]), and both M31 and M33 have blue nuclei that are quite possibly young star clusters ([\astronciteLauer et al. 1998]). If nuclear cluster formation is a Poissonian process with equal probability per unit time, one would expect to find clusters with ages in the range of , , and years in the ratio .
In order to test this prediction in the absence of reliable age estimates for a large number of clusters, we took the following approach. Under the very simplifying assumption that all nuclear clusters have the same mass as the IC 342 cluster, and formed in an instantaneous burst, one can estimate their ages directly from luminosities. This is shown in Fig. 4 for all clusters found in the [*]car99 sample. While the interpretation of the Fig. 4 is certainly hindered by the extremely simplifying assumption of equal mass and formation history for all clusters, it nevertheless seems that there is an overabundance of relatively young clusters which can be interpreted as preliminary evidence for a repetitive process.
4 Observational plans
In order to improve the available dataset on nuclear clusters, we are planning the following observations:
-
•
High-resolution CO bandhead spectroscopy (NIRSPEC @ Keck - approved) of all galaxies found to date with HST to harbor a bright ( 16) nuclear cluster with the goal to derive stellar velocity dispersions.
-
•
Optical Echelle spectroscopy (BC spectrograph @ Steward 90\arcsec - data taken) of the same targets to constrain their stellar populations. Figure 5 shows ”quick-look” results of the data reduction for two of the sample galaxies. In both cases, the (disk-subtracted) cluster spectra show deep Balmer absorption lines indicative of fairly young cluster ages. The detailed analysis of these spectra is ongoing, and will be published separately ([\astronciteMazzuca et al. 2000]).
-
•
NIR imaging of about 100 late-type, face-on spirals (MAGIC @ MPIA 2.2 m - approved) in order to identify a larger sample of prominent nuclear cluster.
-
•
A cycle 9 HST WFPC2 R-band snapshot survey (proposed) to identify a large number of nuclear clusters for follow-up spectroscopy and obtain their surface brightness profiles.
The combination of ground-based spectroscopy and HST imaging will allow us to measure cluster masses and ages in a way similar to that described for IC 342 for a large sample of galaxies. The cluster mass and age distribution as a function of host galaxy Hubble type will answer whether the formation of the nuclear clusters in spiral galaxies is a recurring phenomenon or not, and how - if at all - these clusters are related to the secular evolution of the exponential bulges in which they reside.
Acknowledgements.
It is a pleasure to acknowledge the contributions of my collaborators R.P. van der Marel, W.D. Vacca, H.-W. Rix, L. Ho, and J. Shields. I would also like to thank the LOC for organising a very lively and stimulating meeting.References
- [\astronciteBöker et al. 1999a] Böker, T., Calzetti, D., Sparks, W. et al. 1999a, ApJS, 124, 95
- [\astronciteBöker et al. 1999b] Böker, T., van der Marel, R. P., & Vacca, W. D. 1999b, AJ, 118, 831
- [\astronciteBöker, Förster-Schreiber & Genzel1997] Böker, T., Förster-Schreiber, N. M. & Genzel, R. 1997, AJ, 114, 1883 (BFG97)
- [\astronciteBruzual & Charlot1993] Bruzual, A. G., & Charlot, S. 1993, ApJ, 405, 538
- [\astronciteCarollo1999] Carollo, M. 1997, ApJ, 523, 566
- [\astronciteGaffney, Lester & Doppmann1995] Gaffney, N. I., Lester, D. F. & Doppmann, G. 1995, PASP, 107, 68
- [\astronciteGreen et al. 1993] Green, T. P., Tokunaga, A. T., Toomey, et al. 1993, Proc. SPIE, 1946, 313
- [\astronciteKrabbe et al. 1995] Krabbe, A., Genzel, R., Eckart, A., et al. 1995, ApJ, 447, L95
- [\astronciteLeitherer et al. 1999] Leitherer, C., Schaerer, D., Goldader, J. D., et al. 1999 ApJS, 123, 3
- [\astronciteLauer et al. 1998] Lauer, T. R., Faber, S. M., Ajhar, et al. 1998, AJ, 116, 2263
- [\astronciteMatthews et al. 1999] Matthews, L. D. et al. 1999, AJ, 118, 208
- [\astronciteMazzuca et al. 2000] Mazzuca, L., Böker, T., van der Marel, R. P., et al. 2000, in prep.
- [\astronciteNorman, Sellwood & Hasan1996] Norman, C. A., Sellwood, J. A. & Hasan, H. 1996, ApJ, 462, 114
- [\astroncitePhillips et al. 1996] Phillips, A. C., Illingworth, G. D., MacKenty, J. W., & Franx, M. 1996, AJ, 111, 1566
- [\astronciteTokunaga et al. 1990] Tokunaga, A. T., Toomey, D. W., Carr, J., et al. 1990, Proc. SPIE, 1235, 131
- [\astroncitevan der Marel1994] van der Marel, R. P. 1994, MNRAS, 270, 271