The Reappearance of the Transient Low Mass X-ray Binary X1658298
Abstract
In April 1999 the transient low mass X-ray binary X1658298 resumed its strong and persistent X-ray emission after a 21-year interval of quiescence. We present RXTE data obtained soon after the reappearance, including four eclipses with a mean duration of 901.90.8 sec and ingress/egress times of 6–13 sec. Our updated ephemeris for the source indicates that the 7.1-hr orbital period of the system is decreasing with a timescale of 107 yr. Contemporaneous optical observations provide the first-ever lightcurve of V2134 Oph, the optical counterpart of X1658298. The optical modulation is highly variable from night to night and exhibits a distinct, narrow eclipse feature of about 0.2 mag superposed on a gradual brightness variation with mag amplitude. Our data indicate that there is no significant offset between the time of mid-eclipse in the X-ray and optical and that the narrow optical eclipse feature is of the same duration as the X-ray eclipse. This implies an accretion disk structure characterized by enhanced optical emission coincident with the central X-ray emitting area.
1 Introduction
X1658298 is a soft X-ray transient discovered in 1976 by Lewin, Hoffmann, & Doty (1976). The detection of type I bursts indicates that the compact object in the system is a neutron star. Observations during a temporary brightening of the source in 1978 showed dips in the X-ray lightcurve. Detailed analysis of the combined 1976–1978 data set by Cominsky & Wood (1984, 1989) revealed that X1658298 is one of the rare low mass X-ray binary systems (LMXBs) that exhibits eclipses of the central X-ray source by the mass donating star. The dipping activity lasts for about 25% of the 7.1 hour orbital cycle followed by an eclipse of min duration.
The optical counterpart of X1658298 was identified during the 1978 X-ray outburst with a faint (), blue star (V2134 Oph) by Doxsey et al. (1979). Spectroscopic observations show a typical LMXB spectrum, a blue continuum with emission lines of He II 4686 and the C III/N III 4640/4650 blend (Canizares, McClintock, & Grindlay 1979). X1658298 entered an X-ray off–state in 1979 and the counterpart became undetectable with a magnitude limit of (Cominsky, Ossmann, & Lewin 1983).
Renewed X-ray activity from X1658298 was detected by BeppoSAX on April 2–3 1999 (In’t Zand et al. 1999), marking the first X-ray detection of the source since 1978. Follow-up observations were quickly scheduled with RXTE under a public Target of Opportunity program, and with optical telescopes at CTIO. In this paper we present the first optical light curve of X1658298, and the results of our RXTE eclipse timing and spectral fitting analysis.
2 Observations
2.1 X–ray
X1658298 was observed with the RXTE satellite for a series of four public observations between 1999 April 5–15, soon after the recommencement of X-ray activity. The X-ray data we present here were obtained using the RXTE Proportional Counter Array (PCA) instrument with the Standard 2 and E_125us_64M_0_1s configurations, with time resolutions of 16 sec and 125 sec, respectively. The PCA consists of five Xe proportional counter units (PCUs), with a combined effective area of about 6500 cm2 (Jahoda et al. 1996). For operational reasons, differing numbers of PCUs were utilized in each observation. In Table 1 we list the observation times and the PCUs on during each observation. Data extraction was performed using the RXTE standard analysis software, FTOOLS v4.2. The "skyvle/skyactiv" models generated by the RXTE PCA team were used for background subtraction, and found to be accurate to better than 1 cs-1. Light curves and spectra were analyzed in the 2–20 keV band. Barycentric corrections have been applied to all X-ray timings. 2% systematic errors were added to the spectral data before fitting, to represent the current uncertainties in response matrix generation.
| Obs | Start/Stop Time (UT) | PCUs on |
|---|---|---|
| 1 | 1999 Apr 5 20:12 – Apr 6 01:18 | 0124 |
| 2 | 1999 Apr 9 19:34 – Apr 9 20:13 | 023 |
| 3 | 1999 Apr 13 16:07 – Apr 13 16:46 | 134 |
| 4 | 1999 Apr 15 17:58 – Apr 15 18:26 | 13 |
2.2 Optical
CCD and band photometry of V2134 Oph was performed with the CTIO 1.5m and YALO telescope from UT 1999 April 29 to May 3. The image scale at the telescopes was 0.24″ pix-1 and 0.30″ pix-1, respectively. The data were overscan corrected, bias corrected and flat-fielded in the standard manner using IRAF. Photometry was performed by point spread function fitting with DAOPHOT II (Stetson 1993). The instrumental magnitudes were transformed to the standard system through comparison with previously calibrated local standards (Wachter & Smale 1998). The intrinsic 1 error of the relative photometry is about mag as derived from the rms scatter in the lightcurve of comparison stars of similar brightness. The standardized magnitudes are accurate to about mag. Exposure times were 300 sec for the YALO data and 200 to 240 sec (around the times of eclipse) for the 1.5m data, depending on the observing conditions.
3 Results
3.1 X-ray
The X-ray observations were scheduled to occur centered on the expected times of eclipse, as extrapolated from the ephemeris of Cominsky & Wood (1989). As intended, one complete eclipse was observed per observation. We have determined the duration, mid-point and transition times for each eclipse by modeling each ingress and egress transition with a “step and ramp” model, consistent with the methodology adopted in studies of eclipses from the similar transient LMXB X0748676 (e.g. Parmar et al. 1986, Corbet et al. 1994). The model assumes a linear transition into and out of eclipse, and has four free parameters per transition: the start and end time, and the count rates before and after the transition. From these we derive the ingress and egress durations, and , the eclipse duration (measured from the end of ingress to the beginning of egress), and the eclipse mid-points (midway between the end of ingress and the start of egress). Table 2 contains the measured values of these quantities for each eclipse. We find a spread of ingress/egress times of 6–13 sec, with mean values for and of 9.13.0 sec and 9.53.3 sec respectively, and a mean eclipse duration of 901.90.8 sec. The X-ray eclipse transitions of X1658298 together with the model fits are shown in Figure 1.
![[Uncaptioned image]](/html/astro-ph/9912480/assets/x1.png)

These four eclipse centers occur an average of 407.4 sec earlier than predicted by the ephemeris of Cominsky & Wood (1989). We have combined our eclipse timings with the eclipse centers (corrected to TDB) from the HEAO A-1 and SAS 3 observations of Cominsky & Wood (1984, 1989), to produce the updated ephemeris presented in Table 3. A parabolic ephemeris is required to obtain a good fit to the eclipse timings; the / term implies that the orbital period of the system is decreasing on a timescale of 107 yr. This ephemeris was then used to phase our optical data, in the following sections.
![[Uncaptioned image]](/html/astro-ph/9912480/assets/x3.png)
We have also performed a spectral analysis of the RXTE PCA data. From each dataset, we extracted a spectrum of the persistent (non-eclipse, non-dip) emission, and an in-eclipse spectrum. The spectra of the persistent emission each contain 1300 sec of data, and the eclipse spectra 880–896 sec. In each case the persistent spectrum can be well fit using a power law plus high energy cutoff model, with power law index =2.10.1, cutoff 8.60.6 keV, and a hydrogen column density of (5.00.6)1022 cm-2. A Comptonized Sunyaev and Titarchuk model also provides reasonable fits to the data, with =3.90.2 keV, =7.10.3, =(6.10.5)1022 cm-2. The reduced values for both models are acceptable, in the range 1.0–1.2. Two component models (such as a powerlaw plus blackbody) will also fit the data, although an F-test does not justify the inclusion of the second component. The mean persistent 2–20 keV flux of the source throughout the observations is 1.0510-9 erg cm-2 s-1. The eclipse spectra can be consistently fit with a simple, steeper power law with =3.50.4 and =(155)1022 cm-2. Over the 2–20 keV range, the eclipse flux level is measured to be 1.90.7% of the persistent emission.
The durations we measure for the X-ray eclipse transitions are shorter than those determined from the previous activity cycle (mean =4113 sec, mean =1913 sec; Cominsky & Wood 1989). However, a broad spread of values for the eclipse transitions from a given source may be common; the similar source X0748676 shows transition times from 1.5–40 sec (Parmar et al. 1991). Transition times are defined by the atmospheric scale height of the companion, which can be affected by flaring activity or the presence of an X-ray-induced evaporative wind or corona; a more detailed discussion of of such effects in X1658298 will be worthwhile once a larger sample of eclipses is obtained.
Period changes have been previously detected in six other LMXBs, and may provide valuable clues about the progression of binary evolution. For conservative mass transfer, the loss of angular momentum leads to an expected timescale for evolution of the orbital period (=) of 108-10 yr. However, the timescales measured to date have been considerably shorter than this. The period of X1822371 and X2127119 are increasing on timescales of =2.9106 yr and =1.1106 yr, respectively (Hellier et al. 1990; Homer & Charles 1998), while X1820303 and Her X–1 show decreasing orbital periodicities with =1.9107 yr (van der Klis et al. 1993 and references within) and =7.6107 yr (Deeter et al. 1991). Cyg X–3 (possibly not an LMXB) shows an increasing orbital period, with =7.3106 yr, with a possible second period derivative (van der Klis & Bonnet-Bidaud 1989; Kitamoto et al. 1992). Most complex of all, X0748676 shows a period change behavior initially seen to decrease (Parmar et al. 1991) but later impossible to reconcile with a simple constant period derivative. A sinusoidally-varying orbital period (Asai et al. 1992) provided an acceptable fit until the RXTE era, when an unusually large excursion from this pattern was detected that defies straightforward parameterization (Hertz, Wood, & Cominsky 1997). The variation observed in X1658298 is of a similar magnitude to these cases, despite the fact that (presumably) mass transfer was not occurring during the interval 1978–1999. This may pose a difficulty in explaining the change using models based on angular momentum coupling, irradiation of the secondary, or magnetic cycling (e.g. Parmar et al. 1991; Richman, Applegate, & Patterson 1994; Hertz et al. 1997).
3.2 Optical
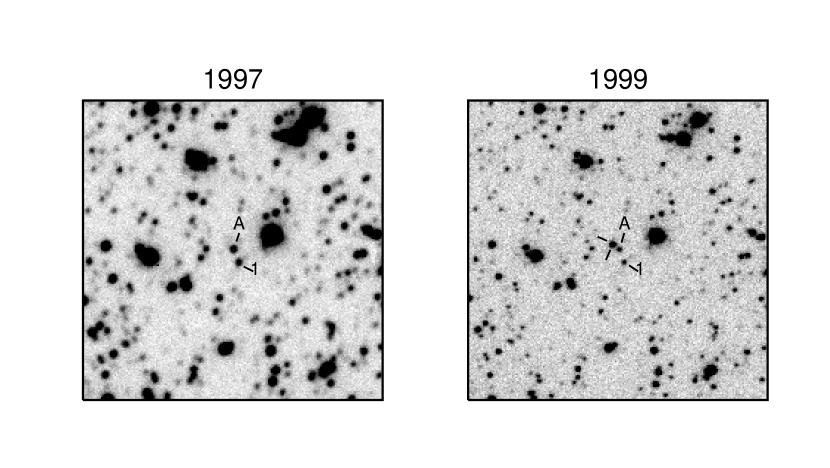
Apart from the discovery observations during the 1978 outburst and limited follow-up during the subsequent decay, optical data of V2134 Oph are sparse. The few more recent spectroscopic observations of V2134 Oph during the extended X-ray off–state (Cowley, Hutchings & Crampton 1988; Shahbaz et al. 1996; Navarro 1996) all imply a substantially brighter counterpart than the limit discussed in Cominsky et al. (1983). We conducted the first photometric study of V2134 Oph in 1997 April/May and found the source only 1 mag fainter than the brightness reported when the system is X-ray active (Wachter & Smale 1998). Our lightcurve surprisingly also did not show any modulation across the binary cycle. X-ray transients in quiescence generally display photometric variability due to ellipsoidal variations (see van Paradijs & McClintock 1995 for extensive references). A comparison between our quiescent and outburst frames from 1997 and 1999 (Figure 2) resolves this puzzling behavior: the star we observed (“A”) is in fact an unrelated close companion to the actual optical counterpart. The true position of V2134 Oph was measured from a large number of frames with excellent seeing conditions (0.7-0.8″) to be 0.8″ east and 1.0″ north of the star marked “A”. The presence of this unrelated companion cannot be discerned from the original finding chart of Doxsey et al. (1979). There is no evidence for intermittent brightening of the source in X-rays during the quiescent years, and consequently it is probable that the counterpart remained at the faint magnitudes reported by Cominsky et al. (1983). This magnitude is inaccessible for spectroscopic studies with the telescopes used in the observations referenced above and it is likely that none of these observations were of the true quiescent counterpart.
We subsequently reanalyzed our 1997 data in order to determine quiescent magnitudes of the true counterpart which is only very faintly visible in our pre-outburst data. After coadding the six frames (600 sec each) with the best seeing conditions, we obtain for V2134 Oph in quiescence. Unfortunately, the quiescent counterpart is too faint for accurate photometry in our 1997 and band data. Filippenko et al. (1999) measured for V2134 Oph in quiescence. Combining these two measurements and assuming a reddening of =0.3 (van Paradijs 1995) results in which corresponds to a spectral type of M2. A star of this spectral type would not fill its Roche lobe in a 7.1 hour LMXB. As discussed in Wachter & Smale (1998), empirical period–mass relations for mass transfer systems imply a K0 star instead. Note, however, that the magnitudes of the comparison stars A and E (A and 1 in our nomenclature) in Filippenko et al. (1999) are systematically 0.6-0.7 mag fainter than those given in Wachter & Smale (1998). If the magnitude of V2134 Oph is similarly too faint, the resulting is consistent with the required early K spectral type within the errors. A K0 companion would have , in accordance with the observed limit.

Our 1999 and band lightcurves of V2134 Oph during outburst are shown in Figure 3. Data obtained with the CTIO 1.5m telescope are indicated with filled circles for and triangles for , YALO data with stars. The observations span almost a full orbital cycle on each night. Superposed on a gradual brightness variation with mag amplitude, a distinct, narrow eclipse feature of about 0.2 mag is visible on each night. Strong nightly variations in the shape of the lightcurve are also evident. For the nights with simultaneous and band coverage we rebinned the data to the average time sampling interval using linear interpolation and calculated the color index. There is no evidence for any color variation across the orbit or for a change in color from night to night. We obtain an average of from the combined color data of the three nights.
4 Discussion
Figure 4 shows the outburst data folded according to our updated X-ray ephemeris (Table 3). Following the usual convention, the time of the X-ray mid-eclipse is defined as phase 0. The deepest point of the optical lightcurves on each night was chosen as a reference point for the brightness of the system and the data (vertically) shifted accordingly. X-ray dips are observed for X1658298 between the phases of 0.6–0.8. No analogous stable optical feature is evident in the folded lightcurves, however, our data sampling in that phase interval is fairly sparse. The folded band lightcurve clearly shows a distinct central drop in brightness within mag of the faintest observed magnitude which is also characterized by reduced scatter compared to other phases of the lightcurve. The presence of such a narrow central component is evident in the individual lightcurves of each separate night as well. We determined the optical eclipse center to occur at phase by selecting the folded band data within 0.2 mag of the faintest magnitude and calculating the time on either side of which the area within the eclipse profile was equal. The average data sampling interval in this part of the folded band lightcurve is about 1 minute. A close-up of the central region is shown on the bottom left hand side of Figure 4 together with the fit to the 1999 Apr 5 X-ray eclipse (dotted line). Our data indicate that there is no significant offset between the time of mid-eclipse in the X-ray and optical and that the narrow component of the optical eclipse is of the same duration as the X-ray eclipse (we measure a FWHM of minutes for this optical feature). This implies a distinct optical emission region associated with the X-ray emitting area.

The only other LMXBs known to exhibit X-ray eclipses are X0748676, X2129+470, X1822, Her X1 and X0921630. For systems with inclinations (X1658298, X0748676, Her X1), both dips and total eclipses are observed in X-rays. In higher inclination systems (; X1822, X2129+470), only partial X-ray eclipses are seen; the accretion disk is thought to block the direct line-of-sight to the central X-ray source and the observed X-ray flux is due to scattering in an extended accretion disk corona (ADC). The optical/UV eclipse in the ADC source X1822371, one of the most extensively studied systems, is found to be much broader than the X-ray eclipse (Hellier & Mason, 1989; Puchnarewicz, Mason, & Cordova 1995) indicating an accretion disk radius of about twice the ADC radius. The optical lightcurve of X1822371 varies very little from night to night and even over a timespan of years. Modeling shows that several emission components such as the X-ray heated face of the mass donor and the accretion disk rim contribute to produce the overall morphology of the optical lightcurve (Mason & Cordova 1982). It is therefore difficult to determine the time of ingress and egress of the optical eclipse for a given system solely from the shape of the lightcurve.
In contrast to X1822371, our X1658298 data clearly display a narrow optical feature of the same duration as the X-ray eclipse. However, the data do not reveal whether this feature merely represents the central core of a wider optical eclipse. Due to the highly variable shape of the lightcurve outside this narrow component, we cannot ascertain the presence or absence of wider ingress/egress signatures. The standard model calls for successively longer eclipse durations when moving from observations in X-rays to longer wavelengths to account for the eclipse of the cooler outer regions of an extended accretion disk (which would not be visible in X-rays). Our data clearly indicate an accretion disk structure characterized by enhanced optical emission coincident with the central X-ray emitting area. We would consequently predict equivalent optical structures in all systems in which the X-ray source is believed to be viewed directly. An optical feature on the timescale of the X-ray eclipse has been observed in Her X1 (Kippenhahn, Schmidt, & Thomas 1980). For X0748676, an inspection of the individual optical lightcurves displayed in Crampton et al. (1986) and van Paradijs, van der Klis, & Pedersen (1988) also reveals a narrow central eclipse component very similar to that of our X1658298 data. However, in both cases the authors conclude that the optical eclipse is twice as wide as the X-ray eclipse, based on which part of the lightcurve looks like “clearly an eclipse” and/or consideration of an average lightcurve which does not exhibit any central structure. While it is difficult to tell with certainty from the published figures, it appears likely that a reexamination of these X0748676 data would also show this narrow optical component to have the same duration as the X-ray eclipse.
References
- (1)
- (2) Asai. K., Dotani, T., Nagase, F., Corbet, R. H. D., & Shaham, J., 1992, PASJ, 44, 633
- (3)
- (4) Canizares, C. R., McClintock, J. E., & Grindlay, J. E. 1979, ApJ, 234, 556
- (5)
- (6) Cominsky, L., Ossmann, W., & Lewin, W. H. G. 1983, ApJ, 270, 226
- (7)
- (8) Cominsky, L. R., & Wood, K. S. 1984, ApJ, 283, 765
- (9)
- (10) Cominsky, L. R., & Wood, K. S. 1989, ApJ, 337, 485
- (11)
- (12) Corbet, R. H. D., Asai, K., Dotani, T., & Nagase, F. 1994, ApJ, 436, L15
- (13)
- (14) Cowley, A. P., Hutchings, J. B., & Crampton, D. 1988, ApJ, 333, 906
- (15)
- (16) Crampton, D., Cowley, A. P., Stauffer, J., Ianna, P., & Hutchings, J. B. 1986, ApJ, 306, 599
- (17)
- (18) Deeter, J. E., Boynton, P. E., Miyamoto, S., Kitamoto, S., Nagase, F., & Kawai, N., 1991, ApJ, 383, 324
- (19)
- (20) Doxsey, R., Grindlay, J., Griffiths, R., Bradt, H., Johnston, M., Leach, R., Schwartz, D., & Schwarz, J. 1979, ApJ, 228, L67
- (21)
- (22) Filippenko, A. V., Leonard, D. C., Matheson, T., Li, W., Moran, E. C., & Riess, A. G. 1999, PASP, 111, 969
- (23)
- (24) Hellier, C., & Mason, K. O. 1989, MNRAS, 239, 715
- (25)
- (26) Hellier, C., Mason, K. O., Smale, A. P., & Kilkenny, D. 1990, MNRAS, 244, 39P
- (27)
- (28) Hertz, P., Wood, K. S. & Cominsky, L. R., 1997, ApJ, 486, 1000
- (29)
- (30) Homer, L., & Charles, P. A., 1998, New Astronomy, 3, 435
- (31)
- (32) In’t Zand, J., Heise, J., Smith, M. J. S., Cocchi, M., Natalucci, L., & Celidonio, G. 1999, IAU Circ., 7138
- (33)
- (34) Jahoda, K., Swank, J. H., Giles, A. B., Stark, M. J., Strohmayer, T., Zhang, W., & Morgan, E. H. 1996, in EUV, X-ray and Gamma-Ray Instrumentation for Astronomy VII, ed. O. H. Siegmund (Bellingham, WA: SPIE), 59
- (35)
- (36) Kippenhahn, R., Schmidt, H. U., & Thomas, H.-C. 1980, A&A, 90, 54
- (37)
- (38) Kitamoto, S., Mizobuchi, S., Yamashita, K., & Nakamura, H., 1992, ApJ, 384, 263
- (39)
- (40) Lewin, W. H. G., Hoffmann, J. A., & Doty, J. 1976, IAU Circ., 2994
- (41)
- (42) Mason, K. O., & Cordova, F. A. 1982, ApJ, 262, 253
- (43)
- (44) Navarro, J. 1996, in “Radio Emission from the Stars and the Sun, ASP Conf. Series vol. 93, ed. A. R. Taylor & J. M. Paredes (S.F.: ASP), 159
- (45)
- (46) Parmar, A. N., Smale, A. P., Verbunt, F., & Corbet, R. H. D., 1991, ApJ, 366, 253
- (47)
- (48) Parmar, A. N., White, N. E., Giommi, P., & Gottwald, M. 1986, ApJ, 308, 199
- (49)
- (50) Puchnarewicz, E. M., Mason, K. O., & Cordova, F. A. 1995, Ad. Space Res., Vol. 16, No. 3, 65
- (51)
- (52) Richman, H. R., Applegate, J. H., & Patterson J., 1994, PASP, 106, 1075
- (53)
- (54) Shahbaz, T., Smale, A. P., Naylor, T., Charles, P. A., van Paradijs, J., Hassall, B. J. M., & Callanan, P. 1996, MNRAS, 282, 1437
- (55)
- (56) Stetson, P. B. 1993, DAOPHOT II User’s Manual (Victoria:Dominion Astrophys. Obs.)
- (57)
- (58) van der Klis, M., et al. 1993, MNRAS, 260, 686
- (59)
- (60) van der Klis, M., & Bonnet-Bidaud, J.-M. 1989, A&A, 214, 203
- (61)
- (62) van Paradijs, J. 1995, in X-Ray Binaries, ed. W. H. G. Lewin, J. van Paradijs, & E. P. J. van den Heuvel (Cambridge: Cambridge Univ. Press), 543
- (63)
- (64) van Paradijs, J. & McClintock, J. E. 1995, in X-Ray Binaries, ed. W. H. G. Lewin, J. van Paradijs, & E. P. J. van den Heuvel (Cambridge: Cambridge Univ. Press), 91
- (65)
- (66) van Paradijs, J., van der Klis, M., & Pedersen, H. 1988, A&ASS, 76, 185
- (67)
- (68) Wachter, S., & Smale, A. P. 1998, ApJ, 496, L21
- (69)