Near-infrared detection and optical follow-up of the GRB990705 afterglow††thanks: Based on observations collected at the European Southern Observatory, La Silla and Paranal, Chile,††thanks: Based on observations collected with NOAO facilities
Abstract
Optical and near-infrared observations of the GRB990705 error box were carried out with ESO telescopes at La Silla and Paranal in Chile and with the NOAO SPIREX 0.6-meter telescope in Antarctica. We detected the counterpart of this GRB in the near-infrared band and optical band. The power-law decline of the near-infrared lightcurve is rather steep with a decay index 1.7 in the first hours, and a possible steepening after one day. Broadband spectral analysis of the optical/near-infrared afterglow suggests that this GRB took place in a high density environment. A deep optical image obtained at Antu (VLT-UT1) about 5 days after the GRB trigger shows at the position of the transient an extended object which might be the host galaxy of GRB990705.
Key Words.:
Gamma rays: bursts — Radiation mechanisms: non-thermal — Galaxies: general1 Introduction
Multiwavelength observations of Gamma–Ray Burst (GRB) afterglows are of crucial importance for understanding and constraining the active emission mechanisms (Wijers et al. 1997; Galama et al. 1998, Wijers & Galama 1999, Masetti et al. 1999). Optical and near-infrared (NIR) data carry the richest and most detailed information. In particular, since the GRB counterparts might heavily suffer from dust obscuration within the host galaxy, the NIR data, less affected by this extinction, are more effective than the optical ones for the study of the counterpart itself and of the circumburst medium, and, ultimately, in determining the nature of the GRB progenitors (see e.g. Dai & Lu 1999).
GRB990705 (Celidonio et al. 1999) was detected by the Gamma-Ray Burst Monitor (GRBM; Frontera et al. 1997, Amati et al. 1997, Feroci et al. 1997) onboard BeppoSAX (Boella et al. 1997) on 1999 July 5.66765 UT and promptly localized with a 3 accuracy by Unit 2 of the BeppoSAX Wide Field Cameras (WFC; Jager et al. 1997). This GRB lasted about 45 s in the GRBM 40–700 keV band, in which it reached a –ray peak flux of (3.7 0.1)10-6 erg cm-2 s-1 and showed a complex and multi-peaked structure. The WFC (2–26 keV) data indicate that GRB990705 had a similar duration and lightcurve in the X–rays, and that it displayed very bright X–ray emission with a peak intensity of about 4 Crab. A detailed presentation and description of the prompt event will be given by Amati et al. (in preparation).
A BeppoSAX X–ray follow-up of GRB990705 started 11 hours after the GRBM trigger (Gandolfi 1999; Amati et al. 1999). The detection of this GRB by Ulysses (Hurley & Feroci 1999) and NEAR (Hurley et al. 1999) determined two annuli intersecting the BeppoSAX WFC error circle. This allowed the reduction of the error box to 3.5 square arcmin. Radio observations carried out with ATCA (Subrahmanyan et al. 1999) detected three radio sources in the WFC error circle. However, none of them lies inside the intersection of the Ulysses, NEAR and BeppoSAX error boxes (Hurley et al. 1999).
Optical and near-infrared (NIR) observations were immediately activated at telescopes in the southern hemisphere to search for a counterpart at these wavelengths. The early imaging of the 3 radius WFC error circle at the ESO-NTT with the SOFI camera allowed us to detect a bright NIR transient (Palazzi et al. 1999) inside the Ulysses, NEAR and BeppoSAX error boxes intersection.
In this paper we report on the discovery and follow-up observations of the NIR and Optical Transients (NIRT and OT, respectively) associated with GRB990705. In Sect. 2 we describe the data acquisition and reduction, while in Sect. 3 we report the results, which are then discussed in Sect. 4.
2 Observations and data reduction
2.1 Near-infrared data
The NIR imaging started 6.6 hours after the high-energy event: -band images were acquired on 1999 July 5.9, 6.4 and 6.9 at La Silla (Chile) with the 3.58-meter ESO-NTT plus SOFI (see the observation log in Table 1). The camera is equipped with a Hawaii 10241024 pixel HgCdTe detector, with a plate scale of 029 pixel-1 and a field of view of roughly 4949. Images are composed of a number of elementary coadded frames acquired by dithering the telescope by several arcsecs every 60 s.
Reduction of the images was performed with IRAF and the STSDAS packages111IRAF is the Image Analysis and Reduction Facility made available to the astronomical community by the National Optical Astronomy Observatories, which are operated by AURA, Inc., under contract with the U.S. National Science Foundation. STSDAS is distributed by the Space Telescope Science Institute, which is operated by the Association of Universities for Research in Astronomy (AURA), Inc., under NASA contract NAS 5–26555.. Each image was reduced by first subtracting a mean sky, obtained from frames just before and after the source image. Then, a differential dome flatfield correction was applied, and the frames were registered to fractional pixels and combined. Before frames were used for sky subtraction, stars in them were eliminated by a background interpolation algorithm (imedit) combined with an automatic “star finder” (daofind).
We calibrated the photometry with stars selected from the NICMOS Standard List (Persson et al. 1998). The stars were observed in five positions on the detector, and were reduced in the same way as the source observations. Formal photometric accuracy based only on the standard star observations is typically better than 3%. The source photometry was corrected for atmospheric extinction using the mean ESO -band extinction coefficient of 0.06 (Engels et al. 1981).
-band (3.205-3.823 m) observations were also carried out in Antarctica on July 7.6 with the SPIREX 0.6-meter telescope plus the NOAO ABU IR camera with a 06 pixel-1 plate scale. ABU houses a 10241024 pixel ALADDIN InSb array operating at 36 K using a closed cycle helium refrigeration system.
Forty images (eight 5-image cross patterns - center and the cardinal points - with 30 separation) of 3-min duration each (12 coadded 15-sec integrations) were obtained for a total on-source time of 120 minutes. Images were then sky-subtracted using sky frames generated from the running median of 6 neighbors, divided by the flatfield, and spatially registered using stars within each field. The 40 images were shifted and median filtered into the 120-min composite. Star HR 2015 (McGregor 1994) was employed as an -band standard to zero-point calibrate the GRB990705 field.
2.2 Optical data
Optical imaging of the GRB990705 error box was obtained at Paranal (Chile) with the 8.2-meter ESO VLT-UT1 (“Antu”) plus FORS1 (detector scale: 02 pixel-1; field of view: 6868) on 1999 July 6.4, 8.4 and 10.4 in the band, and at La Silla (Chile) with the 2.2-meter MPG/ESO telescope plus WFI (8 CCD mosaic – detector scale: 0238 pixel-1; field of view: 3433) on 1999 July 6.4 ( band) and July 7.4 ( band). The complete log of the optical observations is reported in Table 1.
| Day of 1999 (UT) | Telescope | Filter | Exp. time | Seeing | Magnitude1 | |
| at exposure start | (minutes) | (arcsecs) | ||||
| Near-Infrared | ||||||
| Jul 5.945 | NTT | 201 | 1.0 | 16.57 0.052 | ||
| Jul 6.416 | NTT | 81 | 1.2 | 18.38 0.05 | ||
| Jul 6.955 | NTT | 101 | 1.1 | 19.92 | ||
| Jul 7.556 | SPIREX | 403 | 1.8 | 13.9 | ||
| Optical | ||||||
| Jul 6.400 | Antu | 52 | 2.5 | 22.0 0.2 | ||
| Jul 6.444 | 2.2m | 7.5 | 1.8 | 21.9 | ||
| Jul 7.432 | 2.2m | 210 | 2.0 | 22.3 | ||
| Jul 8.425 | Antu | 1 | 1.2 | 23.0 | ||
| Jul 10.401 | Antu | 65 | 0.9 | 23.99 0.07 | (pointlike object, likely unrelated to the OT) | |
| 23.8 0.2 | (extended object) | |||||
| 23.14 0.15 | (their integrated magnitude) | |||||
| 1Magnitudes of the GRB counterpart, not corrected for interstellar absorption | ||||||
| 2Uncertainties of the magnitudes are at 1 confidence level; lower limits at 3 | ||||||
Images were debiased and flat-fielded with the standard cleaning procedure; each set of frames of July 6, 7, and 10 was then co-added to increase the signal-to-noise ratio. We then chose, when applicable, PSF-fitting photometry as the measurement technique for the magnitude of point-like objects because the field is quite crowded (especially in the case of deep images) being located in the outskirts of the Large Magellanic Cloud (LMC). Photometry was performed on the images using the DAOPHOT II data analysis package PSF-fitting algorithm (Stetson 1987) within MIDAS.
In order to calibrate the images to the Johnson-Kron-Cousins photometric system, we acquired on July 7 a frame of part of Selected Area 95 with the 2.2-meter telescope and on July 10 frames of the PG 1323086, PG 2213006 and Mark A sequences (Landolt 1992) with Antu; we adopted as airmass extinction coefficients 0.11 for the and 0.25 for the .
With this photometric calibration, for comparison, the USNO-A1.0 star U0150_02651600, with coordinates (J2000) = 5h 09m 4259, = 72∘ 07 412, has = 18.72 and = 17.64. Unfortunately, the calibration frames were obtained under poor photometric conditions (see Table 1) and therefore the uncertainty on the zero point of the calibration (0.25 mag) is by far the main source of error in the measure of the magnitude of the USNO star. No color term was applied in the -band calibration since only frames were taken on July 10; so, the uncertainty on the zero point is 0.15 mag. These large errors are also due to the high airmass (larger than 2) affecting our observations. The and magnitude errors quoted in the next section are only statistical and do not contain any possible zero point offset.

We evaluated the Galactic hydrogen column density in the direction of GRB990705 using the NRAO maps by Dickey & Lockman (1990), from which we obtained = 0.721021 cm-2 and, using the empirical relationship by Predehl & Schmitt (1995), we computed a foreground Galactic absorption = 0.40. This, by applying the law by Rieke & Lebofsky (1985), corresponds to = 0.13 and to = 0.33; using the law by Cardelli et al. (1989) we then derived = 0.53 and = 0.07. The intrinsic value of in that region of the LMC is less than 1019 cm-2 (McGee et al. 1983); therefore, the reddening induced by the LMC on the NIRT/OT is practically negligible.

3 Results
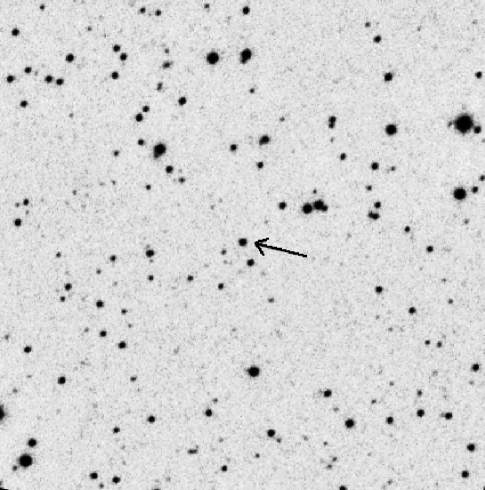
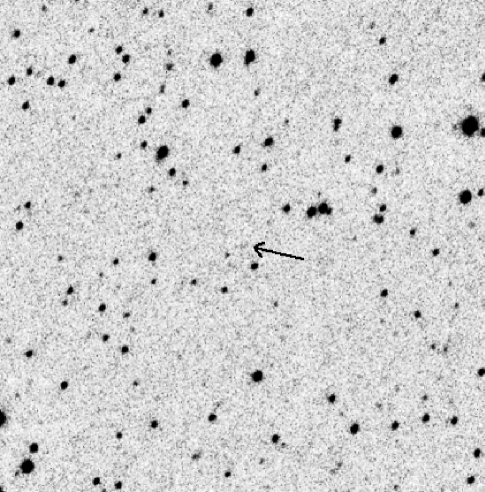
The summed 20-min NTT image of July 5.9 (Fig. 1, left panel) shows an object at a magnitude = 16.57 0.05 which in the July 6.4 8-min image is detected at = 18.38 0.05. On July 6.9 the object magnitude is 19.9 at a 3 level (Fig. 1, right panel). Astrometry done on the first NTT observation using several stars from the USNO-A1.0 catalogue gives for this fading source coordinates = 5h 09m 5452, = 72∘ 07 531 (J2000) with a 1- accuracy of 03. This object is inside the intersection of all the mentioned X–ray error boxes, and almost at the center of the BeppoSAX WFC error circle. Moreover, the observed brightness variation and the variability timescale are similar to those of previously observed optical afterglows. This leads us to conclude that it is the NIR afterglow of GRB990705 (we can exclude a LMC microlensing event since these phenomena show a completely different behaviour: see Sackett 1999 and references therein).
No object is detected in the -band July 7.6 composite image. An upper limit 13.9 with a 3 significance within a 3 pixel radius aperture at the location corresponding to the -band detection is measured.
Assuming a temporal power-law decay between the two -band detections, we find that = 1.68 0.10. Including the -band upper limit and fitting a power law the decay exponent is = 1.84 0.05, but the fit is not acceptable ( = 16.8). In the following we will thus consider = 1.7 as the decay index of the early part of the afterglow while, 1 day after the GRB, the transient has probably started a faster decay with a power-law index 2.6, based on the second -band detection and the -band upper limit. We note however that the paucity of the data makes difficult to precisely locate the epoch at which the decay slope has changed.
Antu -band observations, albeit with lower significance, due to the faintness of the object and to poorer weather conditions (see Table 1), are consistent with the NIR decay: indeed a fading optical object at a position consistent with that of the NIRT is detected. On July 6.4 this object was at = 22.0 0.2, while two days later it was below the limiting magnitude of the frame ( = 23.0, 3 level). These values indicate a power-law decay with an index 1.0, consistent with the NIR observations.
The object is not seen in the 2.2-meter frame of July 6 down to a limiting magnitude of = 21.9 and in the frame acquired with the same telescope on July 7 down to = 22.3 (both values have a 3 significance).
The NIR and optical photometry is reported in Fig. 2, where the -band early decay is also modeled as a power law.
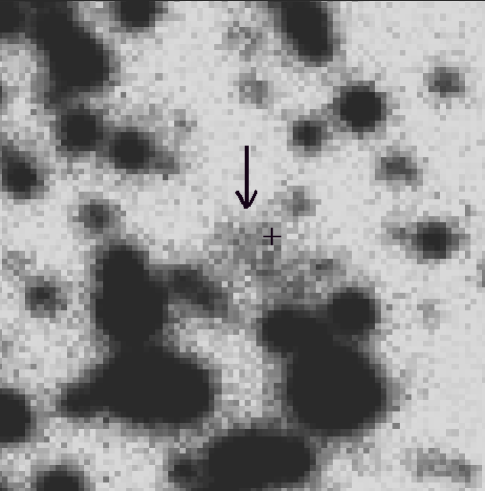
Inspection of the Antu summed 30-min image of July 10 (see Fig. 3, left panel) shows an irregular extended object at the location of the NIRT and of the OT. We estimate that the magnitude of this object ( 2408 in size) is = 23.8 0.2. Due to the poor resolution we are not able to exclude that this feature (or a portion of it) is due to the contribution of many unresolved sources in the LMC and/or background faint sources. Our photometric analysis of the field, however, reveals only one possible point-like object at = 23.99 0.07 in this area southward of the NIRT.
After comparison of positions of field stars in Antu and NTT images, the position of the point-like object is not completely consistent with that of the NIRT, being 12 (i.e. more than 4) away from it (in the first Antu image, where the OT is detected, the extremely bad seeing hampers a significant positional comparison). Assuming that the point-like source is the transient, it is hard to explain this offset as the result of a possible contribution of the extended source in the first -band observation, because if this effect were present, the centroid of the NIRT+galaxy blend would be expected to be closer to the fuzziness center than that observed in the first NTT observation. Moreover, the -band temporal decay would be much slower than that in the NIR ( 0.9). Therefore we suggest that the point-like object seen on July 10 is unrelated to the GRB, and might rather be a structure of the host galaxy, or possibly a foreground star.
The transient, as observed about 0.8 days after the GRB trigger, is fairly red. In order to evaluate its color index between the and bands, we assumed in the band a temporal decay similar to that observed in the band and computed the magnitude at the epoch of the second -band observation (July 6.416). Then, we subtracted from this magnitude the contribution of the nebulosity and of the neighboring point-like object (which is blended with the OT in the July 6.4 image) and from the magnitude of July 6.4 the upper limit of the third -band observation ( 19.9). Finally, we corrected for the Galactic extinction in the direction of GRB990705. We find = 3.5 0.2 on July 6.416; if instead the host galaxy contribution is much fainter than the third epoch upper limit, and therefore negligible in the second -band measurement, the color index is = 3.8 0.2. Both values imply a spectral slope 2 assuming a spectral energy distribution . This spectral slope would result in a magnitude 15.4 at that epoch, i.e. 1.5 magnitudes fainter than, and therefore fully consistent with, the upper limit from the SPIREX observation of more than one day after.
4 Discussion: a “red-heat” GRB afterglow
The afterglow of GRB990705 is an unprecedented case of a GRB counterpart first clearly detected in the NIR band. The detection of a possible underlying galaxy might support the extragalactic nature of this GRB although we cannot completely rule out an association with the LMC.
If the extended emission detected is the host galaxy of GRB990705 it seems to have a rather knotty and irregular shape since no regular pattern of increasing surface brightness is observed in this structure (see Fig. 3, right panel). The present data therefore suggest that the host of GRB990705 is an irregular (possibly starburst) galaxy as was proposed in other cases of GRB hosts (see e.g. Sahu et al. 1997 for the host of GRB970228, and Bloom et al. 1999 and Fruchter et al. 1999b for the host of GRB990123).
With 23.1, and assuming it is an irregular starburst galaxy with a flat optical spectrum (Fruchter et al. 1999b), we obtain for this object 22.8. Using the cumulative surface density distribution of galaxies in the band by Hogg et al. (1997), the probability of a chance coincidence between the NIR/optical afterglow of GRB990705 and the detected galaxy can be evaluated. We have 2.5104 galaxies per square degree with 22.8; with this value the probability of finding by chance a galaxy within 3 from the position of the NIRT is 0.006. This probability suggests the identification of this object with the host galaxy, although it is not completely conclusive.
This putative galaxy has an integrated (point-like source plus extended object) unabsorbed magnitude = 22.74 0.15, an extension of 2 square arcsecs and an irregular shape (see Fig. 3); therefore, it might be one of the brightest and most extended among the host galaxies of GRBs with known redshifts (GRB970228: Sahu et al. 1997, Fruchter et al. 1999a, Djorgovski et al. 1999; GRB970508: Bloom et al. 1998a, Fruchter et al. 1999c; GRB971214: Kulkarni et al. 1998, Odewahn et al. 1998; GRB980703: Bloom et al. 1998b, Vreeswijk et al. 1999; and GRB990123: Kulkarni et al. 1999, Bloom et al. 1999, Fruchter et al. 1999b). This might suggest that this object is nearer than the other GRBs.
The decay slope of this afterglow, = 1.7, is rather steep, although not as steep as observed for GRB980326 (Groot et al. 1998) and GRB980519 (Djorgovski et al. 1998, Halpern et al. 1999). From the -band light curve decay index we estimate an electron power-law distribution index 3 (Sari et al. 1999).
As already outlined in Sect. 3, the magnitude of the NIRT on July 6.9 is significantly below the extrapolation of the early decay (see Fig. 2). This strongly suggests a break in the NIRT -band light curve at 1 day after the GRB and a subsequent steepening, similar to those exhibited by the afterglows of GRB990123 (e.g. Castro-Tirado et al. 1999) and of GRB990510 (e.g. Stanek et al. 1999).
The break cannot be accounted for by the electron cooling frequency moving through the band since the expected slope change ( 0.25; Sari et al. 1998) would be much smaller than observed ( 1).
A spherical scenario in which an extremely dense surrounding medium decelerates the expanding blastwave could also produce a steepening of the light curve as envisaged by Dai & Lu (1999).
On the other hand, the steepness of the lightcurve decay might suggest beamed emission (Sari et al. 1999). Assuming that a break due to jet spreading occurred in the -band light curve of the GRB990705 NIRT about one day after the GRB, the slope 2.6 would be roughly consistent with the expected value ( = 3; Sari et al. 1999). If we place the break at the epoch of the second -band measurement, i.e. 18 hours after the GRB trigger, assuming a total isotropically-emitted energy of the ejecta of 1052 erg and a local interstellar medium density of 1 cm-3, we obtain that the angular width of the jet is 0.1, consistent with expected opening angles of GRB jets (Sari et al. 1999, Postnov et al. 1999).
This afterglow is also one of the reddest observed so far, with an optical/NIR color on July 6.4 similar to that of the OT of GRB980329 (Palazzi et al. 1998). We note that the NIR/optical spectral slope of the transient on July 6.4 and the measured index of the temporal decay would be inconsistent both with the spherical expansion of a relativistic blast wave (assumed as a valid approximation of an initially strongly beamed jet) and with a beamed expansion (Sari et al. 1999). Under the hypothesis that the optical/NIR spectrum is considerably reddened by absorption within the host galaxy, we corrected it using the extinction law of a typical starburst at various redshifts (Calzetti 1997). This approach, which we have adopted also for other GRBs with encouraging results (Palazzi et al. 1998, Dal Fiume et al. 2000), can be justified under the assumption that the heavy obscuration of this afterglow is due to its location in a high density, and probably star-forming, region.
We find a consistency with the expectation of the model by Sari et al. (1999) either for a redshift 2 or for a redshift 0.1. In both cases must be above the NIR frequencies, which is a reasonable finding given that the optical/NIR spectrum is measured at an early epoch after the GRB. Since the host galaxy is bright and rather large in angular size, we tend to favor the latter redshift estimate. This result has to be taken with caution, being based on a series of assumptions and on a single color index, and therefore affected by a large uncertainty. However, if it were correct, the emitted -ray output, for a fluence of 7.510-5 erg cm-2 (Amati et al., in preparation), would be 1.71051 erg (assuming a standard Friedmann model cosmology with = 70 km s-1 Mpc-1 and = 0.15), in the range of -ray energies typically measured for GRBs.
Acknowledgements.
M. Méndez is a fellow of the Consejo Nacional de Investigaciones Científicas y Técnicas de la República Argentina. This research was supported in part by the National Science Foundation under a cooperative agreement with the Center for Astrophysical Research in Antarctica (CARA), grant number NSF OPP 89-20223. CARA is a National Science Foundation Science and Technology Center. Principal collaborators in the SPIREX/ABU project include the University of Chicago, the National Optical Astronomy Observatories, the Rochester Institute of Technology, and the University of New South Wales. We owe special thanks for the SPIREX/ABU data to Ian Gatley, Nigel Sharp, Al Fowler and Harvey Rhody. We also thank the referee J. Lub for his comments.References
- (1) Amati L., Cinti M.N., Feroci M. et al., 1997, SPIE Proceedings 3114, 176
-
(2)
Amati L., Frontera F., Antonelli L.A. et al., 1999,
GCN222GCN Circulars are available at:
http://gcn.gsfc.nasa.gov/gcn/gcn3_archive.html. 384 - (3) Bloom J.S., Djorgovski S.G., Kulkarni S.R., Frail D.A., 1998a, ApJ 507, L25
- (4) Bloom J.S., Frail D.A., Kulkarni S.R. et al., 1998b, ApJ 508, L17
- (5) Bloom J.S., Odewahn S.C., Djorgovski S.G. et al., 1999, ApJ 518, L1
- (6) Boella G., Butler R.C., Perola G.C. et al., 1997, A&AS 122, 299
- (7) Calzetti D., 1997, AJ 113, 162
- (8) Cardelli J.A., Clayton G.C., Mathis J.S., 1989, ApJ 345 245
- (9) Castro-Tirado A.J., Zapatero-Osorio M.R., Caon N. et al., 1999, Science 283, 2069
- (10) Celidonio G., Tarei G., Rebecchi S. et al., 1999, IAU Circ. 7218
- (11) Dai Z.G., Lu T., 1999, ApJ 519, L155
- (12) Dal Fiume D., Amati L., Antonelli L.A. et al., 2000, A&A in press
- (13) Dickey J.M., Lockman F.J., 1990, ARA&A 28, 215
- (14) Djorgovski S.G., Gal R.R., Kulkarni S.R., Bloom J.S., Kelly A., 1998, GCN 79
- (15) Djorgovski S.G., Kulkarni S.R., Bloom J.S., Frail D.A., 1999, GCN 289
- (16) Engels D., Sherwood W.A., Wamsteker W., Schultz C.V., 1981, A&AS 45, 5
- (17) Feroci M., Frontera F., Costa E. et al., 1997, SPIE Proceedings 3114, 186
- (18) Frontera F., Costa E., Dal Fiume D. et al., 1997, A&AS 122, 357
- (19) Fruchter A.S., Pian E., Thorsett S.E. et al., 1999a, ApJ 516, 683
- (20) Fruchter A.S., Thorsett S.E., Metzger M.R. et al., 1999b, ApJ 519, L13
- (21) Fruchter A.S., Pian E., Gibbons R. et al., 1999c, ApJ in press (astro-ph/9903236)
- (22) Galama T.J., Wijers R.A.M.J., Bremer M. et al., 1998, ApJ 500, L97
- (23) Gandolfi G., 1999, GCN 373
- (24) Groot P.J., Galama T.J., Vreeswijk P.M. et al., 1998, ApJ 502, L123
- (25) Halpern J.P., Kemp J., Piran T., Bershady M.A., 1999, ApJ 517, L105
- (26) Hogg D.W., Pahre M.A., McCarthy J.K. et al., 1997, MNRAS 288, 404
- (27) Holland S., Hjorth J., 1999, A&A 344, L67
- (28) Hurley K., Feroci M., 1999, GCN 379
- (29) Hurley K., Cline T., Feroci M., 1999, GCN 380
- (30) Jager R., Mels W.A., Brinkman A.C. et al., 1997, A&AS 125, 557
- (31) Kulkarni S.R., Djorgovski S.G., Ramaprakash A.N. et al., 1998, Nat 393, 35
- (32) Kulkarni S.R., Djorgovski S.G., Odewahn S.C. et al., 1999, Nat 398, 389
- (33) Landolt A.U., 1992, AJ 104, 340
- (34) Masetti N., Pian E., Palazzi E. et al., 1999, A&AS 138, 453
- (35) McGee R.X., Newton L.M., Morton D.C., 1983, MNRAS 205, 1191
- (36) McGregor P.J., 1994, PASP 106, 508
- (37) Odewahn S.C., Djorgovski S.G., Kulkarni S.R. et al., 1998, ApJ 509, L5
- (38) Palazzi E., Pian E., Masetti N. et al., 1998, A&A 336, L95
- (39) Palazzi E., Masetti N., Pian E. et al., 1999, GCN 377
- (40) Persson S.E., Murphy D.C., Krzeminski W., Roth M., Rieke M.J., 1998, AJ 116, 2475
- (41) Predehl P., Schmitt J.H.M.M., 1995, A&A 293, 889
- (42) Postnov K.A., Prokhorov M.E., Lipunov V.M., 1999, A&A submitted (astro-ph/9908136)
- (43) Rieke G.H., Lebofsky M.J., 1985, ApJ 288, 618
- (44) Sackett P., 1999, VLT Opening Symposium. To appear in the Springer-Verlag series “ESO Astrophysics Symposia” (astro-ph/9907185)
- (45) Sahu K.C., Livio M., Petro L. et al., 1997, Nat 387, 476
- (46) Sari R., Piran T., Narayan R., 1998, ApJ 497, L17
- (47) Sari R., Piran T., Halpern J.P., 1999, ApJ 519, L17
- (48) Stanek K.Z., Garnavich P.M., Kaluzny J., Pych W., Thompson I., 1999, ApJ 522, L39
- (49) Stetson P.B., 1987, PASP 99, 191
- (50) Subrahmanyan R., Cunningham S.J., Wieringa M.H., Frail D.A., Kulkarni S.R., 1999, GCN 376
- (51) Vreeswijk P.M., Galama T.J., Owens A. et al., 1999, ApJ 523, 171
- (52) Wijers R.A.M.J., Galama T.J., 1999, ApJ 523, 177
- (53) Wijers R.A.M.J., Rees M.J., Mészáros P., 1997, MNRAS 288, L51