Galaxy & Cluster Biasing from Local Group Dynamics
Abstract
Comparing the gravitational acceleration induced on the Local Group of galaxies by different tracers of the underline density field we estimate, within the linear gravitational instability theory and the linear biasing ansatz, their relative bias factors. Using optical SSRS2 galaxies, IRAS (PSCz) galaxies and Abell/ACO clusters, we find and , in agreement with other recent studies. Finally, there is an excellent one-to-one correspondence of the PSCz and Abell/ACO cluster dipole profiles, once the latter is rescaled by , out to at least Mpc.
Keywords: galaxies: clusters: general - large-scale structure of universe - infrared: galaxies
1 Introduction
Different classes of extragalactic objects trace the underlying matter distribution differently. The realization of such a behaviour arose from the fact that the amplitude of the 2-point correlation function of clusters of galaxies is significantly higher than that of galaxies (cf. Bahcall & Soneira 1983). This was suggested by Kaiser (1984) as a result of the clustering characteristics of different height peaks in an underlying random Gaussian field. A first order description of the effect is provided by linear biasing in which the extragalactic mass tracer fluctuation field is related to that of the underlying mass by:
| (1) |
with the linear bias factor. Even in this simplistic model the bias cannot be measured directly and only theoretical considerations or numerical simulations can provide some clues regarding its value. However, the relative bias between different tracers can be measured and such attempts, using their clustering properties, have provided interesting, although somewhat conflicting, results. Lahav, Nemiroff & Piran (1990) comparing the angular correlation function of different subsamples of the UGC, ESO and IRAS catalogues find an optical to IR galaxy bias factor, , ranging from 1 to 2 with preferred value . Babul & Postman (1990) using the spatial correlation function of the CfA and IRAS galaxies find , while comparing the QDOT correlation function (Saunders, Rowan-Robinson & Lawrence 1992) with that of APM galaxies (Maddox et al. 1990) one finds . Similarly, Oliver et al. (1996) comparing the clustering properties of the APM-Stromolo survey of optical galaxies and an extended IRAS redshift survey found . Strauss et al. (1992a) using the 1.936 Jy IRAS sample find that the overdensity ratio between CfA and IRAS galaxies within a sphere centered on Virgo with the Local Group on the periphery gives while their correlation function analysis provides discrepant results when comparing IRAS to CfA or SSRS optical galaxies (with and 1, respectively). Recently, Willmer, daCosta & Pellegrini (1998) using the SSRS2 sample of optical galaxies and comparing with the clustering properties of the 1.2 Jy IRAS survey find and () in redshift and real space respectively, while Seaborne et al (1999) performing a similar analysis between the PSC and Stromolo-APM redshift surveys find .
A different approach using the dynamics of the local group of galaxies, was proposed in Plionis (1995) and Kolokotronis et al. (1996). Traditionally, dynamical studies have been used in an attempt to constrain the value of the cosmic density parameter, , by assuming linear theory and comparing observed galaxy or cluster peculiar velocities with estimated accelerations (cf. Strauss & Willick 1995). However due to biasing only the combination can be estimated. Such an analysis has been extensively applied to the Local Group of galaxies, since its peculiar velocity is accurately determined from the CMB temperature dipole (Kogut et al. 1996) and its gravitational acceleration can be measured from the dipole moment of the surrounding spatial distribution of different mass tracers. Within linear theory acceleration and peculiar velocity should be aligned and this indeed has been found to be the case using optical, IR galaxies, X-ray or optical cluster surveys and AGN’s (cf. reviews of Strauss & Willick 1995, Dekel 1997 and references therein). In the linear biasing framework the different mass tracers should therefore exibit similar dipole profiles differing only in their amplitudes, the ratio of which is a measure of their relative bias. Therefore, one can estimate the relative bias factor between different mass tracers, because in the intercomparison of their velocity-acceleration relations the parameter as well as the velocity cancels out.
In this study we use the recently completed PSCz IRAS galaxy survey (Saunders et al. 1999), the SSRS2 optical galaxy catalogue (DaCosta et al. 1998) and a subsample of the Abell/ACO cluster catalogue (as defined in Branchini & Plionis 1996) to estimate their relative bias factors by comparing their dipole moments.
2 Method
Using linear perturbation theory one can relate the gravitational acceleration of an observer, induced by the surrounding mass distribution, to her/his peculiar velocity:
| (2) |
The dipole moment, , is estimated by weighting the unit directional vector pointing to the position of each tracer, with its gravitational weight and summing over the tracer distribution;
| (3) |
with
| (4) |
where is the luminosity function of the objects under study, , with the flux limit of the sample and is the mean tracer number density, given by integrating the luminosity function over the whole luminosity range.
Using two different tracers, and , of the underlying matter density field to determine the Local Group acceleration one can write: and therefore we can obtain an estimate of their relative bias factor from:
| (5) |
Since the dipole is a cumulative quantity and at each distance it depends on all previous shells, we cannot define an unbiassed statistic to fit eq.5. Rather, we can obtain a crude estimate of the reliability of the resulting bias factor by estimating Pearson’s correlation coefficient, , between the two dipole profiles (see Kolokotronis et al. 1996); a value would indicate a perfect match of the two dipole profiles and thus a very reliable estimate of their relative linear bias factor.
A statistically more reliable approach is to assume that the differential dipoles, estimated in equal volume shells, are independent of each other and then fit according to:
| (6) |
where is the zero-point offset of the relation and is the corresponding shot-noise errors, estimated by using either of two methods; a Monte-Carlo approach in which the angular coordinates of all tracers are randomized while keeping their distance, and thus their selection function, unchanged or the analytic estimation of Strauss et al. (1992b); .
3 Data
We use in our analysis three different catalogues of mass tracers;
-
•
The recently completed IRAS flux-limited 60-m redshift survey (PSCz) which is described in Saunders et al. (1999). It is based on the IRAS Point Source Catalogue and contains galaxies with flux Jy. The subsample we use, defined by and limiting galaxy distance of 180 Mpc, contains galaxies and covers of the sky.
-
•
The SSRS2 catalogue of optical galaxies (DaCosta et al. 1998) which is magnitude limited to and contains 3573 galaxies in the South (, ) and 1939 galaxies in the North (, ), covering in total 13.5% of the sky.
-
•
A volume limited subsample of the Abell/ACO cluster catalogue, with and limited within 180 Mpc (see Branchini & Plionis 1996). Our sample contains 197 clusters.
3.1 Determining distances from redshifts
All heliocentric redshifts are first transformed to the Local Group frame using . We then derive the distance of each tracer by using:
| (7) |
where Mpc and is a non-linear term to correct the redshifts for the tracer peculiar velocities:
| (8) |
with the peculiar velocity of the Local Group and the peculiar velocity of a galaxy or cluster at position . Instead of using elaborate 3D reconstruction schemes (cf. Schmoldt et al 1999; Branchini & Plionis 1996; Branchini et al 1999; Rowan-Robinson et al. 1999) to estimate this term, we decided to use a rather simplistic velocity field model (see Basilakos & Plionis 1998) to treat consistently all three data sets (a self-consistent 3D reconstruction of the SSRS2 density field is in any case not possible due to the small area covered by the survey). Our simplistic velocity field model was found in Basilakos & Plionis (1998) to be sufficient in order to recover the IRAS 1.2Jy and QDOT 3-D dipole. We remind the reader the main assumptions of this model:
(a) The tracer peculiar velocities can be split in two vector components; that of a bulk flow and of a local non-linear term:
| (9) |
(b) The first component dominates and thus that
| (10) |
We then use the observed bulk flow direction and profile, as a function of distance, given by Dekel (1997) and combined with that of Branchini, Plionis & Sciama (1996). The zero-point, , and the direction of the bulk flow is estimated applying eq.(9) at and assuming, due to the “coldness” of the local velocity field (cf. Peebles 1988), that km/sec (where is the LG infall velocity to the Virgo Supercluster).
3.2 Galaxy densities
To estimate the local acceleration field it is necessary to recover the true galaxy density field from the observed flux-limited samples. This is done by weighting each galaxy by , where , is defined in eq.4. For the PSCz sample we use the Saunders et al. (1990) luminosity function derived from the QDOT catalogue, with since lower luminosity galaxies are not represented well in the available samples (cf. Rowan-Robinson et al. 1990), and . For the SSRS2 sample we use the Schechter luminosity function of Marzke et al. (1998) with and .
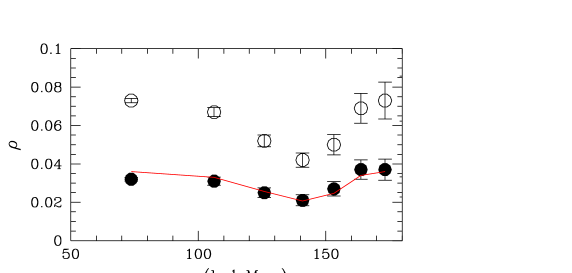
In figure 1 we present the mean density and its Poissonian uncertainty of PSCz and SSRS2 galaxies in their common area (that of the SSRS2 sample) and in equal volume shells (with Mpc3). Their densities are extremely comparable, differing only by a constant factor ().
4 Results
4.1 Optical to IR galaxy bias
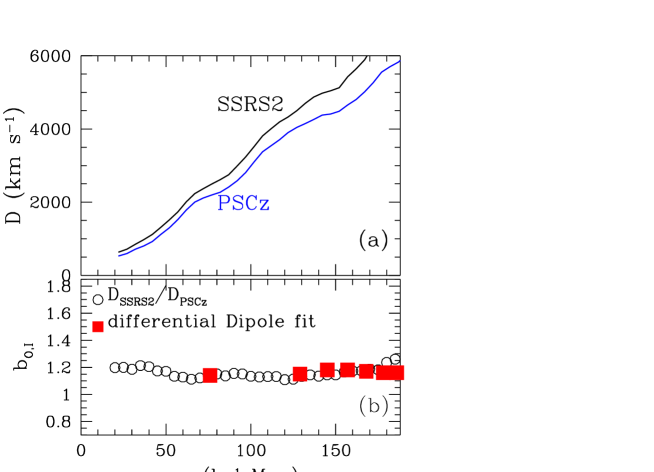
We first present the results of the intercomparison of the SSRS2 and PSCz samples in their common sky area and for Mpc. In figure 2a we show the amplitudes of the two dipoles as a function of distance from the LG. The monotonic dipole increase reflects the fact that we are measuring only the component of the whole sky dipole which is due to the particular area covered by the sky restricted SSRS2 sample. It is apparent that the shapes of the two dipole amplitudes are extremely similar, giving correlation coefficient .
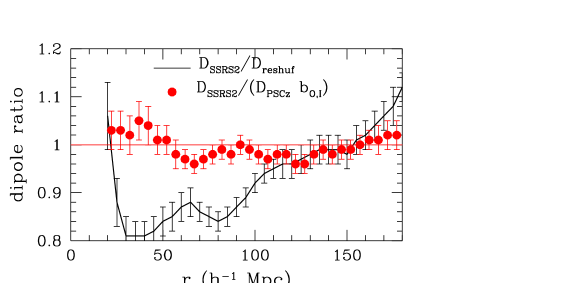
In figure 2b we present the direct dipole ratio (eq.5) in the LG frame (open symbols), while as filled squares the results of the fit of eq.6, as a function of maximum distance used. No significant differences are found when correcting distances for peculiar velocities. It is evident that the different estimates are consistent with each other, especially for Mpc where the direct dipole ratio becomes flat. It is essential, however, to verify whether such a good dipole-profile correlation could result solely due to the small solid angle used, ie., to investigate whether the survey geometry, coupled with the galaxy selection function, dominates the dipole signal of both samples. To this end we have generated 100 mock SSRS2 samples by reshuffling the galaxy angular coordinates while leaving their distances, and thus selection function, unchanged. If the reshuffled dipole profile resembles that of the SSRS2 original one, then this would indicate the existence of the previously suggested bias. In figure 3 we present both (a) the dipole ratio between the original SSRS2 dipole and the reshuffled one together with its scatter and (b) the SSRS2 and PSCz dipole ratio with the latter rescaled by . It is evident that the former ratio deviates significantly from one, an indication that our comparison is not dominated by the suspected bias.
Using the differential equal volume dipoles to fit eq.6 for Mpc, we find , with zero-point km/sec and for 6 degrees of freedom. The fit is performed using the FITEXY routine of Press et al. (1992) and the uncertainties of the fitted parameters correspond to the confidence region boundary. The small zero-point offset could be due to uncertainties in tracing the very local contributions to the LG dipole. Indeed, integrating the the SSRS2 and PSCz dipoles for Mpc (presented in figure 2) we find no zero-point offset km/sec but a slightly smaller bias factor , with for 6 degrees of freedom. We derive a mean estimate of the bias factor and its uncertainty by varying both the inner and outer dipole integration limits in eq.5 and by taking into account the slight differences of the results based on the differential dipole (eq.5). The resulting optical to IR galaxy bias factor is:
Our result is in quite good agreement (within ) with that of Seaborne et al (1999), which is based on the PSCz and APM galaxy clustering properties on relatively smaller scales than those probed by our dipole analysis.
4.2 Rich cluster to IR galaxy bias
In the case of the cluster and PSCz samples we have a nearly full sky coverage, except at low-galactic latitudes. In order to recover the whole sky dipole we use a spherical harmonic approach to ”fill” the unobserved part of the sky (cf. Lahav 1987; Plionis & Valdarnini 1991). This approach has been found to provide compatible results with the cloning and interpolating method (see Branchini & Plionis 1996 for such a comparison in the context of the cluster dipole).
The main drawback of comparing the cluster and galaxy dipoles arises from the fact that the Abell/ACO cluster distribution is incomplete in the local universe, since it does not include the Virgo cluster, an important contributor of the local velocity field (cf. Tully & Shaya 1984). Therefore the direct comparison of the dipole amplitudes is hampered by this zero-point uncertainty. We can attempt to correct for this problem by:
including the local Virgo contribution to the cluster dipole by assigning an appropriate Abell number count () weight to the Virgo cluster,
excluding from the PSCz dipole the very near contributions ( Mpc).
A first attempt to derive the cluster to IR galaxy bias, using such a procedure and the Abell/ACO and QDOT catalogues, was present in Plionis (1995). If clusters and galaxies do trace the same underline field, as indeed appears to be the case (cf. Branchini et al. 1999; Branchini, Zehavi, Plionis & Dekel 1999), then we should be able to fit the two profiles, using eq.6, varying the Virgo cluster weight. The appropriate value of is that for which the zero-point, , of the fit vanishes and thus we will consider as our preferred bias parameter the corresponding value of . Statistically, this procedure does not provide a rigorous significance indication, due to the fact that the dipoles are cumulative quantities, but it provides a means of comparing quantitatively the two dipole profiles. In order to test the robustness of the resulting bias parameter we fit the two dipole profiles as a function of distance.
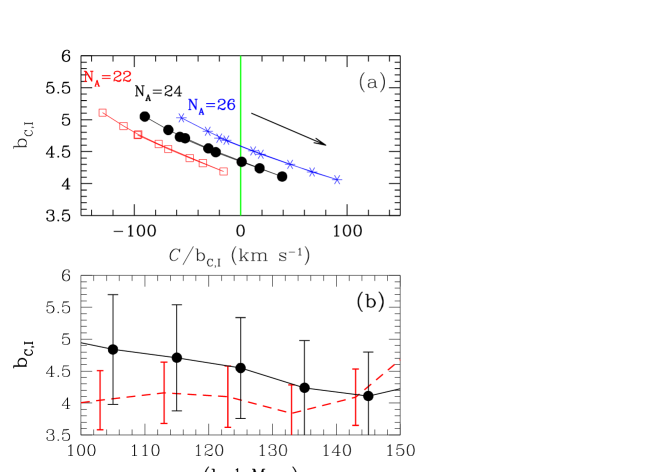
In figure 4a we present the resulting bias parameter versus the zero point, , for the Virgo cluster weights that provide a fit with . The different connected point arrays correspond to results based on the different weights while different points in each array correspond to different upper distance limits used for the fit, which increase as indicated by the arrow. Taking into account that the zero-point uncertainty is km/sec we conclude that the Virgo cluster weight for which is , confirming the notion that Virgo corresponds to a richness class Abell cluster. A consistency check, that we pass with success, is that the Virgocentric infall velocity that corresponds to this weight is km/sec, a value in agreement with most available determinations.
In figure 4b we present the fitted bias parameter as a function of upper distance limit (points) and the direct dipole ratio (eq.5) as broken lines for the case. Both seem consistent within their uncertainties, especially for distances Mpc, which roughly corresponds to the apparent cluster dipole convergence depth.
The main result regarding the bias parameter is:
which interestingly is mostly independently of the Virgo cluster weights (as can be seen in figure 4a), since such differences are absorbed in the value of . The uncertainty in reflects (a) variations due to different Virgo weights, (b) the variation between the eq.5 and eq.6 solutions and (c) the scatter around these solutions (see figure 4b). It does not include, however, the cosmic variance which results from the use of only one observer. Our results are in excellent agreement with those of Peacock & Dodds (1994) and Branchini et al. (1999b) based on completely different approaches.
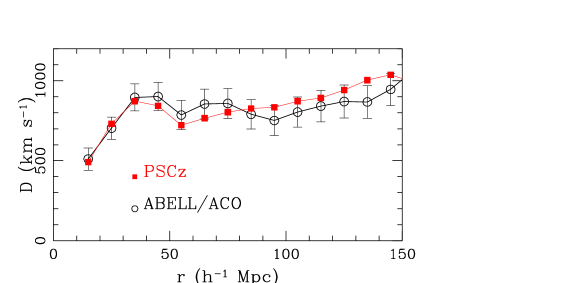
In figure 5 we present a direct comparison of the PSCz and Abell/ACO cluster dipoles, out to 150 Mpc, after having scaled down the latter by . The errorbars in the cluster dipole reflect mainly the uncertainty of the cluster density between the Abell and ACO parts of the sample (see Plionis & Kolokotronis 1998 and references therein). The two profiles are in excellent agreement, at least, up to Mpc with correlation coefficient . This is a further indication that the two density fields are consistent with each other out to these distances and supports the existence of dipole contributions from large depths (see also Schmoldt et al. 1999; Basilakos & Plionis 1998), suggestions which were first put forward by Plionis (1988), on the basis of the Lick counts, by Rowan-Robinson et al. (1990) on the basis of the QDOT survey and by Scaramella et al. (1991) and Plionis & Valdarnini (1991) on the basis of Abell/ACO clusters. A thorough investigation of the deep PSCz dipole (distances Mpc) will be presented in Rowan-Robinson et al. (2000).
5 Conclusions
We have used a novel approach, based on the Local Group dipole properties, to estimate the relative bias parameter of different mass tracers. We find that the optical to IR galaxy bias parameter is , while the rich cluster to IR galaxy bias is . Our results are in good agreement with others based on different approaches. We find that the IR galaxy and rich cluster dipole profiles are extremely compatible once the latter is rescaled by out to at least Mpc.
Acknowledgements
S.B. thanks the Greek State Fellowship Foundation for financial support (Contract No 2669). We thank V. Kolokotronis for useful comments.
References
- [] Babul, A. & Postman, M., 1990, ApJ, 359, 280
- [] Bahcall, N. & Soneira, R., 1983, ApJ, 270, 20
- [] Basilakos, S. & Plionis, M., 1998, MNRAS, 299, 637
- [] Branchini E., Plionis M., 1996, ApJ, 460, 569
- [] Branchini E., Plionis M., Sciama D.W., 1996, ApJ, 461, L17
- [] Branchini E., et al., 1999a, MNRAS, in press
- [] Branchini E., Zehavi, I., Plionis, M. & Dekel, A., 1999b, MNRAS, in press
- [] DaCosta, L.N. et al., 1998, AJ, 116, 1
- [] Dekel A., 1997, in L.da Costa ed. ‘Galaxy Scaling Relations: Origins, Evolution & Applications’, Springer, in press
- [] Kaiser N., 1984, ApJ, 284, L9
- [] Kogut et al., 1993, ApJ, 419, 1
- [] Kolokotronis, V., Plionis, M., Coles, P., Borgani, S., Moscardini, L., 1996, MNRAS, 280, 186
- [] Lahav O., Nemiroff, J. & Piran, T., 1990, ApJ, 350, 119
- [] Lahav O., 1987, MNRAS, 225, 213
- [] Maddox, S.J., Efstathiou, G., Sutherland, W.J. & Loveday, J., 1990, MNRAS, 242, 43p
- [] Marzke, R.O., DaCosta, L.N., Pellegrini, P.S., Willmer, N.A., Geller, M.J., 1998, ApJ, 503, 617
- [] Oliver, S.J. et al., 1996, MNRAS, 280, 673
- [] Peacock, J.A. & Dodds, S.J., 1994, MNRAS, 267, 1020
- [] Peebles, P.J.E., 1988, ApJ, 332, 17
- [] Press, W.H., Teukolsky, S.A., Vetterling, W.T. & Flannert, B.P., ”Numerical Recipies”, edition, 1992, Cambridge Univ. Press
- [] Plionis, M., 1988, MNRAS, 234, 401
- [] Plionis, M., 1995, in Balkowsky C. et al., eds, Proc. of the Moriond Meeting on Clustering in the Universe. Editions Frontieres, Gif-sur-Yvette
- [] Plionis, M. & Valdarnini, R., 1991, MNRAS, 249, 46
- [] Plionis M. & Kolokotronis, V., 1998, ApJ, 500, 1
- [] Rowan-Robinson M., Lawrence A., Saunders W., Crawford J., Ellis R.S., Frenk C.S., Parry I., Xiaoyang X., Allington-Smith J., Efstathiou G., Kaiser N., 1990, MNRAS, 247, 1
- [] Rowan-Robinson M. et al., 2000, in preparation
- [] Saunders W., Rowan-Robinson M., Lawrence A., Efstathiou G., Kaiser N., Ellis R.S. & Frenk, C.S., 1990, MNRAS, 242, 318
- [] Saunders W., Rowan-Robinson M., Lawrence A., 1992, MNRAS, 258, 134
- [] Saunders W., et al. 1999, in preparation
- [] Scaramella, R., Vettolani, G., Zamorani, G., 1991, ApJ, 376, L1
- [] Schmoldt, I., et al. 1999, MNRAS, 304, 893
- [] Seaborne, M.D., et al. 1999, astro-ph/9905182
- [] Strauss M.A. & Willick, J.A. 1995, Phys. Rep., 261, 271
- [] Strauss M.A., Davis M., Yahil, A., Huchra J.P., 1992a, ApJ, 385, 421
- [] Strauss M.A., Yahil A., Davis M., Huchra J.P., Fisher K., 1992b ApJ, 397, 395
- [] Tully, R.B. & Shaya, E.J., 1984, ApJ, 281, 31
- [] Willmer C.A., DaCosta, L.N. & Pellegrini, P.S., 1998, AJ, 11, 869