LOTIS Upper Limits and the Prompt OT from GRB 990123
Abstract
GRB 990123 established the existence of prompt optical emission from gamma-ray bursts (GRBs). The Livermore Optical Transient Imaging System (LOTIS) has been conducting a fully automated search for this kind of simultaneous low energy emission from GRBs since October 1996. Although LOTIS has obtained simultaneous, or near simultaneous, coverage of the error boxes obtained with BATSE, IPN, XTE, and BeppoSAX for several GRBs, image analysis resulted in only upper limits. The unique gamma-ray properties of GRB 990123, such as very large fluence (top 0.4%) and hard spectrum, complicate comparisons with more typical bursts. We scale and compare gamma-ray properties, and in some cases afterglow properties, from the best LOTIS events to those of GRB 990123 in an attempt to determine whether the prompt optical emission of this event is representative of all GRBs. Furthermore, using LOTIS upper limits in conjunction with the relativistic blast wave model, we weakly constrain the GRB and afterglow parameters such as density of the circumburster medium and bulk Lorentz factor of the ejecta.
Introduction
The ultimate reward for the Gamma-Ray Burst Coordinates Network (GCN) barthelmy98 came when the Robotic Optical Transient Search Experiment (ROTSE) detected prompt optical emission from GRB 990123 akerlof99 . Although this discovery marks another milestone in comprehending the physics of GRBs, bright optical transients (OTs) may be the exception rather than the rule. Both LOTIS and ROTSE have unsuccessfully attempted to detect these predicted flashes on many occasions park97a ; park97b ; williams98 ; williams99 ; schaefer99 ; kehoe99 . Although some of the non-detections may be attributed to large extinction, GRB 990123 demonstrated that the progenitor is not always obscured.
Observations & Analysis
During more than 1100 nights of possible observations (since October 1996), LOTIS has responded to 127 GCN triggers. Of these, 68 triggers were unique GRB events; a rate of approximately one unique GRB event every 16.5 days. The quality of the LOTIS “coverage” for a given event depends on five factors: observing conditions, LOTIS response time, difference between the initial and final coordinates, size of the final error box, and the duration of the GRB. Table 1 lists 13 events for which LOTIS achieved good coverage.
| Date | BATSE | ||||||
|---|---|---|---|---|---|---|---|
| Trig. | ( cm-2 s-1) | ||||||
| 990123 | 7343 | ||||||
| 961017 | 5634 | ||||||
| 961220 | 5719 | ||||||
| 970223 | 6100 | ||||||
| 970714 | 6307 | ||||||
| 970919 | 6388 | ||||||
| 971006 | 6414 | ||||||
| 971227 | 6546 | ||||||
| 990129 | 7360 | ||||||
| 990308 | 7457 | ||||||
| 990316 | 7475 | ||||||
| 990413 | 7518 | ||||||
| 990803 | 7695 | ||||||
| 990918 | 7770 | ||||||
First we compare GRB 990123 with the LOTIS upper limits to test whether the flux of the prompt optical emission scales with some gamma-ray property. Here and throughout the analysis we neglect extinction effects. The first row in Table 1 lists the properties of GRB 990123 briggs99 ; akerlof99 . The columns display the UTC date of the burst, the BATSE trigger number, the 64 ms and 1024 ms peak fluxes (50 - 300 keV), and the gamma-ray fluence (20 kev) of each event. The last three columns are the scaled magnitudes,
| (1) |
where , the peak magnitude of GRB 990123, and and are the peak flux or fluence values for those events.
The LOTIS sensitivity varies depending on observing conditions but in general a conservative limiting magnitude is prior to March 1998 (upgrade to cooled CCD) and following that date. Table 1 shows that the scaled prompt optical emission for both peak flux and fluence is often brighter than the LOTIS upper limits which suggests that these simple relationships are not valid.
Briggs et al. briggs99 show that the optical flux measured during GRB 990123 is not consistent with an extrapolation of the burst spectrum to low energies. However Liang et al. liang99 point out that the extrapolated tails rise and fall with the optical flux. A low energy enhancement would produce an upward break which might account for the measured optical flux during GRB 990123. It is important to determine if there is a low energy upturn in the spectrum since it would establish whether or not the optical and gamma-ray photons are produced by the same electron distribution. The LOTIS upper limits can be used to constrain a low energy enhancement assuming it is common to all GRBs.

For the events listed in Table 1 we fit the gamma-ray spectra during the LOTIS observations to the Band functional form band93 . In a few cases the low energy extrapolation is near the LOTIS upper limit. The solid line in Figure 1 shows the Band fit to GRB 971006 and its extrapolation to low energies. Fits to the spectra of GRB 990123 during the first (short dash), second (dash-dot), and third (long dash) ROTSE observations and the corresponding ROTSE detections (filled circles) are also shown. The extrapolation of GRB 971006, predicts an optical flash. Even a slight upward break in the spectrum would have produced a detectable OT. We conclude that the LOTIS upper limits support the hypothesis that the low energy emission is produced by a different electron distribution than the high energy emission.
Finally we attempt to use the LOTIS upper limits and the external reverse shock model to constrain the physical properties of the GRB blast wave. Sari and Piran sari99 show that the fraction of the energy which gets emitted in the optical band depends on the values of the cooling frequency and the characteristic synchrotron frequency. For the external reverse shock these frequencies are given by
| (2) |
| (3) |
where and are the fraction of equipartition energy in the electrons and magnetic field, is the total energy in units of erg, is the density of circumburster medium in cm-3, is the initial Lorentz factor, and is the duration of the emission in seconds.
Sari and Piran assume the frequency dependencies modify the fluence of a moderately strong GRB, i.e. erg cm-2. In this analysis we compare the afterglow properties of GRB 970508 found by Wijers and Galama wijers99 to those found by Granot et al. granot99 . Therefore we use a fluence of erg cm-2 emitted over the entire LOTIS integration time of s. The index of the electron power-law distribution is set to .
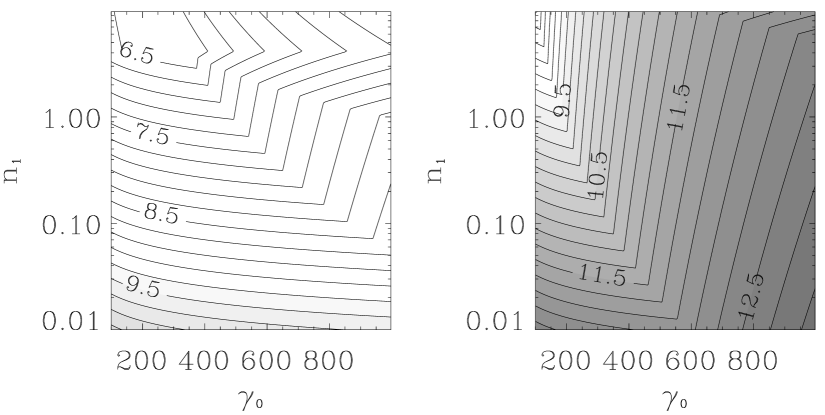
Figure 2 shows contour plots of the predicted magnitude of the prompt OT for GRB 970508 as a function of and . GRB 970508 could not be observed by LOTIS or ROTSE since it occurred during the day. Values of , , and from Wijers and Galama are used in the left panel and values of , , and from Granot et al. are used in the right panel. The right panel demonstrates the effect of altering the total energy and the distribution of energy to the electrons and the magnetic field. The smaller values of and shift the contours to the upper left while the larger steepens the breaks in the contours. The increased shading corresponds to a decreasing detection probability. However for nearly all values of and shown the predicted OT could have been detected by the upgraded LOTIS system.
Wijers and Galama find a circumburster medium density of which predicts an optical flash nearly independent of the initial Lorentz factor. Granot et al. find a considerably higher vlaue of , which predicts an OT which is very dependent on the initial Lorentz factor. The LOTIS upper limits mildly favor the GRB blast wave values determined by Granot et al. since dim OTs are predicted over a larger range of initial Lorentz factors.
References
- (1) Barthelmy, S. D., et al., ”The GRB Coordinates Network (GCN): A Status Report”, in Gamma-Ray Bursts 4th Huntsville Symposium, edited by C. A. Meegan, R. D. Preece, & T. M. Koshut, AIP Conf. Proc. 428, Woodbury, 1998, pp. 99-103.
- (2) Akerlof, C. W., et al., Nature 398, 400-402, (1999).
- (3) Park, H. S., et al., ApJ 490, 99-108 (1997).
- (4) Park, H. S., et al., ApJ 490, L21-L24 (1997).
- (5) Williams, G. G., et al., ”First Year Results from LOTIS”, in Gamma-Ray Bursts 4th Huntsville Symposium, edited by C. A. Meegan, R. D. Preece, & T. M. Koshut, AIP Conf. Proc. 428, Woodbury, 1998, pp. 837-841.
- (6) Williams, G. G., et al., ApJ 519, L25-L29 (1999).
- (7) Schaefer, B. E., et al., ApJ 524, L103-L106 (1999).
- (8) Kehoe, R., et al., submitted to Proceedings of the 1999 May Symposium of the Space Telescope Institute, (1999); (astro-ph/9909219).
- (9) Briggs, M. S., et al., ApJ 524, 82-91 (1999).
- (10) Liang, E. P., et al., ApJ 519, L21-L24 (1999).
- (11) Band, D. L., et al., ApJ 413, 281-292 (1993).
- (12) Sari, R., and Piran, T., ApJ 520, 641-649 (1999).
- (13) Wijers, R. A. M. J., and Galama, T. J., ApJ 523, 177-186 (1999).
- (14) Granot, J., et al., ApJ, submitted (1999); (astro-ph/9808007).