HST and VLA Observations of the H2O Gigamaser Galaxy TXS2226-1841
Abstract
We present HST/WFPC2 images in H+[N II]6548,6583 lines and continuum radiation and a VLA map at 8 GHz of the H2O gigamaser galaxy TXS2226-184. This galaxy has the most luminous H2O maser emission known to date. Our red continuum images reveal a highly elongated galaxy with a dust lane crossing the nucleus. The surface brightness profile is best fitted by a bulge plus exponential disk model, favoring classification as a highly inclined spiral galaxy (). The color map confirms the dust lane aligned with the galaxy major axis and crossing the putative nucleus. The H+[N II] map exhibits a gaseous, jet-like structure perpendicular to the nuclear dust lane and the galaxy major axis. The radio map shows compact, steep spectrum emission which is elongated in the same direction as the H+[N II] emission. By analogy with Seyfert galaxies, we therefore suspect this alignment reflects an interaction between the radio jet and the ISM. The axes of the nuclear dust disk, the radio emission, and the optical line emission apparently define the axis of the AGN. The observations suggest that in this galaxy the nuclear accretion disk, obscuring torus, and large scale molecular gas layer are roughly coplanar. Our classification of the host galaxy strengthens the trend for megamasers to be found preferentially in highly inclined spiral galaxies.
Subject headings:
galaxies: active — galaxies: individual (TXS2226-184) — galaxies: jets — galaxies: nuclei — galaxies: Seyferts — masers1. Introduction
In recent years a number of active galaxies have been found to have powerful H2O maser emission in their nuclei (e.g. Braatz, Wilson, & Henkel 1994; 1996). It is known that the H2O megamaser phenomenon is associated with nuclear activity since all such megamaser sources are in either Seyfert 2 or LINER nuclei. The standard model for Seyfert galaxies involves a central engine (black hole and accretion disk) producing ionizing radiation, and an “obscuring torus” which shadows the ionizing radiation into bi-conical beams along its rotation axis (see Antonucci 1993 for a review). This beaming is readily seen in some Seyferts as bi-conical emission-line structures (e.g. Pogge 1989). Extended radio emission, when present, is usually aligned with the emission-line gas (e.g. Wilson & Tsvetanov 1994). Detailed studies also indicate a strong interaction between the radio ejecta and the optically visible ionized gas (Capetti et al. 1996; Falcke et al. 1996; Falcke, Wilson, & Simpson 1998; Ferruit et al. 1999).
It appears reasonable to infer that the masers trace molecular material associated with the obscuring torus or an accretion disk that feeds the nucleus. This notion was confirmed in great detail by VLBI observations of the megamaser in NGC 4258 (Miyoshi et al. 1995; Greenhill et al. 1995). The positions and velocities of the H2O maser lines show that the masing region is a thin disk in Keplerian rotation around a central mass of at a distance of 0.16 pc from that mass (Herrnstein et al. 1999).
Although plausible scenarios for the megamaser phenomenon exist (e.g. Neufeld & Maloney 1995), it is by no means clear how the material which obscures the nucleus (the “obscuring torus”) and the masing disk are related. The masing disk may be part of a geometrically thin, molecular accretion disk at smaller radii than the torus, or the thin, central plane of a thick torus in which the column density is high enough for strong amplification. Alternatively, the whole structure could be a warped thin disk, so the masing gas might be misaligned with the central accretion disk. The most straightforward picture consistent with current data would, however, have the masing disk, obscuring torus and any more extended molecular cloud distribution as one coherent accretion structure feeding the central engine, with the ionized thermal and non-thermal radio plasma roughly along the rotation axis.
We have therefore started a program to observe the narrow-line regions (NLR) of all known megamaser galaxies with the Hubble-Space-Telescope (HST) to establish this often suggested link between the molecular disk responsible for the maser emission and the obscuring torus responsible for the ionization cones. We are also obtaining continuum color images to search for the obscuring material directly.
The most luminous known H2O maser source is found in the galaxy TXS2226-184111The name used by Koekemoer et al. (1995) does not follow the suggested and by now accepted convention used later in the Texas survey (Douglas et al. 1996). (IRAS F22265-1826; Koekemoer et al. 1995), at a redshift of z=0.025 (luminosity distance D=101 Mpc for km sec-1 Mpc-1 and ; in the images 01 correspond to 46 pc). Koekemoer et al. (1995) referred to this object as a gigamaser in view of its isotropic luminosity in the 1.3 cm water line of 6100. In this paper, we present H+[N II]6548,6583 and broad-band continuum observations of TXS2226-184, obtained with the HST and the VLA. Our results indeed show a linear H+[N II] structure along the radio axis and perpendicular to a dust lane. This supports the connection between megamaser emission, dusty disk, obscuring torus, and the narrow-line region discussed above. We also classify the host galaxy as a spiral.
2. Observations and Data Reduction
2.1. HST Observations
TXS2226-184 was observed with the Planetary Camera (PC) on board the HST (pixel scale is 00455/pixel) in three filters: F814W (red continuum); F547M (green continuum); and F673N (redshifted H+[N II]6548,6583). The total integration times were 120 sec, 320 sec, and 1200 sec respectively, all exposures being split into two or three integrations to allow cosmic ray rejection. All observations were performed within one orbit on 1998 December 6.
2.2. HST Data Reduction
The images were processed through the standard Wide-Field and Planetary Camera 2 (WFPC2) pipeline data reduction at the Space Telescope Science Institute. Further data reduction was done in IRAF and included: cosmic ray rejection, flux calibration, and rotation to the cardinal orientation. The zero of magnitude for each continuum filter was determined from the HST data handbook in the VEGAMAG222A system in which Vega has magnitude zero in all HST filters. The zero-points of the canonical Johnson-Cousins system differ from the corresponding HST filters by up to 0.02 magnitudes for closely matched filters and up to 0.2 mag for the rest. system. Sometimes we will refer to the red and green continuum filters as I and V, respectively, even though F547M is not a good match to Johnson-Cousins V; an error of 0.2 mag can be expected. For the continuum filters a constant background level was determined in an emission-free region of the PC (to represent sky brightness) and subtracted from the image. This correction is mainly important for obtaining good color information in faint regions. The galaxy continuum near the H+[N II] line was determined by combining the red and green continuum images, scaled to the filter width of F673N and weighted by the relative offset of their mean wavelengths from the redshifted H+[N II] emission. The continuum was then subtracted from the on-band image to obtain an image of H+[N II]. We did not apply any shifts between the images because they were all taken within one orbit and at the same position on the PC chip. From the two broad-band images, we constructed a color map by dividing the green by the red filter image, including only pixels where the flux was at least five times the average noise level in each frame. To increase the signal-to-noise at larger radii, we also computed color maps in which the original image was block averaged by or pixels. Each of these maps was also clipped at its 5 level and sampled at the PC pixel scale. The three maps were then combined, with each image being weighted by its inverse blocking size. This allows one to have a composite color map in which the bright center is shown at full resolution and the outer, low-surface brightness regions (which were clipped in the full resolution map) are seen at lower resolution. This is similar to an unsharp mask technique.
2.3. VLA Observations and Data Reduction
We observed the galaxy with the VLA in A-configuration at 8.46 GHz and 15 GHz on 1999 August 01 in snapshot mode for 5 mins, and at 4.85 GHz on 1998 May 21 for 10 mins. We observed a phase calibrator at the beginning and end of the scan and 3C 48 as a flux density calibrator. Using the AIPS software, the data were self-calibrated and maps were produced.
3. Results
3.1. Radio Map
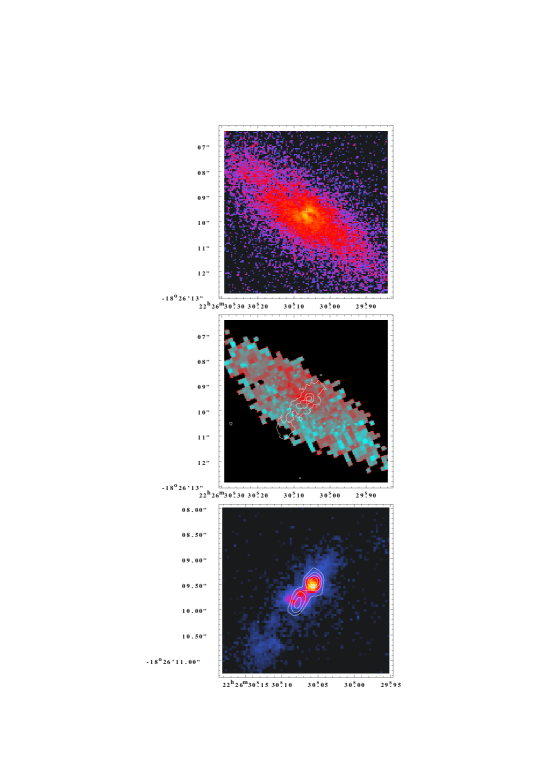
A slightly super-resolved map of TXS 2226-184 at 8.46 GHz using a circular restoring beam of 0.2″ is shown in Figure 1 (bottom) where we have subtracted the central point source to show the extended emission more clearly. The source is resolved with a peak flux density of 15 mJy and a total flux density of 23 mJy. The emission is elongated in PA towards the NW and in PA towards the SE. No further extended emission was detected in our maps. This is also true for lower-resolution maps (VLA C- & B-configuration) at 5 and 8 where the flux densities agree with ours (Golub & Braatz 1998). The total fluxes at 4.85 GHz and 14.94 GHz are 37 and 13 mJy respectively. At these frequencies the source is extended in the same direction as at 8.46 GHz. If we compare our total flux densities with the flux density the galaxy had in the Texas survey at 365 MHz (198 mJy; Douglas et al. 1996), we find the spectrum to be steepening from () between 365 MHz and 4.85 GHz to between 8.46 GHz and 14.94 GHz. Because of the compact structure this steepening is most likely not due to resolution effects. The position of the central radio component is , (B1950).
3.2. HST Images
Our HST images are shown in Figure 1. The continuum map, which is the combination of the red and green filters used also for off-band subtraction, reveals a highly elongated galaxy along PA . The inner region (1″ diameter) is bisected by a dark band, presumably a nuclear dust lane. We have fitted an elliptical Gaussian function to the inner region to locate the centroid of the continuum emission. The centroid thus found is marked with a cross in Fig. 1 and we shall refer to this position as the “nucleus” of the galaxy. It is in the middle of the supposed dust lane. The presence of this dust lane is further strengthened by the color map, which shows a region of high reddening along PA 60∘ extending roughly 1″ across the nucleus. We also see higher reddening on the NW side of the galaxy than on the SE which, for a disk galaxy, would indicate that the NW side is the nearer side of the galaxy disk (Hubble 1943).
The H+[N II] map shows a highly elongated structure roughly along PA , i.e. in the same direction as the radio emission, with a bright spot 02 NW of the supposed nucleus. The emission extends further towards the SE, with a broad, “wiggly” structure near the nucleus and a “plume” 15 from the nucleus. As in the continuum image, the adopted nucleus is not very bright in H+[N II], presumably because of obscuration by the dust lane.
The adopted nucleus in the HST images is within 15—the typical error in absolute HST astrometry—of the radio nucleus. Therefore we have assumed that the optical and radio nuclei coincide and shifted the HST images accordingly (see Falcke et al. 1998 for a discussion of VLA/HST registration and errors). The coordinates given in Fig. 1 are after this shift has been performed.
In the larger field of view of all four WFPC2 chips, we find a number of faint, extended sources around TXS2226-184 which are probably galaxies. In particular, there is a highly elongated galaxy only 172 SW (PA = –120∘) of the nucleus of TXS2226-184 at , (B1950).

3.3. Isophotes and Radial Profile Fitting
We have fitted elliptical isophotes to the red continuum image of the galaxy ignoring the innermost few pixels which are heavily affected by the dust lane. The center was fixed at the adopted nucleus (see Sec. 3.2). The ellipticity is close to zero at , below which it is strongly affected by the dust lane, and approaches a constant value of around 0.6 beyond ″. Similarly, the PA of the semi-major axis changes rapidly from to a value of 65∘ at 05, and stays essentially constant (at 50°-60°) at larger radii. The colors are relatively red in the inner region, dropping from V–I1.65 to around 1.35 at the outer isophotes.
Figure 2 shows the azimuthally averaged surface brightness of the isophotes as a function of . This profile was fitted in IRAF with a) an exponential disk profile,
| (1) |
plus a bulge component (de Vaucouleurs 1948),
| (2) |
to represent a spiral or S0 galaxy, and b) with a bulge component (Eq. 2) only to represent an elliptical galaxy. While the fitting was done using surface brightness, , weighted by the inverse errors, we give the results in the more conventional form of surface brightess (in mag arcsec-2).
For the disk + bulge model (a) we obtained a good fit (reduced ) with the parameters mag arcsec-2, (1.1 kpc), mag arcsec-2, and (0.29 kpc). For a bulge component only (b), i.e. an elliptical galaxy profile, the fit is much worse (reduced ) and at large radii lies consistently above the data (Fig. 2). The parameters we get here are mag arcsec-2 and (10.5 kpc). The results clearly favor a spiral over an elliptical galaxy. The ellipticity of TXS2226-184 ( at 2760) indicates an inclination of the galaxy to the line of sight of 70∘ (using , e.g. Whittle 1992). The details of the fitting depend somewhat on how much of the inner region is excluded, while the preference of a disk + bulge model over a bulge-only model does not.
The difference between the magnitudes of the integrated bulge and the galaxy as a whole in our spiral galaxy model (see Simien & De Vaucouleurs 1986) is if we integrate along elliptical isophotes with . To correct for the inclination dependent absorption (e.g. Tully et al. 1998) we would have to add 0.5 mag to obtain the face-on value of this difference. Figure 2 and Eq. 4 of Simien & De Vaucouleurs (1986) then would formally indicate that TXS2228-184 is probably an Sb/c (RC2 Hubble type 4-5). However, this determination of the relative bulge luminosity and the Hubble type classification is very uncertain. Still, our data should be good enough to indicate that TXS2228-184 is later than S0. The fact that we are measuring at I (Simien & De Vaucouleurs use B) strengthens this point, since one would expect the bulge to be more prominent relative to the disk at I than at B. If we integrate our surface luminosity profile to infinity the total I magnitude of disk and bulge is 15.1 mag. The uncertainty in the cut-off radius due to a low signal-to-noise in the outer isophotes may allow an increase of this value by up to 0.4 mag.
4. Discussion & Summary
Koekemoer et al. (1995) have classified this galaxy as an elliptical or S0 and speculated whether the unusually broad line-width of the megamaser emission seen in this galaxy and in NGC1052 might be typical of elliptical galaxies. Our HST images reveal that TXS2226-184 is almost certainly not an elliptical, so NGC1052 is the only known megamaser in an elliptical galaxy (Braatz, Wilson & Henkel 1994). On the other hand, the high inclination of TXS2226-184 strengthens the tentative conclusion of Braatz, Wilson, & Henkel (1997) that megamasers are preferentially found in highly inclined galaxies. Six out of fourteen spirals in their detected megamaser sample have now an inclination . This excess suggests that nuclear and large scale dust disks in many active spiral galaxies are indeed related.
The NLR in TXS2226-184 is very elongated and reminiscent of the jet-like NLR seen in many Seyfert galaxies, as imaged by HST (e.g. Capetti et al. 1996; Falcke et al. 1998). These gaseous structures are believed to be produced in the interaction between outflowing radio ejecta and the ISM (e.g. Falcke et al. 1998; Ferruit et al. 1999). The fact that our radio map is elongated along exactly the same direction as the NLR supports this view.
In addition to the NLR and radio jet, we find a dust lane in the nucleus which aligns with the galaxy major axis and presumably represents its normal interstellar medium. The elongation of the NLR and the radio source perpendicular to the NE-SW dust lane suggests that the nuclear accretion disk and the obscuring torus are more or less coplanar with the stellar disk in TXS2226-184. Preliminary results of VLBA observations of the masers in this galaxy indeed seem to roughly show a NE-SW orientation along PA 20∘ (Greenhill 1999). How to interpret this structure and whether this indicates a warp in the gas disk going from tens of pc to pc scales is unclear at present. Further VLBI observations of masers and the continuum in this and other maser sources together with HST observations of the host galaxies could help to clarify the nature of the obscuring torus/masing disk and its connection to the large scale molecular gas structure of the AGN host galaxy.
References
- (1) Antonucci, R.J. 1993, ARA&A 31, 473
- Braatz Wilson & Henkel (1994) Braatz, J. A., Wilson, A. S. & Henkel, C. 1994, ApJ, 437, L99
- Braatz Wilson & Henkel (1996) Braatz, J. A., Wilson, A. S. & Henkel, C. 1996, ApJS, 106, 51
- Braatz Wilson & Henkel (1997) Braatz, J. A., Wilson, A. S. & Henkel, C. 1997, ApJS, 110, 321
- Capetti et al. (1996) Capetti, A., Axon, D. J., Macchetto, F., Sparks, W. B. & Boksenberg, A. 1996, ApJ, 469, 554
- (6) de Jong, R.S. 1996a, A&A 313, 45
- (7) de Jong, R.S. 1996b, A&A 313, 377
- (8) de Vaucouleurs, G. 1948, Ann. Astrophys., 11 , 247.
- (9) Douglas, J.N., Bash, F.N., Bozyan, F.A., Torrence, G.W., Wolfe, C. 1996, AJ 111, 1945
- (10) Falcke H., Wilson A.S., Simpson C., Bower G.A. 1996, ApJ 470, L31
- (11) Falcke, H., Wilson, A.S., Simpson, C. 1998, ApJ 502, 199
- (12) Ferruit P., Wilson A.S., Falcke H., Simpson C., Pécontal E., Durret F. 1999, MNRAS, in press
- Golub & Braatz (1998) Golub, J. S. & Braatz, J. A. 1998, American Astronomical Society Meeting, 193, 0612
- (14) Greenhill, L.J., Jiang, D.R., Moran, J.M., Reid, M.J., Lo, K.Y., Claussen, M.J. 1995, ApJ 440, 619
- (15) Greenhill, L.J., 1999, priv. comm.
- Henkel et al. (1998) Henkel, C., Wang, Y. P., Falcke, H., Wilson, A. S. & Braatz, J. A. 1998, A&A, 335, 463
- Herrnstein et al. (1999) Herrnstein, J. R., et al. 1999, Nature, 400, 539
- Hubble (1943) Hubble, E. 1943, ApJ, 97, 112
- (19) Koekemoer, A.M., Henkel, C., Greenhill, L.J., Dey, A., van Breugel, W., Codella, C., Antonucci, R. 1995, Nat 378, 697
- (20) Miyoshi, M., Moran, J.M., Herrnstein, J., Greenhill, L.J., Nakai, N., Diamond, P., Inoue, M. 1995, Nat 373, 127
- (21) Neufeld, D.A., & Maloney, P.R. 1995, ApJ 447, L17
- (22) Pogge, R.W. 1989, ApJ 345, 730
- Simien & De Vaucouleurs (1986) Simien, F. & De Vaucouleurs, G. 1986, ApJ, 302, 564
- Tully et al. (1998) Tully, R. B. , Pierce, M. J., Huang, J. -S. , Saunders, W. , Verheijen, M. A. W. & Witchalls, P. L. 1998, AJ, 115, 2264
- Whittle (1992) Whittle, M. 1992, ApJS, 79, 49
- Wilson & Tsvetanov (1994) Wilson, A. S. & Tsvetanov, Z. I. 1994, AJ, 107, 1227