Massive Star Formation in Galaxies: Radiative transfer models of the UV to mm emission of starburst galaxies.
Abstract
We present illustrative models for the UV to millimeter emission of starburst galaxies which are treated as an ensemble of optically thick giant molecular clouds (GMCs) centrally illuminated by recently formed stars. The models follow the evolution of the GMCs due to the ionization-induced expansion of the HII regions and the evolution of the stellar population within the GMC according to the Bruzual & Charlot stellar population synthesis models. The effect of transiently heated dust grains/PAHs to the radiative transfer, as well as multiple scattering, is taken into account.
The expansion of the HII regions and the formation of a narrow neutral shell naturally explains why the emission from PAHs dominates over that from hot dust in the near to mid-IR, an emerging characteristic of the infrared spectra of starburst galaxies.
The models allow us to relate the observed properties of a galaxy to its age and star formation history. We find that exponentially decaying yrs old bursts can explain the IRAS colours of starburst galaxies. The models are also shown to account satisfactorily for the multiwavelength data on the prototypical starburst galaxy M82 and NGC6090, a starburst galaxy recently observed by ISO. In M82 we find evidence for two bursts separated by yrs. In NGC6090 we find that at least part of the far-IR excess may be due to the age of the burst ( yrs). We also make predictions about the evolution of the luminosity of starbursts at different wavelengths which indicate that far-IR surveys may preferentially detect older starbursts than mid-IR surveys.
keywords:
galaxies: formation HII regions: dust: radiative transfer:1 Introduction
It now looks increasingly clear that the long-sought era of galaxy formation is becoming accessible with a number of observational methods for close scrutiny. These range from optical/ultraviolet studies (Steidel & Hamilton 1992, Lilly et al 1996, Madau et al 1996), mid-infrared (Rowan-Robinson et al 1997 and references therein) and sub-millimeter surveys (Hughes et al 1998). A number of authors have discussed the history of star formation in the Universe which appears to have peaked at a redshift of about 1-3. Estimates like this are, of course, model-dependent as they involve the converion from an observed (usually monochromatic) luminosity density to a star-formation rate. In particular, they depend on the extent and geometry of dust obscuration especially at the shorter wavelengths.
As is well known a large fraction of the power emitted by galaxies (ranging from about 30% in normal galaxies to almost 100% in actively star forming galaxies or starbursts) lies in the infrared part of the spectrum as a result of reprocessing of starlight by dust. Extensive infrared observations of galaxies are therefore necessary in order to describe fully their energy output. With the advent of the Infrared Space Observatory (ISO) the spectra of a number of galaxies in the local Universe have been observed with unprecedented detail in the infrared. They invariably display a variety of absorption/emission features due to dust/molecules. It is clear that radiative transfer calculations in dusty media will be useful for the interpretation of these observations and a development of a better understanding of the origin of the infrared luminosity of galaxies.
Radiative transfer models for the infrared emission of starburst galaxies have been presented before by Rowan-Robinson & Crawford (1989; hereafter RRC), Rowan-Robinson & Efstathiou (1993; hereafter RRE), Krügel & Siebenmorgen (1994; hereafter KS). These models used state of the art codes for calculating the transfer of radiation in dusty media and incorporated a model for the composition and size distribution of grains in the interstellar medium. KS additionally included the effect of transiently heated grains/PAHs and considered the local change of dust temperatures in hot spots around luminous OB stars. The basic assumption of previous starburst models is that a starburst is made up of an ensemble of compact HII regions similar to those found in our galaxy. A number of authors (e.g. Rowan-Robinson 1980, Krügel & Walmsley 1984, Churchwell, Wolfire & Wood 1990, Efstathiou & Rowan-Robinson 1994) studied the infrared properties of different samples of such HII regions and concluded that they could be modelled adequately by spherically symmetric dust clouds surrounding young massive stars.
All of the above models assume that the cloud ensemble in the starburst consists of a number of identical systems. In this paper we present illustrative models for the evolution of giant molecular clouds (GMCs) induced by massive star formation at their centers and calculate their infrared spectra. In the radiative transfer code we use, the effect of transiently heated particles/PAHs as well as classical grains is included. We also follow the evolution of the stellar populations with the models of Bruzual & Charlot (1995). This approach allows us to relate the observed properties of a starburst to its age and its star formation history. We illustrate these models by comparison with the IRAS colours of starburst galaxies as a class and with the multiwavelength data on M82 and NGC6090.
2 A new starburst model
The basic assumption of our model for a starburst galaxy is that star formation takes place primarily within optically thick molecular clouds. This is supported by an array of observational studies (e.g. Elmegreen 1985) which show that molecular clouds are associated with young stars.
The mass of molecular clouds in our Galaxy ranges between with a mass distribution approximately following (Dame et al 1983, Solomon et al 1987). It follows that about of molecular mass is associated with GMCs more massive than . If the mass distribution in a starburst follows a similar form as the Galactic one, and GMCs are at least as likely to be the sites of massive stars as the less massive molecular clouds, then we would expect the bulk of the luminosity of the starburst to arise from GMCs with a fairly narrow range of mass. In fact low-mass molecular clouds, like the nearby Taurus and Ophiuchus clouds, are known to form predominantly low-mass stars.
An indirect argument that massive star formation in galaxies takes place in GMCs with roughly a power-law mass distribution comes from HST observations of starburst galaxies (O’Connell et al 1995, Meurer et al 1995) which reveal a population of super star clusters following a luminosity function of a power-law form . A similar slope is found for systems of young clusters in other galaxies (e.g. Whitmore & Schweizer 1995). This luminosity function is quite unlike that of globular clusters although it has been suggested that it could evolve into one (Meurer et al). In our model these star clusters represent the evolved counterparts of star clusters forming within GMCs, with the mass spectrum given above, after they have dispersed their nascent molecular clouds. It is not clear what the ages of these clusters are because of the known age-reddening degeneracy but in the case of M82 their proximity to the 2 nucleus (see section 4) points towards an age 10Myrs.
In previous studies we assumed that a starburst is an ensemble of identical star forming complexes, which we approximate as spherical. Here we refine this model by considering the fact that, given the starburst takes place over a finite period of time, the star-forming complexes that constitute it are bound to be at different evolutionary stages. We therefore use a simple evolutionary model for HII regions to construct a family of models that predict the infrared spectrum of HII regions as a function of their age.
2.1 The dusty HII region phase
Star formation takes place primarily in the dense cores of GMCs. The details of the physical processes involved are not well understood yet. The efficiency of star formation (or the gas consumption rate) ranges from about in late type spirals to or more in starburst galaxies (Kennicutt 1998).
Once massive stars form they can ionize the surrounding medium and inhibit further star formation. This in itself, however, cannot explain the low star formation efficiency in disk galaxies because it does not explain what determines the number of massive young stars formed initially.
The evolution of GMCs is determined by ionization induced expansion in the early stages ( yrs) and later by stellar winds and supernova explosions. The latter eventually disperse the molecular clouds on timescales of a few times years. Current scenaria of self-propagating star formation (e.g. Larson 1988, Tenorio-Tagle & Bodenheimer 1988, hereafter TTB) hold that molecular cloud formation by a number of mechanisms occurs on a timescale of yrs, to complete the cycle.
The evolution of HII regions due to ionization has been the subject of extensive study both analytically and numerically for a broad variety of circumstances (spherically symmetric case, two-dimensional solutions leading to so-called champagne flows) and is considered to be generally well understood (for a review see Franco et al 1990, TTB).
The presence of a number of massive stars in the centre of a GMC producing numerous ionizing photons leads to the formation, on an extremely short timescale, of the classical HII region with initial Stromgren radius . The pressure in the ionized region, being orders of magnitudes higher than in the rest of the GMC, drives the expansion of the HII region into the surrounding medium. The details of the expansion depend on a number of factors including the density distribution in the medium. Assuming a constant density medium and spherical symmetry, the evolution of the HII region radius can be described by (Spitzer 1978)
| (1) |
where is the sound speed in the ionized gas. is the time since the formation of the initial Stromgren sphere. However, since the timescale for the latter is extremely short we will assume that is the time from the onset of star formation (assumed to take place instantaneously) in the GMC.
The expansion can be broken down into a number of phases, marked by the time when massive stars first move off the main sequence and some recombination occurs ( yrs), a phase of further ionization, and finally total recombination ( yrs) as diminishes. However, throughout expansion and until the supernovae ejecta finally reach the expansion front caused by ionization, equation (1) can be considered to give a reasonable description of the evolution, a fact confirmed by numerical simulations (TTB).
In the simple case of a core of constant density the initial Stromgren radius generated by a compact star cluster producing ionizing photons is given by (Franco et al 1990),
| (2) |
The average densities of GMCs in our Galaxy are in the range to (Dame et al 1983) but their cores, where most of the stars form, have densities three or more orders of magnitude higher. Higher densities are also deduced in more actively star-forming galaxies in accordance with the Schmidt law (Kennicutt 1998). Given the lack of knowledge about , its density distribution, the effect of dust within the HII region and our assumption that all star formation in a given GMC occurs instantaneously on defining , equation (2) provides only a rough estimate of , probably an upper limit.
We use the tables of Bruzual and Charlot (1995) to derive the number of Lyman continuum photons . For a Salpeter IMF and stars in the mass range ,
| (3) |
where is the star formation efficiency.
The molecular cloud radius is related to its mass and average density (initially assumed to be uniform) by
| (4) |
At time , the GMC is essentially divided into three zones. Zone A (inside the dust sublimation radius ) consists of ionized gas and the stellar cluster which is approximated as a point source. In zone B ( ) we have ionized gas and dust, whereas zone C ( ) is the dusty neutral zone.
As the expansion gets under way, the shock wave at , leading the ionization front at , accumulates neutral gas between and . Inside the mass density of the ions follows (Franco et al )
| (5) |
where is the initial mass density of the neutral material assumed to be equal to the initial mass density of the ions. The density inside the HII region is probably constant to a good approximation as the expansion is subsonic (Franco et al ).
The density enhancement and the separation of and cannot be followed analytically. Instead we assume that the neutral gas accumulated in the shock is spread over the entire neutral cloud, and we use the principle of conservation of mass to calculate the (uniform) density of neutral material
| (6) |
Assuming the standard conversion from gas column density to extinction (Savage & Mathis 1979), the visual extinction to the center of the cloud at is given by,
| (7) |
where is the metallicity with respect to solar.
To estimate the evolution of the optical depth of the cloud we assume that the number density of grains scales in the same way as and to get
| (8) |
where takes account of a possible depletion of dust in the HII region as a result of shocks etc.
We will assume that the shock advances into the neutral part of the GMC until the swept up material is half of the original GMC mass. For our assumed uniform density medium this means the advance of the shock stops when
2.2 The supernova phase
The state of the GMC at years is likely to be a narrow neutral shell still expanding, because of the momentum it acquired in the HII phase, at about 10 km s-1. Over the next years supernova explosions are likely to be the main factor that will influence the evolution of the GMCs eventually leading to their dispersal and return of most of the gas to the HI phase.
This phase has also been extensively studied analytically and numerically, but unfortunately mainly for the ‘standard’ density case of 1 cm-3 (TTB and references therein). Most relevant for our purposes is the work of McCray and Kafatos (1987) who presented an analytical solution for the case of multi-supernova explosions in an OB association. Numerical solutions have shown that this solution is an adequate approximation if the supernova explosions are frequent as in our case. The sequence of discrete supernova explosions in the model is replaced by a scaled-up stellar wind solution. The radius of the swept up shell before the hot interior begins to cool at time is given by
| (9) |
where is the total number of stars in the association (with ) that are destined to explode as supernovae , is the energy per supernova (assumed constant) in units of ergs, and is the density of the medium, again assumed to be constant.
After time , given by
| (10) |
the shell expands as
| (11) |
where is the radius reached at .
For a Salpeter IMF and stars in the mass range the Bruzal & Charlot models predict supernova explosions per 1 of stellar mass. So, our adopted parameters for the GMCs in a starburst (, ; see section 3) imply . This, in turn, implies that the supernova shell will remain inside the shell formed by ionization at yrs if the density of the medium within which the supernovae are exploding is higher than . This is not unreasonable given the contributions from stellar winds, failed ‘cores’ etc. in a compact cluster of this mass. The velocity of the supernova shell is also predicted to drop well below the expansion velocity of the neutral shell by yrs.
In this paper we will therefore assume that the supernova shell remains ‘trapped’ inside the neutral shell which continues to expand at 10 km s-1 until yrs. We discuss whether this assumption is inconsistent with infrared observations of galaxies later in the paper.
Our plan in this paper is to use the simple evolutionary scenario outlined in the last two sections and our radiative transfer code in dusty media to predict the infrared properties of evolving HII regions. A further ingredient of our models will be the evolutionary synthesis models of Bruzual & Charlot (1995) which will provide the spectral energy distribution of the evolving stellar population powering the HII region.
The family of evolving HII region models will then form the basis of our starburst models under our assumption that the latter are an ensemble of giant HII regions at different evolutionary stages.
In order to get a first impression of the characteristics of our models we have in this paper confined our attention to the spherically symmetric case. Clearly, highly non-spherical geometries can arise especially at the latter stages of the evolution and we plan to explore these situations in future studies.
2.3 Dust model
The model we have assumed for the absorption/emission properties of the dust is an extension of the ‘classical’ grain model (e.g. Mathis 1990 and references therein) to take into account the effects of small grains and molecules. The model is described in detail in Siebenmorgen & Krügel (1992; hereafter SK92) where it has been shown to account satisfactorily for the emitted spectra of dust in a number of environments (solar neighbourhood, planetary nebulae, star-forming regions).
The model assumes three populations of grains and aims to fit the average interstellar extinction curve subject to the constraints imposed by abundances of heavy elements that are in the solid state etc. The first population of grains consists of the large grains (assumed to have optical properties as the “astronomical” silicates of Draine & Lee 1984 and of amorphous carbon by Edoh 1983). These grains provide the bulk of the emission/absorption at long wavelengths and are responsible for the silicate resonances at 9.7 and 18. The large grains are assumed to have a power-law size distribution (, , 100Å2500Å).
The second population of grains consists of small graphite particles (, , 10Å100Å). These grains are responsible for the 2175Å bump (Draine 1989) and emit primarily in mid-IR wavelengths. Because of their small size they show dramatic fluctuations in temperature. Their emission is calculated with the method of Siebenmorgen et al (1992) which is a faster (but still fairly accurate) alternative to the treatment of Guhathakurta & Draine (1989).
The third grain population is composed of PAHs that are now widely believed to be the carriers of the infrared features at 3.3, 6.2, 7.7, 8.6 and 11.3 (Puget & Leger 1989, Allamandola et al 1989). The SK92 model assumes two components for the PAHs: a single molecule component made up of 25 carbon atoms and a cluster component made up of 10-20 molecules. A ratio of carbon atoms in PAHs to H atoms in the ISM of is assumed (which is about 10% of the total carbon abundance thought to reside in grains/molecules). The PAH clusters dominate at longer (mid-IR) wavelengths and are largely responsible for the quasi-continuum underlying the features (Desert, Boulanger & Puget 1990). The PAHs absorb mainly in the Far UV and to a lesser extent in the visible (SK92).
The PAHs are thought to be dehydrogenated depending on their environment, so a degree of dehydrogenation (defined as the ratio of hydrogen to carbon atoms) needs to be introduced. varies from about 0.4 for the solar neighbourhood to 0.1 or less for star forming regions (SK92). As the emission of some of the features (3.3, 8.6 and 11.3) is proportional to the number of hydrogen atoms and of others (6.2 and 7.7) proportional to the number of carbon atoms, can have an effect on the relative strengths of the features.
In regions of high radiation intensity (such as those to be found in regions of massive star formation or AGN), the small graphites and PAHs are thought to be underabundant with respect to the ISM by factors of 10 or more (SK92, Rowan-Robinson 1992 and references therein). This will result in a flattening of the extinction curve in the UV and an elimination of the 2175Å feature. The latter has been shown to be a characteristic of the extinction curves of starburst galaxies (Gordon, Calzetti & Witt 1997). For the models presented in this paper we assume that all the grains are depleted by a factor of 5 (i.e. ) inside . We further assume that the clusters are made of 500 C atoms and contain of the total C abundance in PAHs. Note that the PAHs abundance is further reduced because of the photo-destruction mechanism that is self-consistently applied in the code (Siebenmorgen 1993).
2.4 Radiative transfer model
The method of solution of the radiative transfer problem in dusty media containing transiently heated grains is described in Efstathiou & Siebenmorgen (1999). The method of obtaining the intensity distribution at any point in the cloud and hence iterating for the temperature of each of the large grains is that used by Efstathiou & Rowan-Robinson (1990, 1995; hereafter ER90, ER95 respectively). The emission of the transiently heated particles is calculated according to the method of Siebenmorgen et al. (1992). Proper treatment of the photodestruction of the PAHs and the sublimation of the large grains, at the inner part of the cloud, is taken into account.
3 Evolving HII region models
There are basically three free parameters in our model (, , and ) which we fix by relating to observational constraints where available.
Kennicutt (1998) finds the median rate of gas consumption in starburst galaxies per years to be . Colbert et al (1998) estimate from ISO spectroscopy that the mass in stars in the M82 starburst is . Assuming the molecular gas mass of estimated from a number of studies (e.g. Hughes et al 1994) is associated with the GMCs that formed those stars, the implied gas consumption rate is 0.2-0.39. In this paper we assume .
For we choose , a mass close to the upper limit of the galactic mass spectrum, as the emission is likely to be dominated by such GMCs (section 2). As a check, we can compare the luminosity expected from one of these GMCs () with that of the 10 knots in M82. Assuming they have the same spectrum as the starburst as a whole, each of these knots has a luminosity of (Telesco & Gezari 1992). By comparison, the models of Bruzual & Charlot () predict for a years old instantaneous burst.
Probably the most uncertain free parameter in our models is the initial GMC average density and the core density . We assume which is within the range of GMC densities found in the centre of the galaxy (Güsten 1989). There is evidence (e.g. RRE, Downes & Solomon 1998) that higher gas densities are to be found in the more extreme starbursts powering ultraluminous infrared galaxies. The core density is assumed to be .
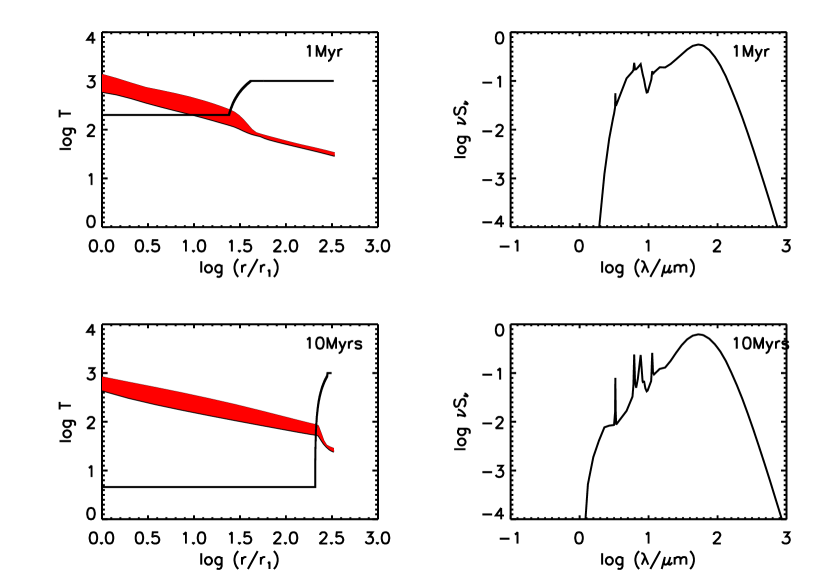
In Figure 1 we plot the density, temperature and spectral energy distributions of a GMC with assumed parameters , and . These parameters are used for the remainder of this paper. The density at the boundary between the neutral and ionized region has been smoothed in order to be able to handle it numerically. The shading in the same diagram represents the spread in temperature between different grain species. Note that the spread is much smaller in the neutral region because it is more optically thick (see Efstathiou & Rowan-Robinson 1994, Krügel & Walmsley 1984 for a discussion of such radiative transfer effects in dust clouds). Our evolutionary scheme predicts that by years the ionization front has compressed the dust to a very narrow shell ().
The SEDs of the GMCs vary significantly with age. In the early stages of the cloud’s evolution its SED is predicted to be warmer and show little signs of PAH emission. This is partly because the stellar population is younger and the radiation field stronger. The main contributing factor though is that there is more hot dust inside the Stromgren sphere than at later times. The weakness of the PAH features is partly due to the stronger near to mid-IR continuum emission from large grains and to the higher degree of photodestruction because of the stronger and harsher radiation field.
By 10Myrs the mid-IR spectrum is dominated by the PAHs features and quasi-continuum and shows the characteristic shape that is observed in the spectra of starburst galaxies (Willner et al 1977, Acosta-Pulido et al 1996). Note that while the general trend is for the dust shell to cool off with time, the expansion of the HII region introduces a subtle effect that somewhat counteracts this in the HII phase. As the neutral shell is pushed out and the density inside declines, the total optical depth to the stellar cluster (eqn 8) decreases. This means that the neutral shell actually heats up a little bit. This effect is better demonstrated by the evolution of the IRAS colours, plotted in Figure 2.
At the peak of the SEDs of the shells shifts to longer wavelengths and become remarkably similar to those of the diffuse medium and cirrus clouds.
The effect of changing the IMF from Salpeter to Miller-Scalo is to reduce by about 80 and by about 20. So the effect on the overall SEDs is small.
4 Evolving starburst models

To synthesize the spectral energy distribution from a burst of star formation from those of individual GMCs, let us assume that at time after the onset of the starburst the star formation rate (or in our case the number of GMCs forming stars instantaneously with efficiency ) is . If we further assume that the ensemble of clouds is optically thin, i.e. they don’t shadow each other, then the flux from the burst is given by
| (12) |
where is the flux from a GMC years after the onset of star formation at its centre.
A useful parameterization for the star formation rate in a starburst which has been extensively used (e.g. Rieke et al 1980, Genzel et al 1998) is that of exponential decay, , where is some time constant. In the limit of large this approximates a scenario of constant star formation history. Under this assumption eqn (12) reduces to
| (13) |
In general, some stellar light will escape the GMC without being absorbed by the dust shell, a situation we can’t address exactly in our present spherically symmetric model. To account for this, but only in the models fitted to M82 and NGC6090, is corrected for this effect by allowing a fraction of the starlight to leak out. The emission from the dust is correspondingly reduced to maintain flux conservation. The leaking starlight may suffer further absorption with the radiation reprocessed to infrared radiation as well. Clearly there are a number of possibilities here. The starlight may be absorbed locally (i.e. the GMC has some kind of anisotropic density distribution, or optically thin holes), or alternatively the starlight escapes the GMC and is absorbed by another GMC or the diffuse medium (KS). In the first case the best approximation would probably be to assume that the starlight is reprocessed to the infrared with the same SED as that of the GMC itself. In the second case it would be better to assume that the starlight is reprocessed according to the SED of the more numerous GMCs with ages of about 40-100Myrs. In this paper, in particular in the models fitted to M82 and NGC6090 in section 6, we consider only the first case. More details on the approximation used in those fits can be found in Appendix A.
5 Comparison with IRAS data
The IRAS data on galaxies have for the last decade or so provided the yardstick by which theoretical models of their infrared emission should be measured. While more extensive datasets are increasingly becoming available with ISO and other projects (e.g. SCUBA), which enable more detailed comparisons (and we illustrate this in the next section for two well studied objects), it is still instructive to compare our models with the IRAS colours.
RRC proposed that the IRAS colours of galaxies can be understood in terms of 3 components: a ‘disc’ component with infrared properties similar to those of cirrus clouds in our Galaxy, a starburst component with properties similar to those of compact galactic HII regions and an AGN component, which is associated with the dusty torus that is now an integral part of the standard AGN model. The latter component is not discussed further in this paper but instead we concentrate on the colours of starburst and Disc galaxies.

In Figure 2 we plot the IRAS colours of the starburst galaxies in the sample of RRC (selected to have good quality fluxes in all four IRAS bands) and indicate the position of their disc component (D). Also indicated in Figure 2 are the positions of M82 and NGC6090 on the colour-colour diagrams. Disc galaxies cover the part of the colour-colour diagram between the starbursts and D, although there is some overlap with the starburst galaxies. RRC proposed that the overlap is due to mixing of the starburst and Disc components. Rowan-Robinson (1992) also showed that some of the variation in the colours of the disc galaxies may be due to the intensity of the radiation field.
If we consider first the predicted colours of the sequence of GMCs (dotted line), we see that they span the entire range of observed galaxy colours. This suggests that a weighted sum of emission from such a family of GMCs (which is what equation (12) essentially is) may explain the observed galaxy colours. To test this we have computed the colours of a galaxy that experienced an exponentially decaying burst with Myrs (solid line). The predicted colours in the age range 0-72Myrs nicely match the spread in the colours of starburst galaxies. Furthermore, they predict a correlation of the 100/60 ratio, and an anticorrelation of the 25/12 one, with age. The predicted mean age of starburst galaxies (Myrs) agrees remarkably well with other estimates from Br equivalent widths and CO indices (Goldader et al 1997) as well as ISO spectroscopy (Genzel et al 1998). The predicted colours are not very sensitive on the assumed value of . The colours for the constant star formation case, a scenario more appropriate for disc galaxies, also lie on the same track but are packed towards the M82 end. This may have significant implications for the origin of the far-IR luminosity of disc galaxies as we discuss further in section 8. The conclusion from this analysis is therefore that the age of the burst can account for some of the variation in IRAS galaxy colours attributed by RRC to mixing with a cirrus component.
There are two more features of the colours of the sequence of GMCs that are worth mentioning. First the discontinuity at is due to the switch from the HII to supernova phase. Clearly, how quickly (and how far) the tracks move to the right of the colour-colour diagrams will depend on the details of the supernova phase which we treat very crudely in this paper. If the supernova ejecta expel the dust further away than we have assumed, then (in the absence of any other heating source) we would expect the dust to cool down further and the 60/25 and 100/60 ratios to increase. The discontinuity in the colours may also be an artifact of our simplified treatment of the GMC evolution. In particular, stellar winds from young stars may impart as much kinetic energy in the ISM as the type II supernovae. Secondly, the apparent ‘retrograde’ motion of the tracks, best seen in the 25/12 versus 60/25 colour-colour diagram, is due to the radiative transfer effect, highlighted in section 3, which leads to the temporary heating up of the dust shell despite the fact that the radiation field is diminishing. The reality of these features can only be assessed by more detailed simulations of the evolution of GMCs.
In Figure 3 we give the SEDs of the starburst discussed above (Myrs) for some representative ages. No correction for leaking starlight is applied to the models. A number of features are worth highlighting: (1) there is a general tendency for the peak of the SED to shift to longer wavelengths with age. (2) The PAH features get stronger with age. (3) the 9.7 silicate feature gets shallower with age. (4) while the optical/UV light of the youngest bursts is almost completely obscured, the oldest starbursts are predicted to emit significantly in the optical/UV. This illustrates the extent to which old diffuse (and therefore optically thin) GMCs dominate the emission of old bursts.
6 A model for M82
6.1 Observational constraints on M82
M82 being the nearest example of a starburst (D=3.25Mpc Tammann & Sandage 1968) has received a lot of attention both observationally and theoretically. The luminosity of the starburst ( Telesco & Harper 1980) is sufficient to outshine any pre-existing stellar population in the nucleus of this dwarf galaxy. The IR luminosity arises mostly in the central 200x400pc region (13” x 26”) which shows a bilobal distribution and is aligned with a central stellar bar. The bar is mainly made up of an old stellar population (Telesco et al 1991) and it is thought that it has probably formed about years ago during the interaction of M81 with M82. Radio interferometry suggests a supernova frequency of 1 every 10-20 years in the central region which implies a high star formation rate (Muxlow et al 1994).
Rieke et al (1980), in their classic study of M82, drew attention to the fact that the starburst emission is spatially correlated at 10-, 20 and radio wavelengths. The emission region constitutes an elongated structure aligned with the major axis of the galaxy. The broad correspondence of the mid-IR emission with the radio was also confirmed by Telesco & Gezari (1992). The map of Telesco & Gezari shows the two prominent peaks seen in earlier observations but their higher spatial resolution also allowed them to resolve a number of clumps with characteristic radii of about 20pc. This provides further confirmation of the basic assumption of our model that the starburst is made of an ensemble of massive GMCs.
Rieke et al also pointed out that the starburst shows a completely different appearance in the K band with the ‘nucleus’ of the galaxy being the prominent feature. There is no 10 feature associated with the nucleus. In the K band there is also extended emission along a stellar bar about a kpc in extent. Rieke et al also found that 2 spectra of the nucleus show the absorption bands characteristic of giants and supergiants. Their interpretation of these findings is that the nucleus represents the first generation of stars formed about yrs ago in an (exponentially decaying) starburst which has since propagated outwards.
Shen & Lo (1995) mapped the CO emission from M82 with 2.5” resolution. Their maps revealed unresolved () structure in the CO emission. They suggest that most of the CO emitting gas (and therefore the starburst) is located in molecular spilar arms at 125 and 390pc from the nucleus. They also resolved the previously known double-peaked structure in several peaks.
The task of utilizing the multiwavelength data for M82 is complicated by the fact that the good spatial and spectral resolution data at the shorter wavelengths can not be exactly matched by the far-IR and submm data. A scan by Telesco & Harper (1980) at 58 (where the spectral energy distribution peaks) shows that the intrinsic source size is about 30” very similar to that at 10. Hughes et al (1994) deconvolved the source size of M82 at various wavelengths. They find that between 10-40 the source size is fairly constant (25x8 arcsec2) but between 100 and 1.3mm it is slightly larger (37x10 arcsec2).
While an IRAS LRS spectrum (with an aperture large enough to include the whole galaxy) is available for M82, because of the importance of the mid and near-IR wavelength range in constraining the model, we use instead the 2-13 spectrophotometry by Willner et al (1977) with a 30” aperture. The 10 spectrum looks similar to that of Roche et al (1991) and Jones & Rodriguez-Espinosa (1984) in a number of positions with 3” which lends further support to the idea that what we see in the central 30” is an ensemble of similar star-forming regions. The IRAS LRS spectrum also shows a similar spectrum although the 10 feature appears a little shallower. The flux in the IRAS LRS spectrum is also about a factor of 2 higher than the spectrum of Willner but also about 50% higher than the broad band 12 point. The 10 growth curves of Rieke et al (1980) also suggest that the total mid-IR flux may be higher than that in the 30” aperture by about 50%. The K band photometry of Rieke in a 30” aperture matches that of Willner et al in a similar aperture rather well. The K flux in the 30” aperture is about 30% of the total (Rieke et al, Ichikawa et al 1995).
In conclusion, the data plotted in Figure 4 are probably a good description of the spectrum of the starburst in M82 but it should be borne in mind that the far-IR and submm data may include contributions from a region more extended than the central starburst. Having experimented with a range of combinations of age and decay time we could not obtain a fit to the multi-wavelength data with a single burst scenario. The fundamental problem with a single burst (in the context of our model) is that M82 shows characteristics for both a young burst (warm SED and fairly deep 10 absorption) and an older burst (strong 1-5 continuum).
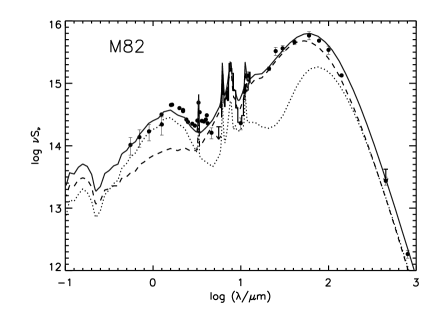
Our model fit, shown in Figure 4, assumes that M82 experienced two bursts of star formation. The first one occured 26.5Myrs ago and had a very steep exponential decay (). This burst is now responsible for most of the K band light and about half of the far-IR and submillimeter emission. The second burst occured 16.5Myrs ago and decayed more slowly (). The GMCs in both bursts are assumed to leak 20 of their starlight after 10Myrs which subsequently suffers a visual extinction of 1.5 magnitudes. The two bursts are predicted to contribute roughly equal amounts of UV flux. The spectrophotometry of Willner et al shows an excess over the model longwards of the 3.3 feature (possibly associated with a quasi-continuum similar to that underlying the longer wavelength features) which we cannot match with our present grain model. Note that while the 10 spectrum of the younger burst provides an excellent fit to the shape of the observed spectrum, the addition of the older burst with its flatter spectrum dilutes the absorption feature. Our model could be in better agreement with the 10 feature and the extended far-IR to submm emission if at least some of the dust shells associated with the older burst have expanded beyond the central 30 arcsec. In fact there is evidence from the map of Hughes et al (1994) that some submm emission is associated with the outflows along the minor axis of the galaxy.
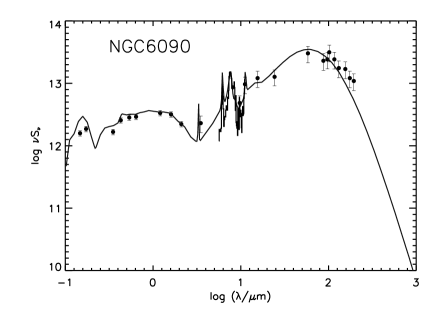
7 A model for NGC6090
Acosta-Pulido et al (1996) presented ISO spectrophotometry and extensive multi-wavelength photometry for NGC6090. This galaxy is about 10 times more luminous than M82 and its optical image shows a disturbed morphology and signs of a recent interaction. UV to K band data for this galaxy are also available (Gordon et al 1997). The IRAS colours of NGC6090 show evidence for cold dust. RRC attributed that to a significant contribution from cirrus in this galaxy. It is therefore not surprising that the emission from an M82 type starburst has to be supplemented by colder dust to fit the data for (Acosta-Pulido et al).
As it is clear from Figure 2, the IRAS colours of NGC6090 predict an ‘old’ burst scenario. In Figure 5 we test this by comparing such a model to the multiwavelength data. We find that a good fit can be obtained with Myrs, Myrs. As in the M82 model we have assumed that after 10Myrs 20 of the starlight from each GMC escapes (and subsequently suffers 1.5mag of visual extinction), but we find that adequate fits to the data can be obtained even if we have no leakage.
The remaining discrepancy between the model and the far-IR observations suggests that some emission from even colder dust in the starburst or general interstellar medium of this galaxy (cirrus) may be contributing at the longer wavelengths. Colder dust in the starburst could for example arise if the supernova explosions are more effective (as we discuss in section 5) in destroying the GMCs and expelling the dust away from the heating sources. Evidence of very cold dust () has been found in some normal galaxies by recent ISO observations (e.g. Krügel et al 1998). The same authors, however, find no evidence for cold dust in the starburst galaxies in their sample. It will be interesting to assess how common is this far-IR excess in starburst galaxies as it will provide strong constraints to theoretical models.
8 Summary and Discussion
We have described an evolutionary scheme for massive GMCs centrally illuminated by a stellar cluster. The defining characteristic of this scheme is that the HII regions formed by the ionizing stellar radiation compress the neutral gas and dust in the GMC to a narrow shell. This naturally explains why the maximum temperature of the large grains in HII regions appears to be lower than the sublimation temperature of the graphite and silicate grains. It also explains why the near to mid-IR spectrum of HII regions and starburst galaxies is dominated by the PAH emission. These trends are consistent with the findings of Helou et al (1998) from ISO mid-IR spectrophotometry. The evolution of the GMC after about yrs is more uncertain but we show that even a modest rate of expansion at the interstellar velocity dispersion is sufficient to lead to the formation of a diffuse cold shell by about yrs. The infrared spectrum of these shells is very similar to infrared cirrus clouds. We associate these shells with the HI superstructures observed in our galaxy and other galaxies (Heiles 1979) and usually associated with large star clusters.
The sequence of GMC spectral energy distributions we have computed cover the range of observed galaxy SEDs as observed by IRAS. This leads us to believe that the observed spectra of galaxies could be modelled in terms of this evolutionary scheme and constrain their star formation history. Exponentially decaying bursts are shown to account satisfactorily for the colours of starburst galaxies in the sample of RRC. The age of the burst is shown to be an important contributing factor to the spread in the galaxy colours and can mimick (to some extent) the effect of mixing with a cirrus component. Our application of these models to M82 and NGC6090 has shown that good fits to the UV to mm data on these galaxies can be obtained with the models. In M82 we find evidence for two bursts separated by 10Myrs. Our model is similar in this respect to that of Rieke et al (1993) who find that two Gaussian bursts (separated by 8-25Myrs) can account for a range of observational constraints. Theoretical support for this periodic burst scenario is also provided by the models of Krügel & Tutukov (1993). NGC6090 is best fitted by an older burst (64Myrs). There is evidence for a colder dust component in this galaxy. It is not clear whether that is due to cirrus or colder dust in the starburst.
The colours predicted for a continuous star formation scenario, one more appropriate for disc galaxies, falls short of explaining the colours of disc galaxies. Although a more thorough exploration of the parameter space is needed before any definite conclusions can be drawn, this result is not entirely surprising for the following reason. In starburst galaxies, almost by definition, the emission from the recently formed stars outshines the old stellar population so the effect of the latter on our models is probably not very significant. In disc galaxies, however, where the star formation rate is lower, the old stellar population is more important and needs to be taken into account when considering the energy balance and emission of GMCs, especially the older ones. The effect of this would be, neglecting any change in the spectral shape, to boost the luminosity of the old GMCs and therefore their contribution to the overall galaxy emission. This provides an indirect argument in favour of the idea that old stars make a significant contribution to the far-IR luminosity of disc galaxies (Waltebros & Greenwalt 1996).
The wealth of data on M82 allows us to apply further checks on the validity of this model. O’Connell et al (1995) imaged the central few hundred parsecs of M82 with the HST in the V and I bands and discovered a complex of over 100 luminous star clusters. The clusters do not seem to be associated with X-rays, infrared or radio compact sources but instead with the less obscured regions in the galaxy such as the ‘nucleus’ and the periphery of the dust lane. The size of these clusters is estimated to be about 3pc, consistent with being the remnants of the GMCs in our model for the starburst. The fact that M82 is viewed almost edge-on complicates somewhat the interpretation of these observations but the (at least) partial segregation of the optical and infrared emitting regions suggests that they arise from stellar populations at different evolutionary stages, as in our model. This also suggests that the assumption of spherical symmetry is reasonable at least for the young (Myrs) GMCs.
Satyapal et al (1997) studied the stellar clusters in the central 500pc of M82 with near-IR spectroscopy and high resolution imaging. Their findings support a picture in which the typical age of the stellar clusters is yrs. They also find a correlation between the age of the clusters and distance from the centre suggesting that the starburst is propagating outwards at a speed of about 50km/s. This picture is also supported by spectro-imaging of M82 at 3.3 which shows evidence for dissociation of PAH molecules in the ‘nucleus’ (Normand et al 1995). McLeod et al (1993) also found that the 3.3 feature is about twice as strong at a position offset by about 8” from the nucleus. The centre of M82 has been known for some time (Axon & Taylor 1978) to show evidence for a biconical outflow along its minor axis. This is now widely believed to be due to a galactic wind, a general characteristic of starburst galaxies, powered by stellar winds and supernovae. Numerical hydrodynamic simulations (Suchkov et al 1994) suggest that such outflows can develop under quite general conditions at the center of starbursts but their morphology depends very much on the energy deposition rate and density of the medium. It is likely that the galactic wind was powered by the earlier burst and that the interaction of the wind with gas in the plane of the galaxy triggered or at least contributed to the outwardly propagating secondary burst.
Telesco & Gezari (1992) noted that there is no correspondence between the peaks of the radio emission in M82 (presumed to be young supernova remnants) and those at 12.4. This suggests that the mid-IR peaks in M82 are associated with GMCs in which supernova activity has not yet started or in which the supernova rate is still very low. This observation is in excellent agreement with our M82 model in which the mid-IR emission is predominantly due to the younger burst.

As is evident from Figure 3 the luminosity of a starburst galaxy is predicted to change quite considerably with age. We illustrate this more clearly in Figure 6 where we plot the luminosity at different IRAS wavelengths (normalized to its peak) as a function of age for the same model parameters used in Figure 3 (). The luminosity rises sharply in the first 10Myrs to peak at an age which depends on the wavelength. It then declines sharply by up to a factor of 5 with age. We have omitted the 25 curve as it is very similar to that at 60. There are a number of interesting implications arising from this result for the detectability of starburst galaxies. It implies for example that mid-IR surveys would preferentially detect younger starbursts than far-IR surveys. It also implies that near the detection limit of such surveys up to half the galaxies that experienced a burst in the last years may be missed because they are either too young or too old. This may have implications for estimates of the star formation rate over volumes of space as it introduces another form of bias.
In conclusion, the evolutionary scheme we have put forward in this paper seems to be in very good agreement with an array of observational evidence on M82 and is consistent with the infrared properties of other starburst galaxies. It promises to be useful for the interpretation of the growing datasets on infrared galaxies and we plan such studies in future work. The scheme also lends itself for incorporation into simulations of galaxy formation and evolution and this was one of the prime motivations for its development.
While useful constraints on the star formation history and stellar populations of galaxies can be obtained from this model, it will be of much interest to explore in the future the effect of deviations from spherical symmetry especially at the later stages of GMC evolution. Hydrodynamical simulations of the evolution of star-forming molecular clouds which take into account the effects of ionization, stellar winds and multi-supernova explosions in dense environments should also take high priority. Only then will we be able to take full advantage of the data ISO, SCUBA, WIRE, SIRTF, NGST, VLT, FIRST, PLANCK, SOFIA, ALMA etc. are expected to yield over the next decade or so.
Acknowledgments
AE acknowledges support by PPARC. This work has made use of the NASA Extragalactic Database (NED). We thank an anonymous referee for useful comments and suggestions.
Conclusions
References
- [1] Acosta-Pulido, J.A., et al., 1996, AA, 315, 121.
- [2] Allamandola, L.J., Tielens, A.G.G.M., Barker, J.R., 1989, ApJS, 71, 733.
- [3] Axon, D.J., & Taylor, K., 1978, Nature, 274, 37.
- [4] Bruzual, A & Charlot, S., GISSEL user guide, unpublished.
- [5] Churchwell, E., Wolfire, M.G., Wood, D.O.S., 1990, ApJ, 354, 247.
- [6] Colbert, J.W., et al, 1998, astro-ph/9810188.
- [7] Dame, , T.M., Elmegreen, B.G., Cohen, R.S., & Thaddeus, P., ApJ, 305, 892.
- [8] Desert, F.-X., Boulanger, F., Puget, J.L., 1990, AA, 237, 215.
- [9] Downes, D., Solomon, P.M., 1998, ApJ, 507, 615.
- [10] Draine, B.T., Lee, H.M., 1984, ApJ, 285, 89.
- [11] Draine, B.T., 1989, ApJ, IAU Symposium 135, 313.
- [12] Edoh, O., 1983, Ph.D. thesis, Univ. of Arizona.
- [13] Efstathiou, A., Rowan-Robinson, M., 1990, MN, 245, 275.
- [14] Efstathiou, A., Rowan-Robinson, M., 1994, MN, 266, 212.
- [15] Efstathiou, A., Rowan-Robinson, M., 1995, MN, 273, 649.
- [16] Efstathiou, A., Siebenmorgen, R., 1999, in preparation.
- [17] Elmegreen, B.G., 1985, in Protostar and Planets II, p.33-58.
- [18] Franco, J., Tenorio-Tagle, G., Bodenheimer, P., 1990, ApJ, 349, 126.
- [19] Genzel, R., et al 1998, ApJ, 498, 579.
- [20] Goldader, J.D., Joseph, R.D., Doyon, R., Sanders, D.B., 1997, ApJ, 474, 104.
- [21] Gordon, K.D., Calzetti, D., & Witt, A.N., 1997, ApJ, 487, 625.
- [22] Guhathakurta, P., Draine, B.T., 1989, ApJ, 345, 230.
- [23] Güsten, R., 1989, in IAU Symposium 136, The Center of the Galaxy, ed.M.Morris, Dordrecht(Reidel), p.89.
- [24] Heiles, C., 1979, ApJ, 229, 533.
- [25] Helou, G., et al, 1998, In ‘Astrophysics with Infrared Surveys: A prelude to SIRTF’, ed.M.Bicay, in press.
- [26] Hughes, D.H., Gear, W.K., & Robson, E.I., 1994, MNRAS, 270, 641.
- [27] Hughes, D., et al 1998, Nature, 394, 241.
- [28] Ichikawa, T., Yanagisawa, K., Itoh, N., Tarusawa, K., van Driel, W., Ueno, M. 1995, AJ, 109, 2038.
- [29] Johnson, H.L., 1966, ApJ, 143, 187.
- [30] Jones, B., & Rodriguez-Espinosa, J.M., 1984, ApJ, 285, 580.
- [31] Kennicutt, R.C., 1998, ApJ, 498, 541.
- [32] Krügel, E., & Walmsley, C.M., 1984, AA, 130, 5.
- [33] Krügel, E., Siebenmorgen, R., 1994, AA, 282, 407. (KS)
- [34] Krügel, E., Tutukov, A.V., 1993, AA, 275, 416.
- [35] Krügel, E., Siebenmorgen R., Zota, V., Chini, R., 1998, AA, 331, L9.
- [36] Larson, R.B., 1988, In ’Galactic and Extragalactic star formation’, eds. R.E.Pudritz, M.Fich. Dordrecht:Kluwer.
- [37] Lilly, S.J., Le Fevre, O., Hammer, F., & Crampton, D., 1996, ApJ, 460, L1.
- [38] Madau, P., Ferguson, H.C., Dickinson, M.E., Giavalisco, M., Steidel, C.C., Fruchter, A., 1996, MNRAS, 283, 1388.
- [39] Mathis, J.S., 1990, ARAA, 28, 37.
- [40] McCray, R., & Kafatos, M., 1987, ApJ, 317, 190.
- [41] McCleod, K.K., Rieke, G.H., Rieke, M.J., Kelly, D.M., 1993, ApJ, 412, 111.
- [42] Meurer, G.R., Heckman, T.M., Leitherer, C., Kinney, A., Robert, C., Garnett, D.R., 1995, AJ, 110, 2665.
- [43] Muxlow, T.W.B., Pedlar, A., Wilkinson, P.N., Axon, D.J., Sanders, E.M., De Bruyn, A.G., 1994, MNRAS, 266, 455.
- [44] Normand, P., Rouan, D., Lacombe, F., Tiphene, D., 1995, AA, 297, 311
- [45] O’Connell, R.W., Gallagher III, J.S., Hunter, D.A., Colley, W.N., 1995, ApJ, 446, L1.
- [46] Pearson, C., Rowan-Robinson, M., 1996, MN 283, 174
- [47] Puget, J.L., Leger, A., 1989, ARAA, 27, 161.
- [48] Rieke, G.H., Lebofsky, M.J., Thompson, R.I., Low, F.J., Tokunaga, A.T., 1980, ApJ, 238, 24.
- [49] Roche, P.F., Aitken, D.K., Smith, C.H., Ward, M.J., 1991, MN, 248, 606.
- [50] Rowan-Robinson, M., 1980, ApJS, 44, 403.
- [51] Rowan-Robinson, M., 1992, MN 258, 787
- [52] Rowan-Robinson, M., Crawford, J., 1989, MN 238, 523. (RRC)
- [53] Rowan-Robinson, M., Efstathiou, A., 1993, MN 263, 675. (RRE)
- [54] Rowan-Robinson, M., et al 1997, MN, 289, 490.
- [55] Satyapal, S., Watson, D.M., Pipher, J.L., Forrest, W.J., Greenhouse, M.A., Smith, H.A., Fischer, J., Woodward, C.E., 1997, ApJ, 483, 148.
- [56] Savage, B.D., & Mathis, J.S., 1979, ARAA, 17, 73.
- [57] Shen & Lo, 1995, ApJ, 445, L99.
- [58] Spitzer, L., 1978, ‘Physical Processes in the interstellar medium’, Wiley-Interscience.
- [59] Suchkov, A.A., Balsara, D.S., Heckman, T.M., Leitherer, C., 1994, ApJ, 430, 511.
- [60] Siebenmorgen, R., Krügel, E., 1992, AA, 259, 614. (SK92)
- [61] Siebenmorgen, R., Krügel, E., Mathis, J.S., 1992, AA, 266, 501.
- [62] Siebenmorgen, R., 1993, ApJ, 408, 218.
- [63] Steidel, C.C., Hamilton, D., 1992, AJ, 104, 104.
- [64] Solomon, P.M., Rivolo, A.R., Barrett, J., & Yahil, A., 1987, ApJ, 322, 101.
- [65] Tammann, G.A., & Sandage, A., 1968, ApJ, 151, 825.
- [66] Telesco, C.M., & Harper, D.A., 1980, ApJ, 235, 392.
- [67] Telesco, C.M., Joy, M., Dietz, K., Decher, R., Campins, H., 1991, ApJ, 369, 135.
- [68] Telesco, C.M., & Gezari, D.Y., 1992, ApJ, 395, 461.
- [69] Tenorio-Tagle, G., & Bodenheimer, P., 1988, ARAA, 26,145.
- [70] Waltebros, R.M., & Greenwalt, B., 1996, ApJ, 460, 696.
- [71] Whitmore, B.C., & Schweizer, F., 1995, AJ, 109, 960.
- [72] Willner, S.P., Soifer, B.T., Russell, R.W., Joyce, R.R., Gillett, F.C., 1977, ApJ, 217, L121.
APPENDIX: Corrections for non-spherical geometry
Let the monochromatic luminosity of a spherical GMC of optical depth (centrally illuminated by a stellar cluster) at frequency be whereas that of the stellar cluster (in the absence of any dust) be . By definition, . If the optical depth of the GMC is for a fraction of the sky centred on the star cluster, then the luminosity of such a non-spherical GMC can be approximated by,
where is the dust extinction cross-section at frequency .
The first term assumes that the GMC emits isotropically with the same spectral energy distribution as the spherical GMC. The factor , however, accounts for the fact that a fraction of the sky is covered by a lower (or even zero) optical depth. The remaining two terms attempt to correct for this complication. The second term gives the stelar light that is transmitted through the optically thin holes. The third term assumes that the light absorbed by dust in the optically thin holes is reprocessed to the infrared with the same spectral energy distribution as that of the spherical GMC.
If a large number of non-spherical, but otherwise identical, GMCs viewed at different orientations are present in a starburst, then in equations 12 and 13 one can use their average emission . While this approximation conserves energy and is probably close to the best one can do for correcting for non-spherical geometry, without doing the actual calculation, its usefulness is bound to be limited as some of the assumptions (e.g. isotropic emission from a non-spherical optically thick system) are known to be false (e.g. Efstathiou & Rowan-Robinson 1995).