Age dating old globular clusters in early-type galaxies
Abstract
Various methods for age dating globular clusters in ellipticals are presented. We first present spectroscopy of individual globular clusters (feasible with the advent of the 10m-class telescopes), and the measurement of Balmer line indices. Second, we discuss the photometry of globular cluster sub-populations and the mean age determination by comparison with population synthesis models. The first method is time consuming but precise once spectra with high enough signal to noise are obtained. One caveat, however, is the definition of the Balmer line indices that often include metal features and are themselves not independent of metallicity. The second method requires the measurement of two photometric quantities that depend differently from age and metallicity. The combination of both allows to break the age-metallicity degeneracy present in broad-band colors. Near-infrared colors can strongly complement the optical studies in this respect.
Overall it is, however, true that the older a star cluster, the harder it is to determine its precise age. Population synthesis models also need to be further improved, and the models compared here show significant differences.
European Southern Observatory, Karl-Schwarzschild-Str. 2, D-85748 Garching, Germany
1. Introduction

Globular clusters can be old. Very old. Sometimes older than the universe. This is then referred to as a cosmological paradox, and it indicates that you are using wrong values for your favorite cosmological parameters. But how old are they really and why do we care?
Age dating old stellar populations has never been trivial, but crucial for our understanding of the universe. For example, the ages of Galactic globular clusters are still the reference for the age of the universe. This aspect of the problem was recently discussed in several reviews (e.g. Salaris, Degl’innocenti, & Weiss 1997; Sarajedini, Chaboyer & Demarque 1999 and references therein, see also Weiss et al. in these proceedings).
Here, we would like to present the current methods (from a purely observational point of view) to determine ages of star clusters in galaxies beyond the Local group. In other words: how to determine ages from the integrated light of star clusters. These ages are used to date the major epochs of star formation in the host galaxies, and thus to constrain the formation history of these same galaxies.
The next section presents age determinations from spectroscopy, with its advantages and problems. In section 3, we present photometric methods to derive relative ages of populations, and their caveats. A few concluding remarks are given in Section 4.
2. Spectroscopy
Spectroscopy of the integrated light of globular clusters allows the age determinations of individual clusters by measuring various absorption line indices in their spectra. The faint magnitudes of the objects prohibit high-resolution spectroscopy. Furthermore, one would like to compare the results with older/other ones, i.e. use a ‘standard’ system (e.g. the Lick indices) which were measured on low-resolution spectra (6Å to 9Å resolution) in the wavelength range typically ranging from 3800Å to 6500Å, sometimes including the Ca triplet around 8500Å.
2.1. The real life
In order to spectroscopy globular clusters, one needs to identify them in the first place. Therefore, each spectroscopic survey must be preceeded by a photometric one. All studies are still contaminated to some extend by foreground stars (mainly M stars) and compact background galaxies at low redshift. Out to a distance of 30–40 Mpc the globular clusters can be (barely) resolved with WFPC2 on HST, which is currently the best method to prevent contamination by foreground stars, when associated with a color selection. However, HST photometry is usually available for a small field only. Multi-color, wide-field photometry, especially over a large color baseline, can select out background galaxies efficiently. Current studies that use both these methods to select their globular cluster candidates have typical contamination rates of less than 10%–20%. Further, the advent of 10m-class telescope allow the spectroscopy of fainter objects, i.e. the choice of “secure” globular candidates within the spectroscopic field increased significantly, making the modern studies even more efficient.
Still, the method is time consuming: typical exposure times to get a useful signal-to-noise to derive ages are around 2–3h, even with 10m-class telescopes. Also, the current multiplexity of FORS 1&2 (VLT) and LRIS (Keck) is low with around 20–30 candidates per set-up. Instruments such as VIMOS (VLT) and DEIMOS (Keck) with a multiplexity of around 100–150 objects/set-up will significantly improve the efficiencies of such studies.

Once spectra are obtained, absorption line indices are measured. In order to compare these with existing population synthesis models, one uses a standard system of absorption line indices. This standard system was implicitly adopted to be the Lick system (see Trager 1998 for the latest update), in which a large number of early-type galaxies (and globular clusters) were originally measured. The index measurement of Balmer lines are finally compared to population synthesis models and the ages are derived.
2.2. Problems and accuracy
The last sentence is overly optimistic and hides many problems, some of which are illustrated in Fig. 2. First, H is the index mainly used to derive ages. This line index is not a pure age indicator but also sensitive to metallicity (half as much as it is sensitive to age, see Worthey 1994). This is illustrated in Fig. 2 by the Milky Way data which are roughly coeval and should lie on a horizontal line if H was a perfect age indicator. In contrast, they describe an almost vertical feature at low metallicities. This is the reason why, in order to determine ages, H is generally plotted against a very metal-sensitive feature (here Mg2) to understand and take into account the metallicity contribution to H. Ideally, an age sensitive feature would mainly probe the turn-over in the Herzsprung-Russel diagram. Unfortunately, H is very sensitive to blue horizontal branches too. This is especially a problem in metal-poor population (typically exhibiting an extended horizontal branch), but could also falsify result in metal-rich population hosting blue horizontal branch stars. H is therefore sensitive to some extend to the second parameter effect. We note here that Worthey (1994) did not include any blue horizontal branches in his models. Finally, H can be contaminated by line emission, although this is less of a concern in the case of old globular clusters but rather for galaxies with some recent star formation. And last it should be noticed that the “narrow” definition of H is not well suited to measure the broad Balmer lines of young population.
The second big practical problem is the accuracy with which H is currently measured. Figure 2 illustrates that current typical errors for distant globular clusters are of the order of a factor 2 in age. Spectra with higher signal-to-noise must be obtained. Previous studies were either limited by the telescope size, or by the blue response of the used CCDs, or simply optimized for metallicity measurements between 5000Å and 6000Å. Future studies must concentrate on getting enough signal-to-noise below 5000Å which is feasible with the advent of 10m-class telescopes. Also, if the goal is to get a relative age difference between sub-populations of (rather than individual) globular clusters, the measurement of enough representative clusters currently allows a determination to within 2–3 Gyr.
The third problem, already mentioned, is the models to which the data are compared. Current population synthesis models do not agree on the absolute ages derived from line indices. Worse, they also influence the relative ages: i.e. the spacing between the different isochrones in Fig. 2 varies from model to model.
The three points above should make clear that in order to get relative ages between individual clusters or cluster sub-populations one needs to work on the following points. Other age sensitive features should be used (e.g. higher-order Balmer lines) with a new definition of the indices, perhaps at higher resolution, in order to avoid metal lines in the definition of the bands. These features need to be measured with a higher signal-to-noise than is currently done. And finally, the population synthesis models need to be brought in agreement with each other.
3. Photometry
Spectroscopy being extremely time consuming, ways of measuring ages for old globular clusters from photometry were explored.
3.1. The basic idea
Broad-band colors suffer from the well known age-metallicity degeneracy. That is: younger ages can be compensates by higher metallicities. The goal is therefore to find two photometric quantities that depend differently on age and on metallicity in order to break the degeneracy. Broad-band colors at old ages are all much more metallicity sensitive than they are age sensitive, and any combination (from UV to VK) plotted against each other is unable to separate ages.
A solution to this problem was to combine a color with a magnitude. Colors are, as mentioned above, metallicity sensitive, while magnitudes are rather age sensitive. Plotting the one against the other breaks the age-metallicity degeneracy and allows the determination of relative ages.
3.2. Some results and caveats
As for spectroscopy, this method sounds easier than it is in reality. First, the individual magnitudes depend of course primarily on the mass of the globular clusters. The masses being unknown or dependent on the exact distance, mass-to-light ratio etc… this method cannot be applied to individual clusters. However, one can determine a mean color and a “mean” magnitude for a globular cluster population. The mean color is just the peak of the color distribution of the cluster population. The “mean” magnitude is taken to be the turn-over magnitude of the luminosity function, corresponding to the characteristic mass of the cluster population (see Kissler-Patig; Miller; Fritze-von Alvensleben; McLaughlin, all in these proceedings).
The exact value of this characteristic mass is unknown to within 10%–20%, and usually the distance to the objects is uncertain by a similar amount, so that absolute ages cannot be derived. The method remains, however, useful to compare the ages of different sub-populations (e.g. the case of NGC 4472 by Puzia et al. 1999). One assumption is that both sub-population have the same characteristic mass implying that color and magnitude depend on age and metallicity only. This assumption seems supported by current theory and observations (see above reference) but can also be checked by comparing the age difference between the sub-populations, derived from various filter combinations. The results from various bands will only agree if the quantities are indeed only dependent on age and metallicity (fully taken into account by the models), and systematic differences will appear if the characteristic masses of the two compared populations differ.
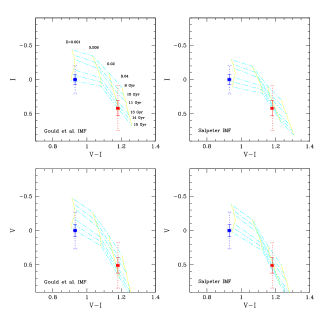
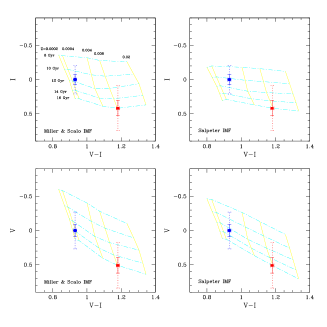
Figure 3 illustrates the method. It compares the result derived with respect to two different population synthesis models. As the error bars illustrate, it is rather easy to derive a mean color for a sub-population, however the “mean” magnitude is much harder to measure and requires a large sample of clusters with good photometry and knowledge of the finding incompleteness as a function of cluster magnitude and background luminosity. In this case, the relative age between the two populations can be derived to within 1-2 Gyr. Note, however, that even the age difference depends on the population synthesis models used for the comparison. We picked two extreme cases that illustrate that the uncertainties in the models do not allow a determination of the relative ages to better than 3-4 Gyr. In one case the luminosity is, still in the I band, dependent on metallicity, while in the other case such a dependence exist in the V band but disappears in the I band (as seen from the almost horizontal isochrones). The consequence is, that for the second model (Worthey 1994) the results from the V band indicate that only a marginal difference in age exists between the metal-poor and metal-rich clusters, while the results in the I band seem to favor an older metal-rich population.
Overall, the comparison (taken from Puzia et al. 1999) supports coeval metal-poor and metal-rich populations to within the uncertainties (3-4 Gyr). Similar, perhaps a little less rigorous, studies came to comparable conclusions. Kissler-Patig et al. (1997) found the two sub-populations in NGC 1380 to be coeval with weak evidence that the metal-rich population might be 3-4 Gyr younger. Kundu et al. (1998) find a metal-rich population younger by 3-6 Gyr than the metal-poor population in M 87.
4. Concluding remarks
If there is one thing to remember: getting ages of old globular clusters from integrated properties is tough! But it can be done. And although the current methods still have limits, there is good hope that in the near future we will be able to get relative ages of individual clusters to within 2-3 Gyr, and relative ages between groups of clusters to within 1–2 Gyr. Differences in the models currently limit the accuracy with which relative ages can be determined to 3–4 Gyr. Absolute ages await an agreement between the different stellar population models (including a better knowledge of stellar evolution), and is probably to be expected at earliest in a decade.
When individual ages are required, spectroscopy is the only possible method. However, for relative ages of entire populations, photometry can be used. The latter will also allow to determine relative differences in the characteristic mass between cluster sub-population.
Acknowledgments.
I would like to thank the organizers and in particular Ariane Lançon for initiating and organizing such a pleasant meeting. Special thanks to Claudia Maraston for her patience in trying to convey some of her expert knowledge on population synthesis models to a dum observer, and for her plot. Thanks also to Thomas Puzia, responsible for the figures in the photometry section.
References
Kissler-Patig, M., Richtler, T., Storm, J., & Della Valle, M. 1997, A&A, 327, 503
Kundu, A., Whitmore B.C., Sparks, W.B. et al. 1999, ApJ, 513, 733
Maraston, C. 1998, MNRAS, 300, 872 (and electronic updates)
Puzia, T.H., Kissler-Patig, M., Brodie, J.P., & Huchra, J.P. 1999, AJ December
Salaris, M., Degl’innocenti, S., & Weiss, A. 1997, ApJ, 479, 665
Sarajedini, A., Chaboyer, B., & Demarque, P. 1997, PASP, 109, 1321
Trager, S.C. 1998, PhD thesis, Santa Cruz, CA
Worthey, G. 1994, ApJS, 95, 107 (and electronic updates)
Discussion
B.Miller: How does Washington photometry compare to other bands for determining metallicities of old globular clusters?
M.Kissler-Patig: Washington photometry uses the C (somewhere between U and B) and T1 ( R) bands to derive metallicities. It is more sensitive to metallicity than BI, the most sensitive combination of Johnson-Cousins bands, but it is less sensitive than VK. However, it has the advantage over the latter that it can be obtained with a single instrument.
J.C.Mermillod: What is the population producing the H line, turn-off dwarfs, blue horizontal-branch stars, or blue stragglers?
M.Kissler-Patig: All of the above. H is located at 4800Å. Ideally, you would like it to be dominated by turn-off dwarfs, but especially for metal-poor populations, the horizontal branch is a significant contributor. I don’t think that blue stragglers contribute significantly unless you have a very large population of these, but their represent a uncertainty factor also.
J.Gallagher: I am also concerned about the ability to separate age and metallicity well enough to be able to say with certainty that the blue and red clusters are coeval. My problem is that one can get very similar distributions of stars on a theoretical CMD at different ages – including luminosities – which could lead to increased uncertainties in relative ages of cluster groups.
M.Kissler-Patig: Indeed, the problem you state is a concern. However, I think that several points save you from making too large errors. The first one is, that we are “averaging” over hundreds of clusters (i.e. CMDs) and are not very sensitive to peculiar effects in the one or the other clusters (such as weird horizontal-branches etc…). Second we are starting to use a wide range of colors, probing very different regions of the CMD (e.g. the K band will hardly be sensitive the turn-over region or the horizontal-branch morphology, while the B band will). We should therefore see unexpected difference between the bands when compared to the models, if the CMDs differ a lot from the model predictions. This whole business reduces then to model uncertainties that are present to some extend as mentioned, but do not disqualify the method as such, nor the results that the populations are coeval within a few Gyr.