Reconstruction of emission sites in the dwarf nova EX Draconis††thanks: Based on observations obtained at the German-Spanish Astronomical Center, Calar Alto, Spain and at Wendelstein Observatory, Germany.
Abstract
We performed time–resolved spectroscopic studies of the double–eclipsing dwarf nova EX Dra (formerly HS 1804 + 6753) in order to locate line emitting sites in the system. Optical spectra recorded during the quiescent as well as during the outburst state have been analysed by means of Doppler tomography. The computed Doppler images map the system in a variety of emission lines and allow us to compare between different temperatures and accretion states.
Our studies revealed that the Balmer and He i emission of EX Dra during quiescence is mainly formed within a fully established disk and within the gas stream. The Doppler map of Hα shows a second emission spot in the accretion disk located far from the region of interaction between the gas stream and the accretion disk.
We have found a weak hint that secondary star emission contributes to the Hα line in quiescence, obviously caused by photospheric heating due to irradiation by the primary component. During outburst secondary star emission turns into a very strong emission source in the Balmer lines due to the increased accretion rate and an enhanced irradiation by the white dwarf or the boundary layer. The Doppler maps of the Balmer and He i lines during outburst further show emission from the accretion disk. During outburst the gas stream is rarely seen in the Balmer lines but clearly visible in He i and shows that the disk radius during this high accretion state is about 0.2 RL1 larger than during the recorded quiescent state.
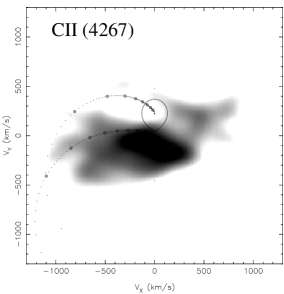
The origin of the C ii ( 4267 Å) line, which is only detectable during eruption can be located by Doppler imaging close to the primary component and may therefore be formed in the chromosphere of the white dwarf.
Key Words.:
stars: cataclysmic variables – accretion disks – stars: individual: EX Dra (formerly HS 1804 + 6753)1 Introduction
The cataclysmic variable EX Dra (formerly HS~1804 + 6753), was first detected in the Hamburger Quasar Survey in 1989 (Reimers D., 1991, private comm.). In the course of follow-up observations the system turned out to be a double-eclipsing dwarf nova of the U Gem class with a quiescence magnitude of about 14m, a relatively small outburst amplitude of 1m–2.3m and an orbital period of 5.04 h (Barwig et al. (1993)).
Up to now two different approaches have been made to analyse this binary system. Billington et al. (1996) undertook spectroscopic observations of the red part of the optical wavelength range of EX Dra in 1994. Analysis of the Hα emission by means of Doppler tomography indicated that the Hα emission of EX Dra is dominated by the bright spot and the inner Langrangian region, whereas the accretion disk itself is rarely seen in Hα. Fiedler et al. (1997) used optical spectra covering the spectral wavelength range between 3500 and 8900 Å and long term photometric observations, both recorded during the quiescent as well as the outburst state, to determine the fundamental system parameters.
Cataclysmic variables (CVs) are close interacting binary systems containing an accreting white dwarf star and a Roche lobe filling secondary, typically a main sequence star, which loses mass via the inner Langrangian point into the Roche lobe of the white dwarf. Conservation of angular momentum causes the stream material in non-magnetic CVs to form a disk around the massive star, which is the dominating light source of the system as observations reveal. Dwarf novae are a subclass of CVs and frequently show outbursts, which are episodes of enhanced accretion through the disk and onto the central object.
Whereas this basic CV model is well established, the processes leading to mass transfer through the disk and the transport of angular momentum within the disk are still outstanding questions.
The energy flux of cataclysmic variables in the optical wavelength range is dominated by emission from the accretion disk represented by a continuum flux increasing towards a maximum in the UV and emission lines mostly originating from H and He. The line profile shapes depend on the distribution of line flux over the disk and therefore can be used to constrain it. Other components of the system, like the two stars, the gas stream and disk outflows can also significantly contribute to the emission line flux. With Doppler tomography, an image reconstruction technique (Marsh & Horne (1988)), two–dimensional images of the system in velocity space can be obtained, which allow one to ascertain the contributions from the two stars, the disk and other clear emission sites to the observed line flux. Doppler mapping can be used as a constraint for theories of line formation and can indicate the structure of the disk. The emission distribution over the disk in most of the known cataclysmic variables is far from being uniform or even symmetric. The interaction between the highly supersonic overflowing secondary star material and the edge of the rotating disk and the mass transfer through the disk lead to an inhomogeneous distribution of emission. A prominent region of enhanced emission, the so–called bright spot is often visible at the rim of the disk where the stream material impacts onto the disk. Recently a group found observational evidence for spiral structures in an outburst accretion disk by means of Doppler tomography: Steeghs et al. (1997) found a two armed structure in the disk of IP Peg during outburst. Emission from the secondary star can also play a role, as detected for example for the Hα and Hβ line of IP Peg during quiescence (Wolf et al. (1998)). The knowledge of the distribution of line emission is in addition crucial for the measurement of the radial velocity of the white dwarf, since phase-dependent asymmetries in the emission lines distort measurements of this parameter.
This paper presents phase–resolved studies of EX Dra by analysing the spectra presented in Fiedler et al. (1997) in more detail. Our intention is to locate line emitting sites in the system and to obtain information of the line flux distribution over the disk by means of Doppler tomography. Spectra recorded during both the outburst and the quiescent state showing a series of emission lines allow us to compare Doppler maps of different temperatures and accretion states to reveal details of the accretion mechanism in the system EX Dra.
Sect. 2.1 describes the time–resolved spectroscopic observations of the eclipsing dwarf nova EX Dra taken during the quiescent as well as during the outburst state and the applied reduction algorithm. The flux calibration of the spectra is presented in Sect. 2.3. In Sect. 3 the Doppler velocity profiles are discussed and used to map the emission line regions. It is followed by a discussion of the images, a comparison between the high and the low accretion state and a comparison of the Doppler map of Hα with the Hα map of EX Dra performed by Billington et al. (1996). In Sect. 4 the results of this paper are summarized.
2 Data acquisition and reduction
2.1 Spectroscopy
The acquisition and reduction of the spectroscopic data has already been discussed by Fiedler et al. (1997). Therefore in the following only a short summary of the spectroscopic data is presented. A set of 137 optical spectra of EX Dra was recorded in an observing run at the Calar Alto 3.5 m telescope with the Cassegrain Twin Spectrograph in 1992. The choosen gratings provided a dispersion of 1.7 Å per pixel in the blue and 1.1 Å per pixel in the red spectral range with a wavelength coverage between 3440 and 5330 Å and 5690 and 6810 Å respectively. During these observations EX Dra was in quiescent state.
An additional sequence of 32 spectra was taken in a second observing run at the Calar Alto 3.5 m telescope in 1993 during which EX Dra was found in (probably an early) outburst state. The wavelength coverage in the red part of the spectra was extended to longer wavelengths (62008900Å) at the cost of the spectral resolution leading to a dispersion of 2.7 Å per pixel in the red part of the spectra. The blue part of the wavelength range (38405630Å) was observed with a dispersion of 1.8 Å per pixel.
The exposure times varied between 200 s and 1200 s. Spectra of the spectrophotometric standard stars BD +28$^∘$4211 (Stone standard) and Wolf 1346 (Oke standard) were taken.
The spectroscopic data were reduced using the so–called Optimal Spectrum Extraction Algorithm (Horne (1986)), taking into account bias–subtraction, flatfield–correction, sky–subtraction and cosmic–ray elimination and performing a wavelength–calibration.
In order to correct for the wavelength–dependent sensitivity of the atmosphere and of the instruments a separate flux calibration was performed (see Sect. 2.3).
2.2 Photometry
Long term photometric observations of EX Dra in the quiescent as well as in the outburst state were performed with the Multichannel–Multicolour Photometer MCCP (Barwig et al. (1987)) attached to the 80 cm Wendelstein telescope during the years 1991 to 1996 and to the 2.2 m telescope at Calar Alto observatory in 1992 and 1993. The data were recorded with a time resolution of 2 s and 1 s. The MCCP is a high–speed photometer providing three fiber channels to measure the object, a nearby comparison star and the sky background simultaneously. Atmospheric effects are eliminated using the so–called Standard Reduction Algorithm (Barwig et al. (1987)) which subtracts the sky background of each of the five UBVRI colour channels from object and comparison star and divides the object by the comparison star measurements afterwards. The simultaneous observing technique in combination with the reduction algorithm allows to perform photometric measurements even under non–photometric conditions. A detailed journal of the photometric observations from 1991 to 1996 is given by Fiedler et al. (1997). The B and R light curves from these photometric measurements were used for the flux calibration of the spectra (see Sect. 2.3).
2.3 Flux calibration of the spectra
A flux calibration is required in order to account for the wavelength– and time–dependent sensitivity of the atmosphere, for the wavelength–dependent sensitivity of the telescope, the spectrograph and the detector and to transform the recorded flux distribution to an absolute scale.
Under stable atmospheric conditions the flux calibration can be performed by using recorded spectra of spectrophotometric standard stars, or alternatively by using simultaneously recorded broadband photometry. The latter can also be applied under variable atmospheric conditions, when an instrument like the MCCP is used which allows to obtain photometric measurements even under non-photometric conditions.
Unfortunately the atmospheric conditions were not stable during the observations and no simultaneous photometry was available which could have been used to correct for the atmospheric variations. In addition a careful check of the recorded standard star spectra showed that a significant loss of light occured at the spectrograph slit.


Therefore a different approach had to be made: the short term atmospheric variations were corrected by means of mean photometric B and R light curves taken during the quiescent and the outburst states of EX Dra, whereas the wavelength–dependent sensitivity of the atmosphere and the instrument were corrected by using the recorded spectra of the flux stars BD +28∘4211 (1992) and Wolf 1346 (1993). A significant number of photons is lost when a narrow spectrograph slit is used for both the object as well as the standard star spectra. The lack of standard star spectra recorded with a wide slit prevented us from calculating the so–called ’slit loss’. Therefore the resulting spectral flux distribution of the object spectra is accurate to a constant factor.
3 Analysis and results
3.1 Mean quiescence spectra
Fig. 1 presents the mean spectra of EX Dra in quiescence, which are based on 69 single spectra in the blue and 68 in the red wavelength range. Before averaging the single spectra were shifted according to the radial velocity , with (Fiedler et al. (1997)). The spectra show strong, broad emission lines of hydrogen with equivalent widths up to 55 Å for Hα. Neutral helium is present in emission in both the singlet line at 6678 Å and the triplet lines at 4471, 4026, 5876 Å. He ii is weakly present at 4686 Å. Lines from other (highly) ionized species are rarely seen during quiescence, except several Fe ii ( 4924, 5018, 5169 Å) lines.
The hydrogen and helium emission lines show the typical double–peaked profiles associated with accretion disks and are therefore mainly formed within the disk. These profiles are superimposed by asymmetric structures produced by anisotropically radiating emission sites of the system. The Balmer lines Hβ, Hγ, Hδ, Hϵ and the He i ( 6678 Å) line show an asymmetry in form of an enhanced blue–shifted peak in the averaged spectra. The phase–resolved single spectra of these lines show clearly that the maximum of line emission is seen during the phases before the eclipse () in the blue–shifted part of the line profiles. Obviously it can be attributed to the interaction between the infalling gas stream and the outer parts of the disk which produces an anisotropically radiating region of enhanced emission.
Departing from that canonical picture the line profile of the Hα line shows an asymmetry in form of an enhanced red–shifted peak. Obviously at lower temperatures the emission of the bright spot is exceeded by other sources of emission within the system. The phase–resolved line profiles reflect a complex structure indicating that several emission sites contribute to the Hα line flux, but do not allow a separation of the different components. This will be further discussed in Sect. 3.3 in the context of the Doppler maps.
The secondary star is visible in several Ca i absorption lines in the red part of the optical wavelength range. A detailed analysis of these lines can be found in Fiedler et al. (1997).
3.2 Mean outburst spectra
The mean spectra of EX Dra in outburst are displayed in Fig. 2 as the average of 16 single spectra for the blue and 16 for the red spectral range. As discussed in Sect. 2.3 the spectra of the spectrophotometric standard stars suffered from significant slit loss and therefore the computed flux of the spectra of EX Dra is accurate to a constant factor. The energy flux of the system appears to be higher in quiescence than outburst. The mentioned slit loss should account for this contradiction, since we know from photometric measurements taken the night after the spectroscopic observations in 1993 that the optical flux was significantly enhanced compared to July 1992.
The most remarkable features in the outburst spectra are dominant emission lines of the Balmer series and of neutral helium, whereas outburst spectra generally show broad Balmer absorption lines with weak emission cores. A similar behaviour was also seen in IP Peg: Marsh & Horne (1990) recorded outburst spectra of IP Peg and observed enhanced emission line fluxes of all Balmer and helium lines with He ii ( 4686 Å) becoming the strongest line at visual wavelengths. The systems Z Cha (Vogt (1982)) and OY Car (la Dous (1991)) also show emission lines during outburst. The high orbital inclination of these systems probably account for the strong emission lines during eruption, because the flux in the optically thick continuum of the accretion disk is at large inclinations reduced by projection and limb darkening in favor of emission lines formed above the disk.
The profiles of the Balmer lines are almost single–peaked in the mean spectra of EX Dra in outburst, although there are still some small indications of double–peaked structures visible. As a remarkable exception the He i ( 4471 Å) line clearly displays a double–peaked profile in the mean outburst spectra.
High–excitation lines which are only weakly or not at all present during quiescence emerge during outburst, like He ii ( 4686 Å), C ii ( 4267 Å) and the C iii/N iii ( 4634…4651 Å) blend.
He ii emission is often a hint for a strong magnetic field of the white dwarf, but there is no evidence for magnetic accretion in EX Dra. Patterson & Raymond (1985) show that He ii ( 4686 Å) emission can be produced in the upper layer of the disk by reprocessing soft X–rays from the boundary layer when the mass transfer rate exceeds 10. Under the premise that in EX Dra in the recorded outburst state satisfies this condition the detected He ii outburst line could be formed in the (upper layer of the) disk by recombination following photoionization by the boundary layer. He ii is blended by C iii/N iii emission, which prevents us from Doppler imaging this line. The time–resolved line profiles show that the line forming region can not be too extended since most of the He ii emission is eclipsed at phase by the secondary star.
3.3 Doppler imaging in the quiescent state
Line profiles broadened by Doppler shifting retain an imprint of the line emission region from which it originated. The Doppler tomography is an imaging technique, developed by Marsh & Horne (1988), which makes use of the close relationship between the observed emission line flux and the velocity profiles to obtain the distribution of line emission over the surface of the disk in velocity space.
Under the premise that Doppler shifting is the only broadening mechanism of significance it is possible to locate the line forming regions of the binary system by means of Doppler tomography.
The Doppler broadened line profiles represent a projection of the velocity distribution in the direction of the observer’s line of sight, while rotation of the binary gives the observer a continuously varying sequence of velocity projections. This combination of Doppler shifting and binary rotation provides sufficient information for the assembly of two–dimensional maps in velocity space ().
While the observed line profiles are a projection of the velocity distribution, a back–projection algorithm applied to the observed data yields the emission distribution in velocity space.
The computation of a Doppler tomogram is based upon the fundamental fact, that a spot of emission in the binary system traces an ’S–wave’ in the phase–sorted (’phase–folded’) spectra, most evidently displayed by the features of the bright spots in many cataclysmic variables. The coordinate system is defined by the X–axis pointing from the white dwarf to the secondary star and the Y–axis in the direction of motion of the secondary star. The sinusoidal ’S–wave’ radial velocity curve described by an emission spot with velocity coordinates () is a function of the orbital phase :
| (1) |
where is the velocity of the center of gravity of the system. Every pixel () of the Doppler map corresponds to such a particular S–wave in the data. By summing up the flux in the data along this S–wave the mean flux of this particular Doppler map pixel is obtained.
To reconstruct Doppler maps for the emission lines of EX Dra a linear tomography algorithm, the Fourier–Filtered–Back–projection (FFBP) is used, this procedure is described in detail for example by Horne (1991).


Since we do not assume any relation between position and velocity coordinates during the eclipse, spectra of the phases = 0.120.93 have not been taken into account. Before computing the tomograms the underlying continuum flux has been subtracted from the individual emission lines.
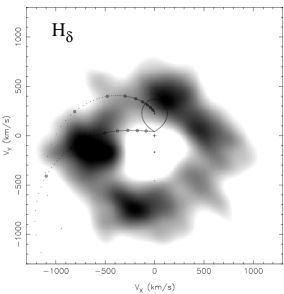
The accretion disk in velocity space is turned inside out, since the outer rim of the disk where the Keplerian velocity is smallest, maps into the inner edge of the Doppler image. The center of gravity of the system is by definition at the origin of the Doppler map and the white dwarf is represented by a point at . Line forming regions of the secondary star map into a Roche lobe–shaped region centered at .
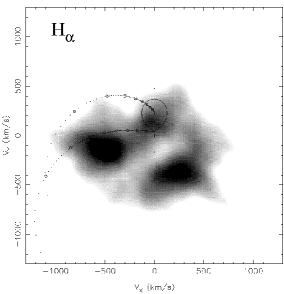
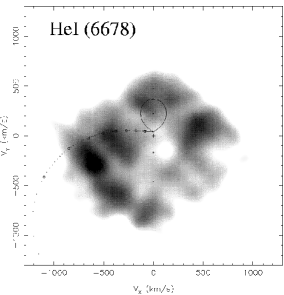
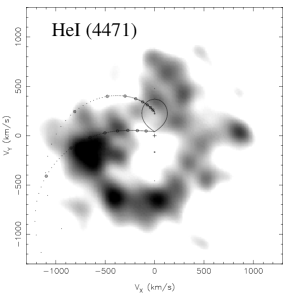
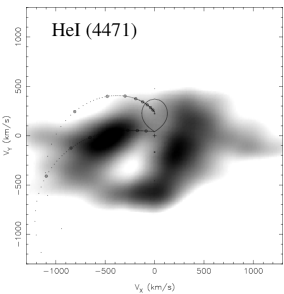
A theoretical gas stream trajectory (lower arc in the Doppler maps) based on K1 and K2 as given by Fiedler et al. (1997) is plotted in the Doppler maps to help interpreting the reconstructed emission distribution in velocity space. Starting with the velocity of the inner Lagrangian point L1 the gas stream trajectory describes an arc towards increased and velocities as the gas particles are accelerated in the direction of the white dwarf () and approaching this central object spiral towards the center of gravity (). Since the stream interacts with the disk, we may see enhanced emission from the region of interaction at velocities ranging between that of the stream and the disk at that location. Therefore a second trajectory (upper arc in the Doppler maps) is inserted, indicating the Keplerian velocity of the disk along the path of the gas stream.
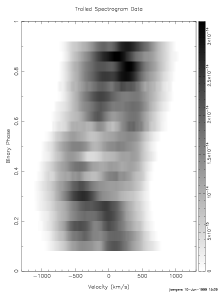
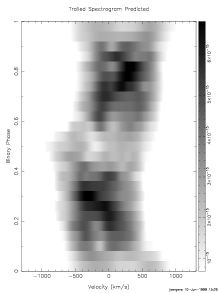
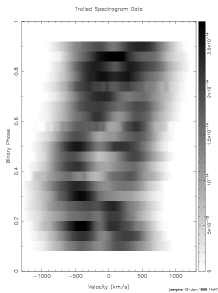
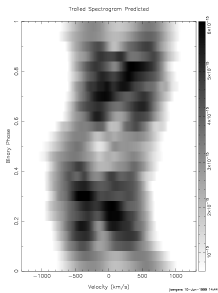
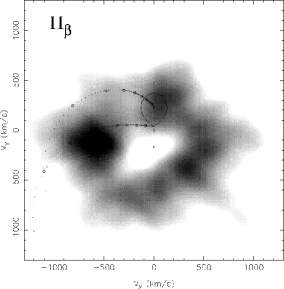
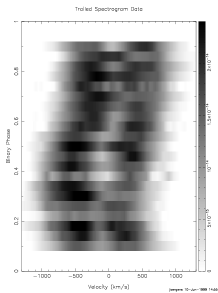
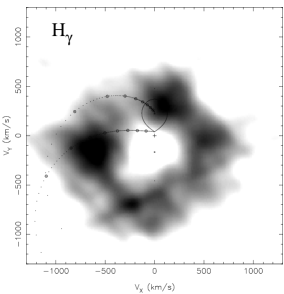
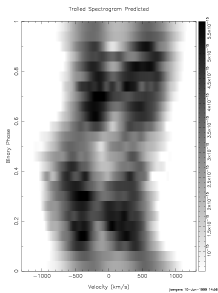
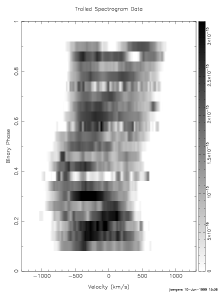
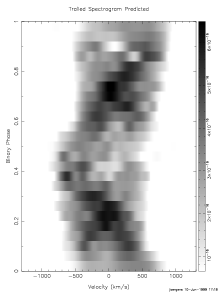
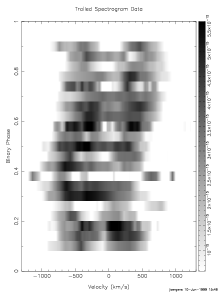
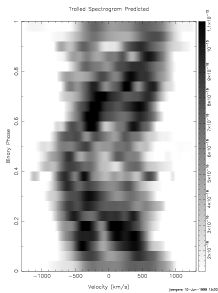
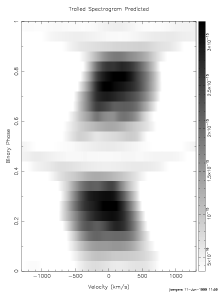
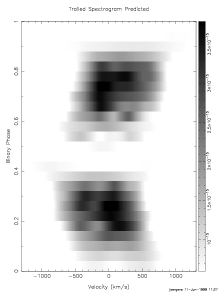
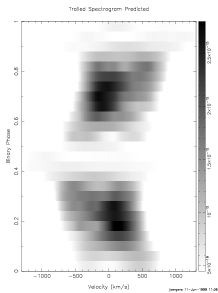
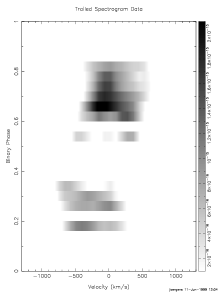
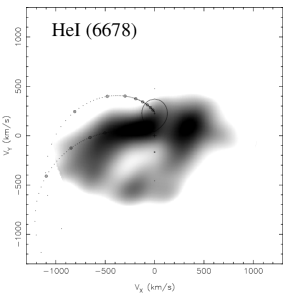
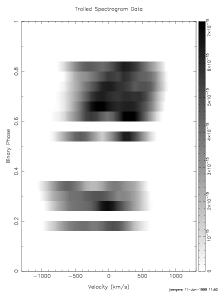
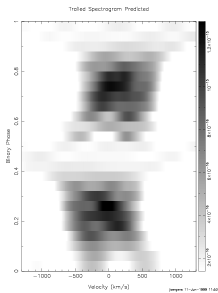
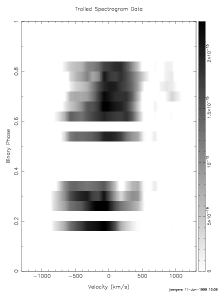
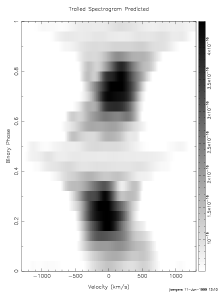
We computed Doppler images for the emission lines Hα, Hβ, Hγ, Hδ, He i ( 6678, 4471 Å) of the quiescence spectra and Hα, Hβ, Hδ, He i ( 6678, 4471 Å) and C ii ( 4267 Å) of the outburst spectra. Fig. 3 and Fig. 4 show the results for the quiescent state and Fig. 5 and Fig. 6 those for the outburst state. For each line the phase–folded spectra (left column), the corresponding Doppler map (right column) and the spectra reconstructed from the map (middle) are displayed.
The maps of Hβ, Hγ (Fig. 3) and Hδ (Fig. 4) during quiescence are dominated by a broad ring–like structure reflecting emission from the accretion disk centered around the white dwarf. The projection of this ring along any direction produces a double–peaked profile (middle column in Fig. 3, Fig. 4) corresponding to the observed double–peaked profiles (left column in Fig. 3, Fig. 4) seen in the Balmer lines at any given phase, with the exception of Hα.
The outer edge of the disk seen in the Hβ, Hγ and Hδ light of EX Dra is represented by the inner edge of the ring–like structure in velocity coordinates, located somewhere between 350 and 500 km s-1.
Emission from the gas stream is detectable in all of the Balmer lines as well as in the He i ( 6678, 4471 Å) lines. Except in Hα it is the brightest region in the emission distributions. The series of small circles along the gas stream mark the distance from the white dwarf at intervals of 0.1 RL1 starting from RL1. There is detectable emission between 0.5 0.3 RL1 in Hβ, Hγ, Hδ and He i ( 4471 Å).
The quiescence data are quite noisy and the time resolution is not sufficient to resolve the obviously existing complex structures in the line profiles. However, an enhancement in intensity around phase 0.2 and 0.8 can be attributed to the bright spot emission. The corresponding S–wave is not visible during the whole binary orbit as it is for an anisotropically radiating emission site. Doppler tomography is based on the assumption that the integrated flux is constant with phase which is violated by any anisotropically emitting spot. This leads to a discrepancy between observed and reconstructed spectra.
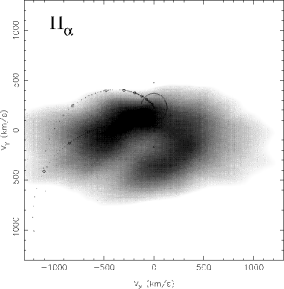
Billington et al. (1996) also observed Hα emission from the gas stream in EX Dra. The center of this emission is located at V km s-1, which is in agreement with the center of the gas stream emission in our quiescence Hα map. But we do not observe the strong broadening of the gas stream emission ranging over velocities of 1000 km s-1, detected by Billington et al. (1996).
The Hα map deviates significantly from that of the other Balmer lines and the He i lines. A second dominant emission spot is present in Hα at velocity coordinates V… km s-1 and V km s-1. This feature is even brighter than the one associated with the gas stream. It is remarkable that a similar feature at about the same velocity coordinates (although fainter) has also been detected in the Hα map of EX Dra performed by Billington et al. (1996). Obviously this feature must be attributed to an emission site within the disk opposite to the bright spot.
Furthermore, Doppler tomography maps a small amount of the Hα emission into the Roche lobe of the secondary star (cp. Fig. 3). Imaging in velocity coordinates does not allow to unequivocally distinguish whether this emission originates at the secondary star or within the disk. This is a general problem of Doppler tomography that two particles at different spatial positions but with the same Doppler velocities map into the same pixel in velocity space. Since the emission displays velocities smaller than 200 km s-1 where no disk emission is expected and since it is visible on that side of the secondary facing the primary it could be caused by photospheric heating of the secondary due to irradiation by the primary component. The emission seems to be concentrated near the poles of the irradiated side of the secondary and the L1 point does not seem to be affected. This suggests the white dwarf or the boundary layer as the ionizing source and a shadowing of the equatorial parts, including the L1 point by the disk.
Billington et al. (1996) also found evidence for irradiation of the secondary in their Hα Doppler map. In contrast to our result they observed strong broadened secondary star emission uniformly distributed over the secondary including L1. This might be due to their incomplete phase coverage and fewer number of spectra compared to our data set.


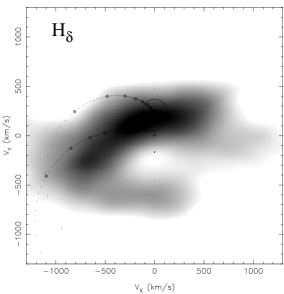

The disk structures in the Hγ, Hδ and He i ( 4471 Å) maps are superposed by several emission features weaker than the bright spot. The features in Hγ and Hδ are consistent. Since such features can be caused by a low phase resolution they might be artificial. Further spectroscopic observations with higher time and velocity resolution are required to verify their existence.
3.4 Doppler imaging in the outburst state
Interpretation of Doppler tomograms of the outburst state is hampered by the fact that the outburst data set covers only 56% of the binary orbit, which could result in artificial effects. Due to a non uniform distribution of the available spectra across the binary orbit we obtain a decreased resolution in the Vx direction in the maps.
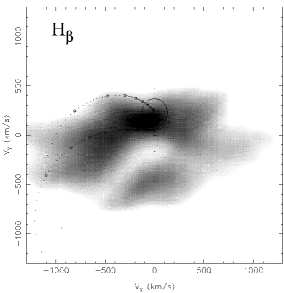
As in many dwarf novae during outburst, EX Dra shows strong Balmer emission from the secondary star in the high accretion state (Fig. 5). The secondary star displays no emission of the He i triplet line at 4471 Å (Fig. 6) whereas there are indications of He i ( 6678 Å) emission from the secondary during outburst.
Because of the mentioned artificial smearing in the Vx direction the bright emission region in the Hα outburst map can be a superposition of emission from the irradiated secondary and the gas stream. Emission from the gas stream is further detectable in the He i maps, most prominently in the line at 4471 Å. A comparison with the He i ( 4471 Å) quiescence map locates the impact region in outburst about 0.2 RL1 closer to the L1 point than in quiescence. This can be attributed to the enhanced accretion during outburst, which causes an enlargement of the outer disk regions due to conservation of angular momentum within the disk.
The system seen in the light of the single ionized carbon (Fig. 6) differs totally from the other images. The C ii emission which is only marginally detectable in quiescence is powerful enhanced during outburst. The S–wave in the observed phase–folded spectra (lower left picture in Fig. 6) indicates that the C ii line flux is emitted at relatively low radial velocities. In the Doppler image the C ii emission is concentrated in the center of the disk suggesting a line forming region close to the white dwarf. Whether C ii originates in the chromosphere of the primary or in parts of the inner boundary layer or in a wind from the white dwarf is not clear. The reconstructed data (lower middle picture in Fig. 6) indicate a reliable back–projection, but the interpretation of the C ii line is hampered by the low S/N ratio of the data recorded within this line and by possible artificial effects due to the incomplete phase coverage and the low phase resolution. However, it is obvious that during outburst the C ii line is not emitted from the same sites, where the Balmer or helium lines originate.
The two He i outburst maps (cp. Fig. 6) clearly display emission features in the disk almost opposite to the bright spot. Recently detected spiral structures in the outburst accretion disk of IP Peg (Steeghs et al. (1997)) suggest that tidally induced spiral shocks (first proposed by Sawada et al. (1986), 1987) may also play a role in the accretion processes during outburst in other dwarf novae. Unfortunately the low spectral and phase–resolution of our outburst data permit no reliable statement about spiral structures in the disk of EX Dra. The detection of spiral patterns by means of Doppler tomography demands a spectral resolution of 80 km s-1 and a time resolution of 40 spectra per binary orbit (Steeghs & Stehle (1999)), which is not met by our outburst data set.
4 Discussion and conclusion
EX Dra in quiescence is dominated by emission from a fully established accretion disk and by emission from the gas stream interacting with its outer rim. The center of the gas stream emission located at during quiescence is in agreement with that in the Hα map of Billington et al. (1996), but our data set does not confirm the strong broadening detected by Billington et al (1996).
Unlike most other dwarf novae, the emission lines of EX Dra remain strong during outburst. This behaviour is also seen in other deeply eclipsing dwarf novae like IP Peg (Marsh & Horn 1990), Z Cha (Vogt (1982)) and OY Car (la Dous (1991)). The high orbital inclination of these systems probably accounts for the strong emission lines during eruption, because at large inclinations the flux in the optically thick continuum of the accretion disk is reduced by projection and limb darkening in favor of emission lines formed above the disk.
Reemission of the secondary star in EX Dra is detectable during quiescence in Hα and during outburst in Hα, Hβ and Hδ, where it becomes the dominating emission source during outburst. The emission is concentrated near the poles of that side of the secondary facing the primary and indicates photospheric heating caused by irradiation by the white dwarf or the boundary layer.
Emission lines from highly excited species, like He ii ( 4686 Å), C ii ( 4267 Å) and C iii/N iii ( 4634 4651 Å) are only marginally or not at all detected during quiescence but become strongly enhanced during outburst.
The Doppler image of the C ii line during outburst locates its line forming region close to the white dwarf. This suggests the chromosphere of the white dwarf or the inner boundary layer or an outflow as possible emission sites. Radial velocity measurements of this line should in principle reproduce the radial velocity of the primary with higher precision than the distorted disk emission lines do. However, due to the low S/N of the C ii line and the incomplete phase coverage of the recorded outburst spectra, we were not able to determine the radial velocity of the C ii line.
The He ii line is superimposed by C iii/N iii emission, for that reason no reliable Doppler map of this line can be performed. Provided that the mass transfer rate exceeds 10 (Patterson & Raymond (1985)) the He ii emission during outburst might be produced by reprocessing of soft X–rays from the boundary layer in the disk.
It is further conceivable that He ii (and C ii) is formed in outflowing material, but this would require a very slow wind. However, the material emitting the He ii and C ii lines can not be too extended, but must be closely confined to the orbital plane since both emission lines are eclipsed at phase .
A comparison between the location of the gas stream emission in the Doppler maps of He i ( 4471 Å) in quiescence and outburst show that the disk radius is enlarged by about 0.2 RL1 during outburst.
The brightest line forming region in quiescence in the Doppler map of Hα is located far from the gas stream trajectory. We have no explanation which line forming processes are involved to produce this feature. Since this emission spot is only detectable in the Hα line and not in lines reflecting higher temperatures it is unlikely to be caused by a second impact region, as discussed e.g. by Lubow (1989). This emission spot is partly responsible for the complex Hα line profiles and the asymmetric profile in the averaged spectra in form of an enhanced red–shifted peak.
The He i maps computed for the outburst spectra show evidence for emission structures in the right and top right region of the Doppler maps. Unfortunately the quality of the outburst spectra does not allow to draw a clear decision whether these structures may be attributed to spiral structures within the accretion disk of EX Dra, as detected for IP Peg during outburst (Steeghs et al. (1997)), or not.
Our results show that EX Dra is a very interesting CV and that the next step should be spectroscopy with higher time and spectral resolution. The fact that the system can be frequently found in the outburst state should make further investigation possible throughout it’s outburst cycle.
Acknowledgements.
We thank Vadim Burwitz for helpful discussions and useful comments on the manuscript. We also thank C. Ries for collecting photometric data at Wendelstein observatory. Part of this work was supported by the Deutsche Forschungsgemeinschaft, grant Ba 867/3-1, Ba 867/5-1.References
- Barwig et al. (1987) Barwig H., Schoembs R., Buckenmayer C., 1987, A&A 175, 327
- Barwig et al. (1993) Barwig H., Fiedler H., Reimers D., Bade N., 1993, in: Compact Stars in Binary Systems, ed. H. van Woerden, Abstracts of IAU Symp. 165, p. 89
- Billington et al. (1996) Billington I., Marsh T.R., Dhillon V.S., 1996, MNRAS 278, 673
- Fiedler et al. (1997) Fiedler H., Barwig H., Mantel K.H., 1997 A&A, 327, 173
- Horne (1986) Horne K., 1986, PASP 98, 609
- Horne (1991) Horne K., 1991, In: Fundamental Properties of Cataclysmic Variable Stars: 12th North American Workshop on Cataclysmic Variables and Low Mass X–ray Binaries, San Diego State University Publication, San Diego, ed. A.W. Shafter, p. 160
- la Dous (1991) la Dous C., 1991, A&A 252, 100
- Lubow (1989) Lubow S.H., 1989, ApJ 340, 1064
- Marsh & Horne (1988) Marsh T.R., Horne K., 1988, MNRAS 235, 269
- Marsh & Horne (1990) Marsh T.R., Horne K., 1990, ApJ 349, 593
- Patterson & Raymond (1985) Patterson J., Raymond J.C., 1985, ApJ 292, 550
- Sawada et al. (1986) Sawada K., Matsuda T., Hachisu I., 1986, MNRAS 219, 75
- Sawada et al. (1987) Sawada K., Matsuda T., Inoue M., Hachisu I., 1987, MNRAS 224, 307
- Steeghs & Stehle (1999) Steeghs D., Stehle R. 1999 MNRAS 307, 99
- Steeghs et al. (1997) Steeghs D., Harlaftis E.T., Horne K., 1997 MNRAS 270, L28, Erratum: 1998 MNRAS 296, 463
- Vogt (1982) Vogt N., 1982, ApJ 252, 563
- Wolf et al. (1998) Wolf S., Barwig H., Bobinger A., Mantel K.H., Simic D., 1998, A&A 332, 984