Multiwavelength optical observations of chromospherically active binary system OU Gem
Abstract
We have analysed several multiwavelength optical observations (H, H, H, Ca ii H & K, Ca ii IRT lines) of chromospherically active binary system OU Gem, taken in three observation runs: March 1996, April 1998 (using the SOFIN spectrograph and the Nordic Optical Telescope) and January 1999 (using the ESA-MUSICOS spectrograph and the Isaac Newton Telescope). The spectra show double H and H absorption lines, but after applying the spectral subtraction technique, clear excess emission is seen in both components. The two stars have the Ca ii IRT lines in emission, strong emission in the Ca ii H & K lines and small emission in the H line. Although they have very similar spectral types, the cool one is more active than the hot one in all runs, except for MUSICOS run, and in all spectral lines, except for Ca ii IRT lines.
Departamento de Astrofísica, U. Complutense de Madrid, Spain
1. Introduction
OU Gem (HD 45088) is a bright (V= 6.79, Strassmeier et al. 1990) and nearby (d= 14.7 pc, ESA 1997) BY Dra-type SB2 system (K3V/ K5V) with a 6.99-day orbital period and a noticeable eccentricity (Griffin Emerson 1975). Both components show Ca ii H K emission, though the primary emission is slightly stronger than the secondary emission. The H line is in absorption for the primary and filled-in for the secondary (Bopp 1980, Bopp et al. 1981a, b, Strassmeier et al. 1990). Dempsey et al. (1993) observed that the Ca ii IRT lines were filled-in. It is interesting that the orbital and rotational periods differ in 5% due to the appreciable orbital eccentricity (e= 0.15), according to Bopp (1980).
Although BY Dra systems are main-sequence stars, their evolutionary stage is not clear. OU Gem has been listed by Soderblom et al. (1990) and Montes et al. (1999) as a possible member of the UMa moving group (300 Myr), and this suggests it may be a young star.
In this paper we present multiwavelength optical observations of chromospherically active binary system OU Gem.
2. Observations
Spectroscopic observations in several optical chromospheric activity
indicators of OU Gem and some inactive stars of similar spectral type and
luminosity class have been obtained during three observation runs.
1) Two runs were carried out with the 2.56 m Nordic Optical Telescope
(NOT) at the Observatorio del Roque de Los Muchachos (La Palma, Spain) in
March 1996 and April 1998, using the SOFIN echelle spectrograph covering
from 3632 Å to 10800 Å
(resolution from 0.15 to 0.60 Å), with the
1152770
pixels EEV P88200 CCD detector.
2) The last run was carried out with the 2.5 m INT at the Observatorio
del Roque de Los Muchachos (La Palma, Spain) in January 1999 using
Multi-Site Continuous Spectroscopy (MUSICOS), covering from 3950 Å to
9890 Å (resolution from 0.15 to 0.40 Å),
with the 21482148 pixels
SITe1 CCD detector.

In the three runs we obtained 4 spectra of OU Gem at different orbital phases. The stellar parameters of OU Gem have been adopted from Strassmeier et al. (1993), except for distance (given by the Hipparcos catalogue (ESA 1997)), the B-V color index and the radius (taken from the spectral type). The spectra have been extracted using the standard reduction procedure of the IRAF package (bias subtraction, flat-field division and optimal extraction of the spectra). The wavelength calibration was obtained by taking spectra of a Th-Ar lamp, for NOT runs, and a Cu-Ar lamp, for INT runs. Finally the spectra have been normalized by a polynomial fit to the observed continuum. The chromospheric contribution in the activity indicators has been determined using the spectral subtraction technique (Montes et al. 1995a, b).
3. The H line
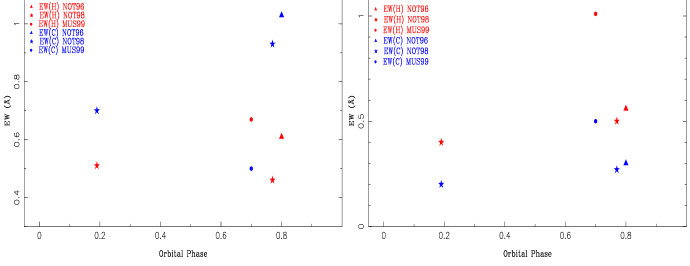
We have taken several spectra of OU Gem in the H line region in three different runs and at different orbital phases. The line profiles are displayed in Fig. 1. For each observation, we have plotted the observed spectrum (left panel) and the subtracted spectrum (right panel). In the observed spectra, we can see an absorption line for the primary star and a nearly complete filling-in for the secondary star. After applying the spectral subtraction technique, clear excess H emission is obtained for the two components, being stronger for the hot one. The excess H emission equivalent width (EW) is measured in the subtracted spectrum and corrected for the contribution of the components to the total continuum. We took one spectrum in this region in Dec-92 (Montes et al. 1995b). At the orbital phase of this observation (= 0.48) we could not separate the emission from both components and we measured the total excess H emission EW. We obtained a similar value to Mar-96, Apr-98 and Jan-99 values obtained adding up the excess emission EW from the two components. In Fig. 2 we have plotted the excess H emission EW versus the orbital phase.
4. The H line
Four spectra in the H region are available, in three different runs and at different orbital phases. Looking at the observed spectra in Fig. 3, we can only see the H line of the primary, in absorption. After applying the spectral subtraction tecnique, small excess H emission is obtained for the two components. We have determined the excess H emission EW in the subtracted spectra, the ratio of excess H and H emission EW, and the relation:
| (1) |
given by Hall & Ramsey (1992) as a diagnostic for discriminating between the presence of plages and prominences in the stellar surface. We have obtained high values for the two components, so the emission can come from prominences.

5. The Ca ii IRT lines
The Ca ii infrared triplet (IRT) 8498, 8542, and 8662 lines are

other important chromospheric activity indicators. We have taken several spectra of OU Gem in the Ca ii IRT lines region in three different runs and at different orbital phases, the three Ca ii IRT lines are only included in MUSICOS 99 observation run. In the observed spectra, we can see both components of OU Gem show these lines in emission superimposed to the corresponding absorption (Fig. 4). After applying the spectral subtraction tecnique, clear excess emission appears for the two components, being stronger for the hot one. In Fig. 2 we have plotted the Ca ii 8662 EW versus the orbital phase for the hot and cool components.
6. The Ca ii H K and H lines
We have taken three spectra in the Ca ii H & K lines region during the two NOT (96 & 98) observation runs. In Fig. 5 we can observe that both components of this binary have the Ca ii H K and H lines in emission. We can also see that the hot star’s excess Ca ii H & K emission is bigger than the cool star’s. At 0.19 orbital phase, we only see the H line of the cool component because the H line of the hot star is overlapped with the Ca ii H line of the cool one. At the other orbital phases, we can only see the H line of the hot component because the H line of the cool one is overlapped with the Ca ii H line of the hot star. We took one spectrum in this region in Mar-93 (Montes et al. 1995a, 1996), with the 2.2 m telescope at the German Spanish Astronomical Observatory (CAHA). At the orbital phase of this observation (= 0.47) we could not separate the emission from both components and we measured the total excess Ca ii K H emission EW. We obtained similar values to Mar-96 and Apr-98 values obtained adding up the excess emission EW from the two components, though we note that the Apr-98 values are slightly bigger than the others.
Acknowledgments.
This work was supported by the Universidad Complutense de Madrid and the Spanish Dirección General de Enseñanza Superior e Investigación Científica (DGESIC) under grant PB97-0259.

References
Bopp B.W., 1980, PASP, 92, 218
Bopp B.W., Hall D.S., Henry G.W., Noah P., Klimke A., 1981a, PASP, 93, 504
Bopp B.W., Noah P., Klimke A., Africano J., 1981b, ApJ, 249, 210
Dempsey R.C., Bopp B.W., Henry G.W., Hall D.S., 1993, ApJS, 86, 293
ESA 1997, ”The Hipparcos and Tycho Catalogues” ESA SP-1200
Griffin R.F., Emerson B., 1975, Observatory, 95, 23
Hall J.C., Ramsey L.W., 1992, AJ, 104, 1942
Montes D., De Castro E., Fernández-Figueroa M.J., Cornide M., 1995a, AAS, 114, 287
Montes D., Fernández-Figueroa M.J., De Castro E., Cornide M., 1995b, AA, 294, 165
Montes D., Fernández-Figueroa M.J., Cornide M., De Castro E., 1996, AA, 312, 221
Montes D., Latorre A., Fernández-Figueroa M.J., 1999, ASP Conf. Ser., Stellar clusters and associations: convection, rotation and dynamos. R. Pallavicini, G. Micela and S. Sciortino eds.
Soderblom D.R., Pilachowski C.A., Fedele S.B., Jones B.F., 1990, ApJS, 72, 191
Strassmeier K.G., Fekel F.C., Bopp B.W., Dempsey R.C., Henry G.W., 1990, ApJS, 72, 191
Strassmeier K.G., Hall D.S., Fekel F.C., Scheck M., 1993, AAS, 100, 173 (CABS)