VLBI observations of two single dMe stars:
spatial resolution and astrometry
Abstract
We report on 3.6 cm VLA and VLBA observations of YZ CMi and AD Leo, two nearby dMe stars. We resolve YZ CMi and can fit a circular symmetrical gaussian component of FWHP of 0.98 0.2 mas, corresponding to an extent of the corona above the photosphere of cm or 0.7 ( refers to the photospheric radius). We obtain an estimate of the brightness temperature of K, which is consistent with that expected from gyrosynchrotron emission. For AD Leo the emitting region is unresolved. We therefore set a conservative upper limit to its diameter of 1.8 times the photosphere diameter, which leads to an extent of the corona above the photosphere of cm or . We compare the radio emitting dMe stars with measured sizes with the Sun and conclude that these active stars have much more extended coronal radio emission than the Sun. The VLBA position of YZ CMi has been found to differ by 32 mas from the positions calculated from the Hipparcos catalogue. The discrepancy is caused by large errors in the listed proper motion. An improved value is given.
Key Words.:
Radio continuum: stars–stars: coronae–Astrometry–stars: individual:YZ CMi, AD Leo
michele@oso.chalmers.se
1 Introduction
Hot coronae are the enigmatic link between cool, convective stars and their environment. While most of this hot plasma ( K) is contained by magnetic fields, some may escape due to overpressure as a hot stellar wind along open field lines. The extent of intense coronal emissions in X-rays or radio waves thus yields a lower limit to the size of closed magnetic loops, i.e. the size of the stellar magnetosphere.
Radio emission from solar active regions at 3 cm wavelength originates from altitudes above the photosphere between 5 to cm, or 0.006 - 0.015 , (e.g. Aschwanden et al. 1995). It is generally attributed to thermal gyroresonance emission. The size of the radio image of the Sun increases at longer wavelengths. In soft X-rays and EUV line emissions, coronal loops reach cm (0.5 ) (e.g. Sturrock et al. (1996)). Magnetic loops in excess of cm (2 ) have been observed in metric U bursts (Labrum & Stewart (1970)). Coronograph observations in white light, however, do not regularly see loops of that size, suggesting that they are shortlived. In general, large magnetic loops are confined to low latitudes and, consequently, the radio image of the Sun is more extended in the equatorial direction.
Very Long Baseline Interferometry (VLBI) has made it possible to study the size and shape of main-sequence stellar coronae. At 3.6 cm, Benz et al. (1998) have resolved the dMe star UV Cet B at an higher and variable flux level into two components separated by cm (4.4 ). One of the components was spatially resolved with the size of about the stellar photosphere. The orientation of the two sources was found to lie along the probable axis of rotation, strongly suggestive of coronal enhancements extending at least cm (2.1 ) above the poles. Thus, UV Cet B differs considerably from the Sun in size and shape of the radio corona.
More VLBI observations of dMe stars have been reported at 18 cm wavelength. For YZ CMi, Benz & Alef (1991) found an upper limit of cm, suggesting an extent of a circular corona above the photosphere of less than cm (0.74 ). Two size measurements of AD Leo by Benz et al. (1995) suggest a coronal extent of less than cm (1.0 ) and cm (2.6 ) above the photosphere, assuming a circular, concentric shape. A small total size of less than cm for EQ Peg (Benz et al. 1995) refers to an observation during a totally polarized flare, and an extremely large size of cm was reported for the dMe close binary YY Gem (Alef et al. (1997)).
The radio coronae of active, rapidly rotating dMe stars have been modeled to determine the emission process. It is generally agreed (Güdel (1994); White et al. (1989)) that weakly polarized radio emission is produced by the gyrosynchrotron mechanism of a population of mildly relativistic electrons. This mechanism, however, cannot account for polarizations exceeding about 50% which may originate from a coherent process. Circular polarizations of up to 80% have been reported for YZ CMi at 20 cm and 18 cm (Lang & Wilson (1986); Benz & Alef 1991).


Here we report on the results of VLBA experiments of YZ CMi and AD Leo at 3.6 cm. These are well known, nearby, young radio stars close to zero-age main sequence (ZAMS). Some of their general properties are listed in Table 1.
2 Observations and data reduction
The single dMe stars YZ CMi and AD Leo were observed on 1997 April 18/19 and 1996 December 12, respectively, with the VLBA and the phased-up VLA as a joint VLBI system yielding an angular resolution of better than one milliarcsecond (mas).
The VLA was also available in its normal interferometer mode and was used for total flux measurements at very small baseline length which allowed us to monitor the changes in total flux density and polarisation of both stars through the observations. 3C286 was used for the flux calibration of both stars.
The VLBI observations used a bandwidth of 8 MHz in both left and right circular polarization at 8.41 GHz (3.6 cm) and two bit sampling, giving a data rate of 128 Mbit/s. In order to reliably image such weak sources ( mJy) the phase referencing technique was used (Beasley & Conway (1995)) in which we switched between the target and a bright calibrator (quasar) in cycles of two to three minutes. For our targets YZ CMi and AD Leo these calibrators were 0736+017 and 1022+194 respectively (see Table 2), at 2.1 and 1.4 degrees separation from the target.
The amplitude calibration was performed with AIPS, followed by editing in DIFMAP (in order to flag more precisely single, bad visibilities of the VLBA data) and by a continued analysis in AIPS (including all the mapping). We first made hybrid maps of our calibrators using closure phase methods in order to determine their structure. We then determined the atmospheric contributions to the phase of the calibrator data. With these solutions it was possible to phase-correct the stellar data. We then made preliminary wide maps in order to find the stars and phase-rotated the data in order to bring the target stars to the image phase center. Finally we deconvolved the stellar images using CLEAN.
As a check of the reliability of the phase calibration, our observations also included a second bright calibrator for each star (0743-006 for YZ CMi, and 1013+208 for AD Leo, see Table 2). The maps of these secondary calibrators, made using the phase solutions found towards the primary calibrators showed a dynamic range of about 20:1. Since the separation between the two calibrators is approximately the same as that between the star and each calibrator, we can conclude that our stellar images have also a 20:1 dynamic range and hence are in practice noise limited rather than dynamic range limited. We also produced selfcalibration maps and datasets of the secondary calibrators. The plots of the fringe amplitude against u,v-distance show the same fall off than the ones produced from the phase referenced datasets. This confirms the value of the dynamic range of the images of the targets.
The source centroid positions of the phase referenced maps of the secondary calibrators were within 0.5 and 0.2 mas of the correlated positions (a-priori positions) for 0743-006 and 1013+208 respectively (see Table 2). This is consistent with the claimed accuracy of those correlated positions (0.5 mas, Johnston et al. 1995). This test gives us confidence in the astrometric accuracy of our stellar positions (see Sect. 3.4).
3 Results
3.1 Total flux monitoring
YZ CMi was found at a surprisingly high, slowly decreasing flux density (average 2.9 mJy) during the whole observation (see Fig. 1, left plot). As previously noted (see Sect. 1), the emission of YZ CMi is often considerably polarized. Throughout this observation the polarization was predominantly left circular (about 60 % circular polarisation during the quiescent emission, and 90 % during the flares). Two strong flares appear in the lightcurve obtained with the VLA. Their flux values reach up to 6.0 mJy. The detection of YZ CMi with both instruments was clear, as the rms noise in the VLA image was 0.063 mJy/beam, and in our high sensitivity VLBI maps made using only VLBA-VLA baselines the noise was 0.13 mJy/beam. Given these map noise values the peak intensity of the star was 47 in the VLA image, and 16 in the VLBA image.
The mean flux density value for AD Leo was at a more typical level of 0.7 mJy (see Fig. 1, right plot). Similar fluxes at 18 cm have previously been reported (e.g. Jackson et al. (1989); Benz et al. 1995). A weak flare appears in the VLA lightcurve (2.1 mJy). The star was detected by both instruments despite its low flux. The rms noise for the VLA map was 0.035 mJy/beam, while for the map made with only the VLA-VLBA baselines it was 0.18 mJy/beam. Peak map values were 15.6 for the VLA and 5 for the VLBA maps respectively. Tracing the lightcurve of AD Leo from the interferometric VLA data was a delicate task because of two strong sources in the field of view.
3.2 Size and shape of YZ CMi
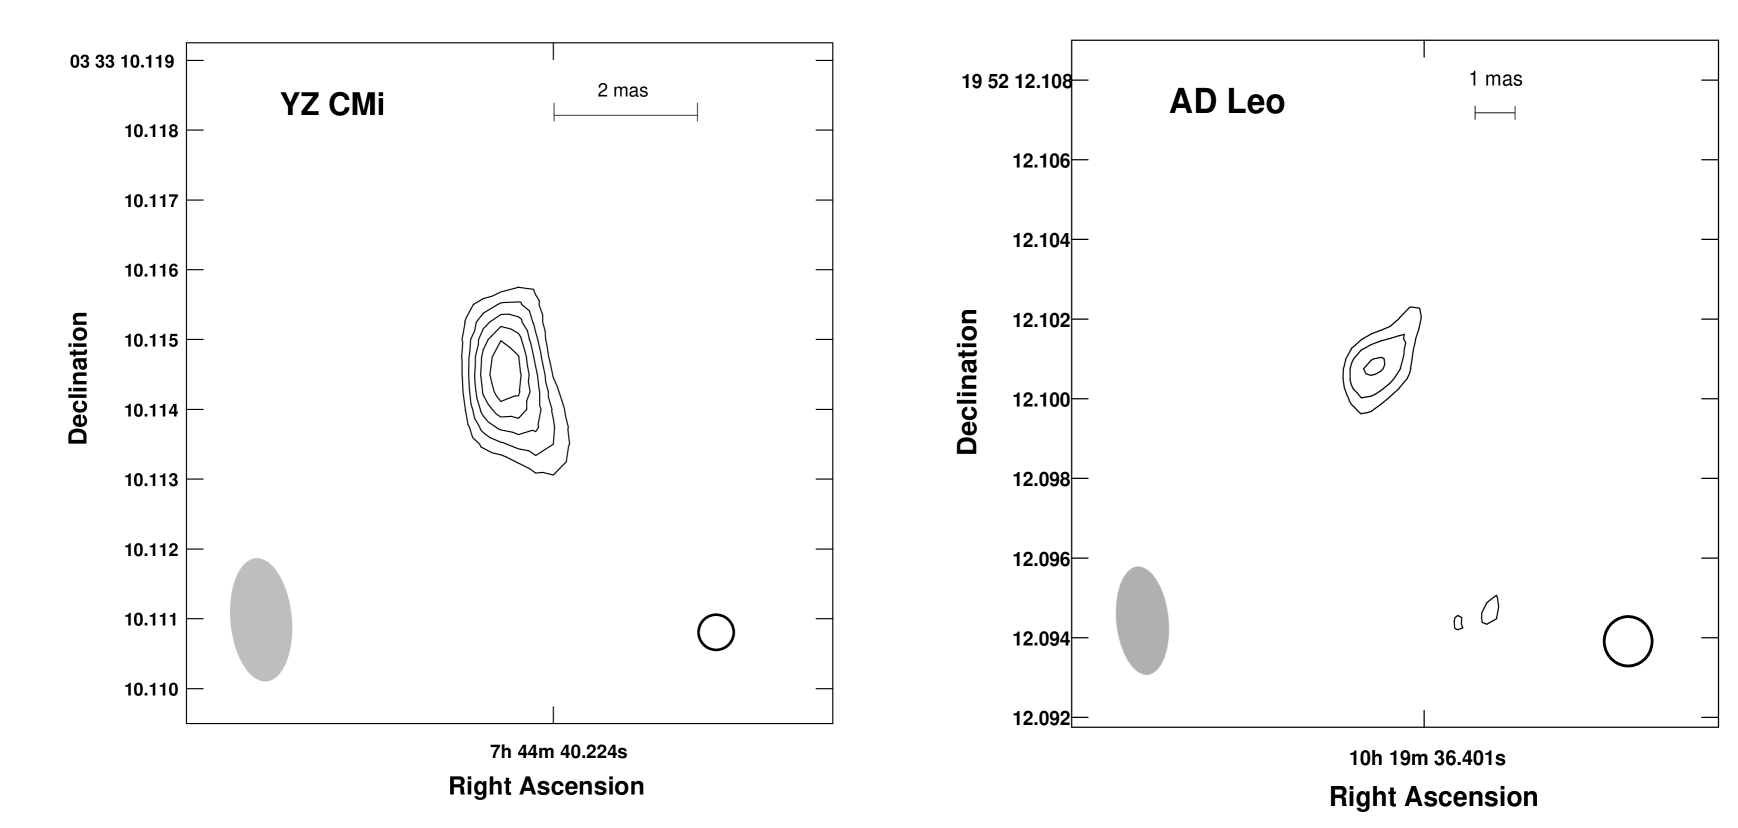
The phase referenced VLBA map of YZ CMi is shown in Fig. 2. Evidence for spatial resolution was found in this map. Further evidence for extended emission can be most clearly seen by examing fringe amplitude versus baseline length obtained using the VLA-VLBA baselines (see Fig. 3, left plot). We obtained this plot by first coherently averaging the data on each baseline-scan (75 minutes) in order to increase the signal to noise ratio significantly above unity. We then binned the amplitude over baseline length finding the mean amplitude in each bin by incoherent averaging. The error bars on this average were determined from the internal scatter of the data.
The fall off noticeable in Fig. 3 left plot clearly indicates a resolved source. What is more, the phase values on VLBI baselines to the phased VLA over the whole observation show no significant variation from zero. There is therefore no evidence for anything other than a single centro-symmetric component. We searched also for other evidence for non-symmetrical structure looking at closure phases, but the SNR of these were too low.
Given the close to quadratic fall off of the fringe amplitude with u,v-distance shown in Fig. 3 left plot it is impossible to distinguish between gaussian, sphere, disk or ring like models (Pearson (1995)). We therefore fitted one-component gaussian models to the YZ CMi data. The numerical values for the fits are summarized in Table 1. The dimensions of sphere, disk and ring which would show similar fits are expected to be respectively 1.8, 1.6 and 1.1 times the gaussian FWHP values (Pearson 1995). Two ways of fitting were followed: fitting in AIPS using the task UVFIT and our own model fitting to the data. The first fitted an elliptical gaussian and obtained for the whole data set a major axis of FWHP of 1.4 0.3 mas and a minor axis of 0.5 0.25 mas (1 errors). There is therefore no strong evidence for ellipticity, and our subsequent fitting of the data outside of AIPS assumed only a circular gaussian. With such a model it was possible to fit most of the data within 1 . The best fitting FWHP size of the corona was found to be 0.98 0.2 mas, which corresponds to 1.7 0.3 stellar diameters.


| YZ CMi 1997 | AD Leo 1996 | |
| Spectral type | M 4.5Ve | M 4.5Ve |
| Distance | 5.93 0.09 pc | 4.90 0.07 pc |
| Optical diameter | 0.58 mas | 0.95 mas |
| (UVFIT all obs) | 1.4x0.5 (0.3x0.25) mas | |
| PA 12.8o (5.1) | ||
| (gaussfit all obs) | 0.98 (0.2) mas | |
| (UVFIT scan 2) | 0.890 (0.22) mas | |
| (gaussfit scan 2) | 1.02 (0.2) mas | |
| pm and plx | : -0.32 mas | : -0.90 mas |
| during observations | : -0.16 mas | : +0.29 mas |
| VLBA Position | : 7h 44m 4022399 0.00007 | : 10h 19m 3640112 0.00007 |
| (J2000) | : 3°33′101140 0.0005 | : 19°52′121008 0.0005 |
| Mean flux density | ||
| during observation | 2.97 mJy | 0.54 mJy |
| Brightness temperature | 7.29 K | K |
Since the second VLBI scan corresponds precisely to one of the two strong flares (see Fig. 1, left plot), it was interesting to study it more closely. Fig. 3 (right plot) shows the amplitude versus u,v-distance. Of this scan we selected the subscan on the target with the highest flux density value and coherently averaged the data over it (3 minutes), obtaining one point per VLA-VLBA baseline. The solid line corresponds to the same gaussian model fitted to the whole data set (see Fig. 3, left plot) except for the total flux density which was increased to 5.1 mJy. We find that this scaled model fits the data within the errors and therefore there is no evidence for a change in source size during the flare. Independent gaussian fits to the data are also consistent with this conclusion (see Table 1).
We should add that the contribution of the proper motion and of the changing parallax of the star during the ten hours of observation is -0.32 mas and -0.16 mas in and , respectively. These values are small enough that they do not give a significant contribution on the spatial extent.
| Star | Name of calibrator | (J2000) | (J2000) |
|---|---|---|---|
| YZ CMi | 0763+017 | 07h 39m 18.0339s | 010 37 04.619 |
| 0743-006 | 07h 45m 54.0823s | -000 44 17.538 | |
| AD Leo | 1022+194 | 10h 24m 44.8096s | 190 12 20.416 |
| 1013+208 | 10h 16m 44.3251s | 200 37 47.336 |
3.3 AD Leo
An image of AD Leo is shown in Fig. 2. It appears slightly elongated. This image is probably affected by the star’s high proper motion (Table 1), since the extension is exactly along the expected direction: the star appears blurred because of its motion during the synthesis observation.
As shown in the flux curve of AD Leo (Fig. 1, right plot), the total flux varied by a factor of 3 during the observations. Adding this fact to the high proper motion of the star, it is not surprising that attempts to fit a single gaussian to the -data did not give consistent results. The weakness and variability of the star make the estimation of errors on the size difficult. However, from the image (see Fig. 2), we can note that the apparent FWHP perpendicular to the motion corresponds to the beam FWHP in this direction. The intrinsic FWHP size of the emitting region is therefore likely to be less than half the beam FWHP or about 1 mas, which equals the estimated optical diameter of the star (see Table 1). This might indicate a very compact corona or an emitting spot on the surface of the star. A very conservative upper limit on the size of the corona in the former case would be to assume the emitting region to be an optically thin sphere instead of a gaussian (Pearson (1995)) in which case the diameter is less than 1.8 times the photosphere diameter, and it therefore has an extent above the photosphere of less than 0.8 .
| star | radio luminosity | extent of corona above | photosphere | reference |
|---|---|---|---|---|
| [erg/s Hz] | cm | |||
| Sun | 0.011 | Aschwanden et al. 1995 | ||
| AD Leo | this work | |||
| UV Cet B | 2.1 | Benz et al. 1998 | ||
| YZ CMi | 0.7 | this work |
3.4 Astrometry
The relatively large signal-to-noise ratio for YZ CMi and the phase referencing to a calibrator with good (0.5 mas) positional accuracy in the radio frame (Johnston et al. 1995) allowed us to determine a precise position for this star. This position was compared with the position given by the Hipparcos catalogue (ESA 1997). Correcting for proper motion and parallax, we found a discrepancy of 20.9 mas in and 30.4 mas in , thus a total deviation of 36.9 mas. The proper motion of the star is given in the Hipparcos catalogue as -344.9 2.6 mas/yr in , and -450.8 1.75 mas/yr in . Considering the time interval between the two measurements of 6 years, the difference is 2 and thus within the accuracy of the proper motion error bars. Combining the VLBA and Hipparcos positions (courtesy of F. Arenou), an improved proper motion of -348.6 0.6 mas/yr in , and -446.6 0.3 mas/yr in can be derived.
The position of AD Leo obtained with the VLBA was compared with those available in the Gliese and Tycho catalogues. The latter showed a deviation with the VLBA position of 176.3 mas and 100.0 mas in and , respectively. They are within one standard deviation of the Tycho catalogue accuracy.
4 Discussion and conclusions
VLBA observations have spatially resolved YZ CMi and the data could be fitted with a circular gaussian of a FWHP of 0.98 0.2 mas. The radio corona extent is cm above the photosphere (the phospheric radius is assumed to be cm, Pettersen 1980). For AD Leo, which is closer and has a larger photosphere, but was observed at a much weaker flux level, the corona was not resolved and we set a robust upper limit of cm above the photosphere (see Sect. 3.3).
4.1 The brightness temperature
For YZ CMi (see Table 1) we obtain a mean brightness temperature K, while for AD Leo we set an upper limit of K. These mean values are smaller than previously reported for YZ CMi by Benz & Alef (1991) and AD Leo at 18 cm (Jackson et al. (1989)). The lower values at 3.6 cm are still consistent with a non-thermal spectrum from gyrosynchrotron but do not formally exclude thermal processes. However the significant circular polarisation found during the observations strongly argues for a gyrosychrotron emission mechanism.
The derived extent of the coronae above the photosphere of the dMe stars is compared to the Sun in Table 3. The solar value refers to stereoscopic measurements of the thermal gyroresonance emission of active regions. The average value at 10-14 GHz reported by Aschwanden et al. (1995) has been used.
The experience from the solar radio emission makes it clear that the observed radio size is only a lower limit of the size of the stellar corona. Nevertheless, these results indicate that the observed active dMe stars have much larger active coronae than the Sun. It might be that such dMe stars posess systems of closed loops reaching heights in excess of a stellar diameter. One way to realize such extended coronae is by large distances between footpoints as possibly seen in the case of UV Cet B (Benz et al. 1998). This indicates either that active regions are very large, or that active loops preferentially connect different active regions.
Acknowledgements.
We thank F. Arenou for the combined evaluation of VLBA and Hipparcos astrometry data. The Very Large Baseline Array and the Very Large Array are operated by Associated Universities, Inc. under contract with the US National Science Foundation. The work at ETH Zurich is financially supported by the Swiss National Science Foundation (grant No. 20-046656.96 ).References
- Alef et al. (1997) Alef W., Benz A.O., Güdel M. 1997, A&A 317, 707
- (2) Aschwanden M.J, Lim J., Gary D.E., Klimchuk J.A. 1995, ApJ 454, 512
- Beasley & Conway (1995) Beasley A. J., Conway J.E. 1995, VLBI Phase-Referencing. In: J. A. Zensus, P. J. Diamond, P. J. Napier (eds) ASP Conferences Series, Vol. 82, Very Long Baseline Interferometry and the VLBA. PASP, San Francisco, p. 328
- (4) Benz A. O., Alef W. 1991, A&A 252, L19
- (5) Benz A. O., Alef W., Güdel, M. 1995, A&A 298, 187
- (6) Benz, A.O., Conway J.E., Güdel M. 1998, A&A 331, 596
- Hipparcos catalogue (1997) ESA 1997, The Hipparcos and Tycho Catalogues, ESA SP-1200
- Güdel (1994) Güdel M. 1994, ApJS 90, 743
- Jackson et al. (1989) Jackson, P.D., Kundu, M.R., White, S.M. 1989, A&A 210, 284
- (10) Johnston K. J., Fey, A. L., Zacharias N., et al. 1995, AJ 110, 880
- Labrum & Stewart (1970) Labrum N. R., Stewart R.T. 1970, Proc. Astron. Soc. Australia 1, 316
- Lang & Wilson (1986) Lang K., Willson R.F. 1986, ApJ 302, L17
- Pearson (1995) Pearson T. J. 1995, Non-Imaging Data Analysis. In: J. A. Zensus, P. J. Diamond, P. J. Napier (eds) ASP Conferences Series, Vol. 82, Very Long Baseline Interferometry and the VLBA. PASP, San Francisco, p. 268
- (14) Pettersen B.R. 1980, A&A 82, 53
- Sturrock et al. (1996) Sturrock P. A., Wheatland M. S., Acton L. W. 1996, ApJ 461, L115
- White et al. (1989) White S. M., Kundu M. R., Jackson P. D. 1989, A&A 225, 112