The CIDA-QUEST Large Scale Variability Survey in the Orion OB Association: initial results
Abstract
Using the CCD Mosaic Camera on the 1m Schmidt telescope in Venezuela, we are conducting a large-scale, deep optical, multiepoch, photometric (BVRIH) survey over in the Orion OB association, aimed at identifying the low mass stellar populations with ages 10 Myr.
We present initial results for a area spanning Orion 1b, 1a and the B Cloud. Using variability as our main selection criterion we derive much cleaner samples than with the usual single-epoch photometric selection, allowing us to attain a much higher efficiency in follow up spectroscopy and resulting in an preliminary list of 74 new low-mass () pre-main sequence stars.
Astronomy Department, Yale University, New Haven, CT 06511
Harvard-Smithsonian Center for Astrophysics, Cambridge, MA 02138
1. Introduction
Crucial aspects of theories of star formation can only be tested by studying the stellar populations both in and near molecular clouds. While the earliest stages of stellar evolution must be probed with infrared and radio techniques, many important questions can only be studied with optical surveys of older populations with ages 3-20 Myr.
In the past, studies of OB associations have been used to investigate sequential star formation and triggering on large scales (e.g., Blaauw 1991 and references therein). However, because OB stars are formed essentially on the main sequence (e.g., Palla & Stahler 1992) and evolve off it in Myr, they are not useful for infering star-forming histories on timescales of 1-3 Myr. Moreover, it is not possible to study cluster structure and dispersal or disk evolution without studying low-mass stars. Studies of individual clusters in the optical and IR have been made (cf. Lada 1992), but these are biased toward the highest-density regions, and cannot address older and/or widely dispersed populations.
Recent technological advances have now made it possible to carry out large-scale studies, building on the availability of cameras with multiple CCDs on telescopes with wide fields of view.
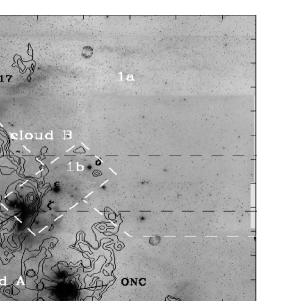
Figure 1 is shows the Orion A and B clouds and surroundings which we propose to survey. The Orion belt stars, , , and , are shown for reference. The prominent bright emission nebulae are the Orion Nebula (ONC), NGC 2023, and NGC 2024 clusters, marking the sites of very recent star formation. Also indicated are the OB associations in the region (Blaauw 1964): Ori 1b and Ori 1a. Ori 1d corresponds to the Trapezium/ONC region; Ori 1c is the region surrounding it. Photometric analysis of the O, B and A stars (Warren & Hesser 1977, 1978; Brown et al 1994, BGZ) indicate ages of Myr (1d, see also Hillenbrand 1997), 3 Myr (1c), 7 Myr (1b), and 12 Myr (1a). The latest results from Hipparcos (de Zeeuw et al 1999) yield mean parallaxes corresponding to 330 pc (1a), 440 pc (1b), and 460 pc (1c), with an uncertainty of 30%.
2. The Photometric Variability Survey
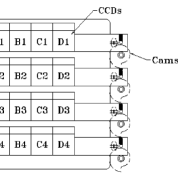
The large scale, multiband (BVRIH), multi-epoch, deep photometric survey over in Orion (Figure 1) is being carried out using the QuEST111 C. Abad, B. Adams, P. Andrews, C. Bailyn, C. Baltay, A. Bongiovanni, C. Briceño, V. Bromm, G. Bruzual, P. Coppi, F. Della Prugna, N. Ellman, W. Emmet, I. Ferrín, F. Fuenmayor, M. Gebhard, R. Heinz, J. Hernández, D. Herrera, K. Honeycutt, G. Magris, J. Mateu, S. Muffson, J. Musser, O. Naranjo, H. Neal, G. Oemler, R. Pacheco, G. Paredes, M. Rangel, A. Rengstorf L. Romero, P. Rosenzweig, Ge. Sánchez, Gu. Sánchez, C. Sabbey, B. Schaefer, H. Schenner, J. Shin, J. Sinnott, J. Snyder, S. Sofia, J. Stock, J. Suárez D. Tellería, W. van Altena, B. Vicente, K. Vieira , A. K. Vivas11footnotetext: The QuEST (Quasar Equatorial Survey Team) collaboration includes Yale University, Indiana University, Centro de Investigaciones de Astronomía, and Universidad de Los Andes (Venezuela). The main goal of QuEST is to perform a large scale survey of quasars. camera, a CCD mosaic detector installed on the 1m (clear aperture) Schmidt telescope at Llano del Hato Observatory, in the Venezuelan Andes ( N, 3610 m elevation). The 16 UV-enhanced, front illuminated, Loral CCD chips are set in a 4x4 array (Figure 2, left), covering most of the focal plane of the Schmidt telescope, yielding a scale of 1.02” per pixel and a field of view of . The camera is optimized for drift-scan observing in the range : the telescope is fixed and the CCDs are read out E-W at the sidereal rate as stars drift across the device, crossing each of the four filters in succession. This procedure generates a continuous strip (or “scan”) of the sky, wide; conversely, one can survey the sky at a rate of , down to ().
2.1. Data reduction and analysis
QuEST has developed its own software since the huge amount of data produced is very difficult to handle with packages such as IRAF. The whole process is completely automated with minimum interaction from the user. The output catalogs contain, among others, J2000.0 positions, instrumental and calibrated magnitudes in 4 bands, and their corresponding errors. Positions are good to down to V, within a few square degrees.


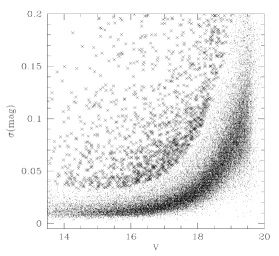
We have developed tools for identifying variable stars using differential photometry. Using a test and assuming a Gaussian distribution for the errors, we consider variable only those objects for which the probability that the observed distribution is a result of the random errors is very small. In Figure 2, right, we show a sample result from the variability analysis in the wide strip indicated in Figure 1. The dispersion increases for fainter objects, so that most (non-variable) objects populate a curved region. We use the test to identify potential variable stars with a 99.99% confidence level (crosses in Figure 2).
3. Results
During Dec.98 - early Feb.99, we obtained 16 BVRI scans over the strip indicated in Figure 1. We calibrated a ‘master’ scan using Landolt (1992) standard fields and then normalized the photometry in all the other scans to this reference scan.
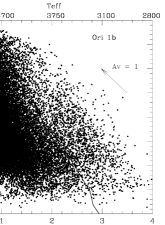
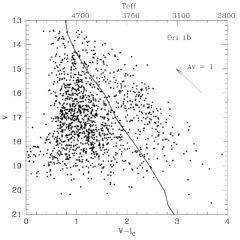
The value of variability for picking out pre-main sequence (PMS) candidates is shown in Figure 3. The upper left panel is a color-magnitude diagram with all the stars in a area within Ori 1b (the ZAMS at 440 pc is shown for reference); the upper right panel shows the variables in the same field, picked out using our selection criteria. Populations above and below the ZAMS are clearly separated using our variability criteria. Indeed, the only 5 known TTS in this region (Herbig & Bell 1988) were all recovered as variables. We also compared our data with the Kiso H survey (c.f. Wiramihardja et al. 1993) and found that the vast majority of H stars above the ZAMS are detected as variables (%), but essentially none of the ones below are (they could be a mixture of field dMe stars and some false detections; c.f. Briceño et al. 1999).
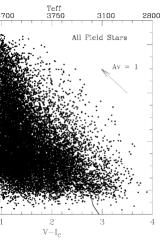
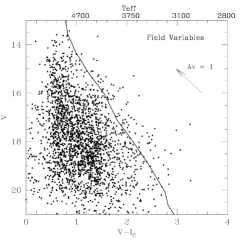
To emphasize the point even further, in the lower panels of Figure 3 we show color-magnitude diagrams for field stars (, ), showing clearly that the tail of the distribution of background stars extends far above the main-sequence, while variables show essentially no population of PMS objects.
We have initiated followup spectroscopy of the brighter (V ) variable PMS candidates (Fig.3b), using the FAST spectrograph (Fabricant et al. 1998) on the 1.5m telescope at SAO, with a spectral resolution of 6Å in the range 4000 - 7000Å. We confirm low mass PMS stars based on the presence of emission in H and other lines, and of Li IÅ strongly in absorption, which is a reliable indicator of youth in K4-K5 and later spectral type stars (c.f. Briceño et al. 1997). Even at this low resolution, Li I can be seen in late type stars with high SNR spectra (Figure 4). In this way, we have obtained spectra for 157 candidates and confirmed 74 of them as new TTS. We are now placing these objects in the HR diagram to derive their masses and ages. This high (%) efficiency is the result of the clean selection provided by the variability criterion.
The new TTS have spectral types K7 - M2, corresponding to masses roughly at Myr. Though preliminary, this list of new TTS already suggests that the fraction of CTTS in 1a is much lower than in 1b, which would be expected if 1a is indeed older than 1b. We are analyzing in detail the light curves of these new stars, and spectroscopy of further candidates is under way.
This is the first optical survey to approach in spatial extent studies of extended star-forming regions (near the galactic plane, not reached by SDSS) done by other surveys like the RASS and 2MASS, but going much deeper than the RASS and having simultaneous photometry over several optical bandpasses for many epochs, providing a unique variability database that one-time surveys like 2MASS cannot not offer.
References
Blaauw, A. 1964, ARAA, 2, 213
Blaauw, A. 1991, in The Physics of Star Formation and Early Stellar Evolution, eds. C. Lada and N.D. Kylafis, (Dordrecht: Kluwer), p. 125
Briceño, C., Hartmann, L., Stauffer, J., Gagne, M., Caillault, J.-P., & Stern, A. 1997,
Briceño, C., Calvet, N., Kenyon, S., & Hartmann, L. 1999, AJ, 118, 1354
Brown, A., de Geus, E.J., & de Zeeuw, P.T. 1994, AA, 289, 101
de Zeeuw, K., Hoogerwerf, R., de Bruijne, J., Brown, A., & Blaauw, A. 1999, AJ, 117, 354
Fabricant, D., Cheimets, P., Caldwell, N. & Geary, J. 1998, PASP, 110, 79
Herbig, G.H., & Bell, K.R. 1988, Lick Obs. Bull. 1111
Hillenbrand, L. 1997, AJ, 113, 1733
Lada, E. 1992, ApJ, 393, 25
Maddalena, R., Morris, M., Moscowitz, J., & Thaddeus, P. 1987, ApJ, 303, 375
Palla, F., & Stahler, S.W. 1992, ApJ, 392, 667
Warren, W.H., & Hesser, J.E. 1977, ApJS, 34, 115
Warren, W.H., & Hesser, J.E. 1978, ApJS, 36, 497
Wiramihardja, S., Kogure, T., Yoshida, S., Ogura, K., & Nakano, M. 1993, PASJ, 45, 643