The radio source B 1834+620: A double-double radio galaxy with interesting properties
Abstract
We present a study of the peculiar radio galaxy B 1834+620. It is characterised by the presence of a 420-kpc large edge-brightened radio source which is situated within, and well aligned with, a larger (1.66 Mpc) radio source. Both sources apparently originate in the same host galaxy, which has a -magnitude of 19.7 and a redshift of 0.5194, as determined from the strong emission-lines in the spectrum. We have determined the rotation measures towards this source, as well as the radio spectral energy distribution of its components. The radio spectrum of the large outer source is steeper than that of the smaller inner source. The radio core has a spectrum that peaks at a frequency of a few GHz. The rotation measures towards the four main components are quite similar, within rad m-2 of 58 rad m-2. They are probably largely galactic in origin. We have used the presence of a bright hotspot in the northern outer lobe to constrain the advance velocity of the inner radio lobes to the range between and , depending on the orientation of the source. This corresponds to an age of this structure in the range between 2.6 and 5.8 Myr. We estimate a density of the ambient medium of the inner lobes of gr cm-3 (particle density cm-3). A low ambient density is further supported by the discrepancy between the large optical emission-line luminosity of the host galaxy and the relatively low radio power of the inner lobes.
keywords:
galaxies: active – galaxies: individual: B 1834+620 – galaxies: jets – radio continuum: galaxies1 Introduction
Powerful radio galaxies of type FRII (Fanaroff & Riley 1974) are characterized by extended radio lobes with leading compact, bright features, the so-called ‘hotspots’, and often a compact central radio core. It is almost certain now that the extended lobes are formed by two relativistic jets emerging from a supermassive black hole at the center of a massive galaxy (e.g. Scheuer 1974; Blandford & Rees 1974). The large size that these radio sources can obtain indicates that the jet formation proces must be a long-lived (though not necessarily continuous) phenomenon. Estimated ages for extended radio sources reach up to yr (e.g. Alexander & Leahy 1987). Also, the elongated structure of FRII-type radio galaxies and the relative straightness of the sometimes observed radio jet indicates that the direction of the outflow is relatively stable during the activity time.
Schoenmakers et al. (1999, hereafter Paper I) have presented a small number of sources which consist of two pairs of double-lobed radio sources which are well aligned and apparently hosted by the same galaxy. Because of their peculiar radio morphology, they proposed to call these ‘double-double’ radio galaxies (DDRGs). Schoenmakers et al. conclude that the most likely mechanism to explain these properties is a interruption of the central jet producing mechanism. Kaiser, Schoenmakers & Röttgering (1999, hereafter Paper II) have elaborated such a restarted jet scenario. They find that the density in the ‘old’ cocoons hosting the outer radio lobes is too low to explain the currently observed inner radio structures, and they conclude that some material from the outside must have penetrated the ‘old’ cocoon and thus increased its density. Kaiser et al. (1999) find that warm ( K) clouds embedded in the hot ( K) InterGalactic Medium (IGM) are probably able to survive the passage of the bowshock trailing the expansion of the ‘old’ cocoon and will penetrate into the cocoon, where they will be shredded on timescales of order yr. This may increase the density of the cocoon to the values necessary to explain the radio properties of the inner structures.
The radio source B 1834+620 is one of the sources first presented in Paper I and, since it was the first DDRG to be discovered by us, it has been the subject of several follow-up studies. In this paper we report on our radio and optical observations of it. In Sect. 2 we present our radio and optical data. Section 3 presents the main results obtained from these observations. In Sect. 4 we estimate the age of the inner source components and derive the density of the medium surrounding the inner structure. Our conclusions are presented in Sect. 5.
We use km s-1 Mpc-1 and throughout this paper. A radio spectral index is defined as . The radio contour maps presented in this paper have been rotated by 30 degrees in a counter-clockwise (CCW) direction, unless indicated otherwise.
| Freq. | Date | Instr. | Survey | Beam | rms | |
|---|---|---|---|---|---|---|
| 325 | Jan. 1991 | WSRT | WENSS | 54.0 | 61.1 | 3.0 |
| 612 | Dec. 1990 | WSRT | WENSS | 28.0 | 31.7 | 3.0 |
| 840 | Mar. 1998 | WSRT | 20.7 | 23.9 | 0.4 | |
| 1395 | Feb. 1995 | WSRT | 27.7 | 10.1 | 0.3 | |
| 1400 | Apr. 1995 | VLA-D | NVSS | 45.0 | 45.0 | 0.45 |
| 1435 | Jan. 1997 | VLA-A | 1.49 | 1.03 | 0.07 | |
| 4850 | Jun. 1998 | VLA-BnA | 1.00 | 0.70 | 0.06 | |
| 8460 | Aug. 1996 | VLA-D | 8.44 | 6.17 | 0.06 | |
2 Observations
In this section we present radio and optical observations of B 1834+620. Details of the radio observations presented here can be found in Tab. 1.

2.1 WENSS and NVSS data
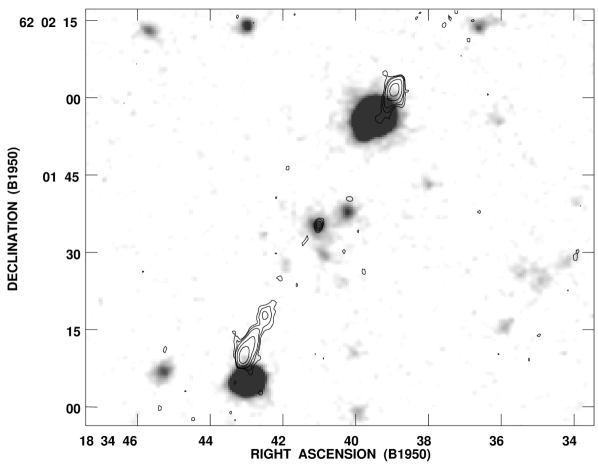
The WENSS survey (Rengelink et al. 1997) has mapped the sky northwards of Dec. at 325 MHz. About a third of that area has also been observed at 612 MHz. B 1834+620 is situated in one of the early regions of the WENSS, the so-called ‘Mini-Survey’ region which has been observed at both frequencies. A total intensity radio map of B 1834+620 at 612 MHz is presented in Fig. 1a. Its radio morphology resembles that of ‘four beads on a string’. The four components are well aligned and have a quite similar brightness and spacing. Since the beam size of the WSRT at 325 MHz is twice as large it does not reveal new details and therefore we do not show a radio map of the source at this frequency. The WENSS has also observed linear polarization. Because of large, hour-angle dependent ionosperic Faraday effects no reliable linear polarization could be measured at 325 MHz.
B 1834+620 has also been observed during the NRAO VLA Sky Survey (NVSS, Condon et al. 1998) which has been conducted at 1400 MHz at comparable resolution to the WENSS. The NVSS supplies maps of the Stokes’ and parameters, which we have used to map the linear polarized intensity. See Fig. 1b for a 1.4-GHz radio contourmap with polarized intensity vectors overplotted. We find that at this frequency the position angles of the observed -field polarization vectors differ by between the northern and the southern half of the source.
2.2 WSRT observations
2.2.1 1.4-GHz observations
We have observed B 1834+620 at two frequencies with the WSRT. First, we have obtained a short observation at 1.4 GHz, with 6 integrations of 4 min. each at different hour-angles. The total bandwidth was 60 MHz and was centered at 1395 MHz. The telescope gains were calibrated to the flux density scale of Baars et al. (1977) using 3C 286 as primary calibrator. The data have been processed and mapped using the NFRA newstar package. The non-uniform -coverage of these observations has resulted a highly elliptical beam-shape. However, the minor axis of this beam is almost parallel to the radio axis of the source, and so we are able to separate the four main components. Linear polarization has been detected towards these, with similar polarization angles as in the NVSS-data. The fractional polarizations are 10% (northern outer component), 21% (northern inner component), 20% (southern inner component) and 13% (southern outer component). We show no radio maps of these observations; as a result of the sparse sampling of the -plane the 1.4-GHz observations reveal no new details.
2.2.2 840-MHz observations
To investigate the polarization at a frequency in between the WENSS 612-MHz and NVSS observations we have used the WSRT with the recently installed UHF-High frontends at frequencies around 840 MHz (-cm wavelength). We have integrated for 12 hr on March 31, 1998. Of the eight 10-MHz channels, four suffered from severe interference and could not be used at all. The remaining four channels are centered at 815, 845, 865 and 875 MHz. Gain and phase calibration was obtained by observations of 3C 48 and 3C 286. We used the flux density scale of Baars et al. (1977) for absolute gain calibration. The data were calibrated and mapped using the NFRA newstar data-reduction package. The morphology of the source in the 840-MHz map closely resembles that in the 612-MHz map shown in Fig. 1a and therefore we do not show it.
2.3 VLA observations
2.3.1 8.4-GHz observations
We observed B 1834+620 with the VLA in its D-configuration on August 3, 1996. Two standard 50 MHz bands were used, centered at 8435 MHz and 8485 MHz. The total integration time was 25 minutes. The telescope gains were calibrated on the Baars et al. (1977) scale using 3C 147 and 3C 286 as primary flux density calibrators. The source J1845+401 was used as phase calibrator. The polarization angles have been calibrated using 3C 286 as reference source.
The data have been reduced and mapped using the nrao aips software package. After initial cleaning, several self-calibrations were performed to improve the data-quality. The total intensity map, corrected for primary beam attenuation, is shown in Fig. 2a with -field polarization vectors overplotted on the total intensity contours.
A radio core is clearly detected in between two bright and only slightly resolved inner components. The two outer components have been resolved and have a morphology similar to edge-brightened FRII-type radio lobes.


2.3.2 1.4-GHz observations
To map of the inner components and the outer radio lobes in more detail, we have used the VLA in its A-configuration at 1435 MHz. To avoid bandwidth smearing at the outer edges of the source, we have used the spectral line mode with 8 channels of 3.125 MHz bandwidth each, resulting in a total bandwidth of 25 MHz. We further used the full polarization mode to map the linear polarization at high resolution. The telescope gains were calibrated using the primary calibrator 3C 286 and set to the scale of Baars et al. (1977). For phase calibration, we have used several observations of the source J1845+401. The total on-source integration time was minutes. One of the channels had to be flagged because of poor data quality. The data of the remaining channels were then combined into a single dataset. Total and polarized intensity maps have been made after several passes of clean and self-calibration.
The inner components resemble FRII-type radio lobes (see Fig. 2b). The southern inner lobe somewhat resembles the southern outer lobe, as observed at 8.4 GHz (Fig. 2a). The radio core is well detected and is unresolved. By fitting it with a Gaussian (using the jmfit program in aips) we find that its B1950.0 position is in Right Ascension and in Declination.
The northern outer lobe (see Fig. 3a) has a bright compact hotspot, which is not reproduced in the southern lobe. At the resolution of these observations the ratio of peak flux density of the northern to the southern hotspot is 19.3 .
2.3.3 5-GHz observations
The inner structure has been mapped at 5 GHz with the VLA in its BnA configuration on June 28, 1998. We observed B 1834+620 for 20 minutes. The data were calibrated using 3C 48 as primary flux density calibrator. After initial mapping, several passes of phase selfcalibration were made. The final map is somewhat degraded due to the presence of the large outer lobes, which we were not able to map accurately at the large bandwidth of these observations. The inner structure has been mapped at almost twice the resolution of the 1.4-GHz VLA observations (see Fig. 2c). The southern inner lobe reveals a leading hotspot, while the northern inner lobe remains rather featureless. The core remains unresolved.
2.4 Identification of the host galaxy
We have examined an optical image from the Digitized Sky Survey (DSS) to search for the host galaxy of B 1834+620. However, at the position of the radio core no optical counterpart could be identified. Therefore, an optical CCD image has been taken with the 3-m Shane telescope at Lick observatory on April 19th 1996. The images have been taken using the direct imaging mode on the KAST spectrograph, equipped with a Reticon CCD at a spatial scale of /pixel. A Rs-filter has been used, which is designed to suppress the Sodium background illumination caused by urban areas (e.g. Djogorvski 1985). Four exposures of 2 minutes each have been made, each shifted by in either Right Ascension or Declination to allow cosmic ray and bad pixel removal. The total integration time is therefore 8 minutes. For flux calibration the photometrical standard star Feige 34 has been observed (Djorgovski 1985). The seeing during these observations was . The astrometry has been fixed using several stars in the field whose coordinates have been measured on the DSS with an accuracy of . An overlay of the optical image with the 1.4-GHz VLA observations (see Fig. 4) shows that the host galaxy is the brightest member of an apparently compact group of three objects. A similar image in shown by Lara et al. (1999). The Rs magnitude of the host galaxy, integrated in a circular aperture with a radius of centered on the peak of maximum intensity, is . The two nearby galaxies have Rs-magnitudes of and . Since their separation from the host galaxy is only a few arcsecond (i.e. a few tens of kpc at the redshift of the source), it is very likely that they belong to the same group.
The amount of galactic extinction towards the host galaxy is small. We have measured the Hi column density, , in the Leiden-Dwingeloo Hi-survey (Hartmann 1994). We find cm-2. Using a conversion factor of cm-2 mag-1 (Burstein & Heiles 1978) we find , and therefore the galactic absorption in the Rs-band yields mag. If we correct the magnitude of the host galaxy for galactic extinction we thus find R mag.
2.5 Optical spectroscopy
To obtain a spectrum of the host galaxy we have used the 2.5-m INT telescope on La Palma on April 8th, 1996. We have used the IDS spectrograph with the R300V grating, equipped with a 1k1k TEK chip. In this setup, one pixel on the CCD corresponds to 3.32Å in the dispersion direction, and in the spatial direction. We used a central wavelength of 6000Å and a slitwidth of projected on the sky, yielding a resolution of Å. The seeing during these observations was . We have aligned the slit over the two bright starlike objects at R.A. , Dec. and R.A. Dec. (B1950.0), since the host galaxy is situated exactly on the line connecting these two stars (see Fig. 4). Two 600-s exposures have been taken at a mean airmass of 1.25 . These have been averaged to obtain the final spectrum and to enable cosmic ray removal. Wavelength calibration was done by observations of internal arc-lamps, and checked against several bright skylines. Flux calibration was obtained by observations of several spectrophotometrical standard stars during the night. The datareduction was done using the longslit package in the nrao iraf data reduction software. We have extracted the spectrum of the host galaxy and the two star-like objects in a -wide spatial aperture. The star-like objects indeed had stellar spectra, ruling out any possible connection with the radio source. The spectrum of the host galaxy is dominated by the Oii3727 and Oiii4959,5007 emission lines. The Oiii5007-line lies in an atmospheric absorption band. We corrected for this absorption by fitting the continuum of the northern bright star by a low-order polynomial and by subsequently dividing the spectrum of the galaxy by the normalized ratio of this fit and the observed spectrumn of that star. We have corrected for galactic extinction using an of 0.08, as found in the previous section. The resulting spectrum is shown in Fig. 5.
We have measured the positions and flux densities of the indicated emission lines (see Tab. 2). We find a mean redshift of the emission lines of . This is somewhat higher than the redshift of 0.518 quoted by Lara et al. (1999), who used slighty lower resolution spectral data. From the measured flux densities we have calculated the emitted powers, assuming isotropic emission. The results are presented in Tab. 2. At a redshift of 0.5194 the size of the aperture used in the extraction corresponds to a physical aperture of kpc, and should thus contain most of the optical galaxy. We find that the total contribution of the emission lines to the measured Rs-magnitude of the host galaxy is , or mag. The image of the host galaxy is thus dominated by star light, and not by emission-line gas.

| Line | FWHM | Flux | Power | ||
| Å | km s | erg s-1 cm | erg s | ||
| Nev3426 | 5206.6 | 0.5197 | 3.80 (0.20) | 1.46 (0.08) | |
| Oii3727 | 5663.3 | 0.5195 | 13.7 (0.3) | 5.25 (0.11) | |
| Neiii3869 | 5878.8 | 0.5195 | 4.50 (0.27) | 1.72 (0.10) | |
| H4340 | 6593.4 | 0.5192 | 2.34 (0.19) | 0.90 (0.07) | |
| H4861 | 7385.9 | 0.5194 | 6.29 (0.16) | 2.41 (0.06) | |
| Oiii4959 | 7534.4 | 0.5193 | 294 | 23.7 (0.2) | 9.08 (0.08) |
| Oiii5007 a | 7607.2 | 0.5193 | 283 | 63 (13) | 24 (5) |
Notes:
a This line coincides with an atmospheric absorption band for which we corrected using a stellar spectrum (see the text for details). We estimate that the resulting values are accurate to 20%.
3 Results
In this section we present and discuss the results of our radio observations. We will discuss the morphology, flux densities, radio spectrum and polarization properties of B 1834+620.
3.1 Radio morphology and linear size
The 1.4 and 8.4-GHz VLA observations show that the outer components of B 1834+620 have a FRII-type radio morphology. The northern outer lobe possesses a bright compact hotspot at its head. The extended lobe regions behind the head of the lobes are quite similar on both sides of the source, in terms of morphology, surface brightness distribution and polarization structure.
The most interesting features are the bright inner components. The 1.4 and 5-GHz VLA observations show that these are FRII-type radio lobes. They are situated very symmetrically about the radio core. The misalignment of the radio axis determined by the inner components (the ‘inner’ radio axis) with that determined by the outer components (the ‘outer’ radio axis) is only . The radio morphology of the southern inner lobe in our 1.4-GHz VLA observations is remarkably similar to that of the southern outer lobe as seen in the 8.4-GHz VLA map (see Fig. 2).
The total angular size of B 1834+620 is 230 arcsec. At a redshift of 0.5194 this corresponds to a projected linear size of 1660 kpc. B 1834+620 is the third largest radio source known at , after 8C 0821+695 at with a projected linear size of 3.0 Mpc (Lacy et al. 1993) and the quasar HE 1127-1304 which has a projected linear size of 2.4 Mpc (Bhatnagar, Gopal-Krishna & Wisotzki 1998).
3.2 Armlength asymmetries
The overall morphology of B 1834+620 is very symmetrical. To measure the armlength-ratio of the outer lobes, we use the 1.4-GHz VLA map. We find that the distance from the core to the hotspot in the outer southern lobe is larger than that to the hotspot in the northern outer lobe ( versus ). The armlength ratio, defined here as the ratio of the separation between the core and the farthest hotspot to that of the core and the nearest hotspot, is . For the inner lobes we find an armlength ratio of with the northern lobe being the more distant one. The inner structure is therefore slightly more asymmetrical as the outer structure, and the asymmetry is opposite in sense.
| Freq. | Total | North | South | Core | ||||||||
|---|---|---|---|---|---|---|---|---|---|---|---|---|
| Inner | Outer | Inner | Outer | |||||||||
| MHz | Jy | mJy | mJy | mJy | mJy | mJy | ||||||
| 38a | 19.1 | 1.9 | ||||||||||
| 151b | 5.6 | 0.6 | ||||||||||
| 327c | 2.96 | 0.06 | ||||||||||
| 612d | 1.67 | 0.04 | 309 | 7 | 573 | 12 | 422 | 9 | 357 | 8 | ||
| 845e | 1.22 | 0.03 | 228 | 5 | 435 | 9 | 298 | 6 | 259 | 5 | ||
| 1395f | 0.72 | 0.04 | 136 | 7 | 254 | 13 | 176 | 9 | 152 | 8 | ||
| 1400g | 0.80 | 0.02 | 144 | 3 | 275 | 6 | 198 | 4 | 177 | 4 | ||
| 1435h | 77.2 | 2.2 | 122.1 | 3.6 | 1.52 | 0.08 | ||||||
| 4850i | 0.24 | 0.02 | 30.9 | 1.0 | 51.0 | 1.2 | 1.70 | 0.10 | ||||
| 8460j | 0.14 | 0.01 | 19.4 | 0.4 | 53.0 | 1.1 | 29.1 | 0.6 | 32.3 | 0.7 | 1.04 | 0.08 |
Notes: a - 8C survey (Rees 1990, catalogue revised by Hales et al. 1995); b - 6C survey (Hales et al. 1991); c - WENSS 92cm; d - WENSS 49cm; e - Our WSRT observation; f - Our WSRT observation; g - NVSS; h - Our VLA observation; i - Total flux density: GB6 survey (Gregory et al. 1996, but measured in the map), individual components: Our VLA observations; j - Our VLA observations.

3.3 Flux densities and spectral indices
We have collected flux densities of B 1834+620 at a variety of frequencies, using our own radio data and data from the literature. The results are presented in Tab. 3. For those components that have been measured at similar resolution by Lara et al. (1999), our results agree very well with theirs.. A plot of the radio spectrum is given in Fig. 6, where we have differentiated between various source components wherever the data allowed us to do so. The spectrum of the radio core has a convex shape, resembling the spectrum of Gigahertz Peaked Spectrum (GPS, e.g. Spoelstra et al. 1985) sources. Such convex shapes at GHz-frequencies are often found for weak cores in radio galaxies and probably indicates that they are very compact (e.g. Rudnick, Jones & Fiedler 1986).
The spectra of the inner components steepen between 5 and 8.4 GHz: The spectral index of the southern inner component changes from to , that of the northern inner component from to . Between 1.4 and 5 GHz, the spectra of the inner components are flatter than that of the source as a whole (). The outer components are too heavily resolved to allow an accurate flux density measurement in our 1.4 and 5-GHz VLA data. However, subtracting the flux density of the inner lobes and the core from the integrated flux density yields the sum of the flux densities of the two outer lobes. The spectral index of the outer components alone, determined by fitting these three flux density measurements, is . The inner components are barely resolved at 1.4 GHz; therefore we have not mapped the spectral index distribution in these source components.

The flux density contrast between the hotspots in the outer two lobes appears to be quite large (see Fig. 3). To investigate how it compares to that of other radio sources, we have used the data of Hardcastle et al. (1998). They present the flux density at, mainly, 8.4 GHz of the primary (i.e. brightest) hotspot in the two radio lobes of an almost complete sample of FRII-type radio galaxies from the 3CR catalogue. We define the flux density ratio of the hotspots, , in their sample by dividing the flux density of the brightest hotspot by that of the weakest. We find a median value of of . Due to the generally small asymmetry in hotspot spectral index within a single source, we expect that will not be much different when measured at 1.4 GHz. In Fig. 7 we have plotted the hotspot flux density ratio against the radio lobe flux density ratio, , defined as the ratio of the flux density of the lobe with the brightest hotspot to that of the lobe with the weakest hotspot. We subtracted the contribution from the hotspot in each lobe first. The open triangles are sources from the sample of Hardcastle et al. and are measured mostly at 8.4 GHz. From our 1.4-GHz VLA observations we measure a ratio of hotspot flux density in the outer lobes of B 1834+620 of . This has been indicated by the filled star in the figure.
We find that, in general, the asymmetries in the hotspot flux densities are larger than those in the lobe flux densities. This confirms earlier results obtained by, e.g., Macklin (1981). Further, we find that the hotspot flux density in B 1834+620 is among the largest observed in FRII-type radio sources.

3.4 Depolarization and Rotation Measures
We find that the degree of polarization of the inner lobes is independent of the used beam-size (see Tab. 4). Both the 1.4-GHz VLA observations (beamsize FWHM) and the WSRT (beamsize FWHM) measure equal fractional polarizations, despite the fact the the VLA observations have resolved the inner structure and the WSRT observations not. This implies that the observed polarization structure is quite uniform, and that any external Faraday rotation must be occuring on angular scales comparable to or larger than the WSRT beam. Also, we find no evidence for significant depolarization between 8.4 and 1.4 GHz towards the inner lobes. This agrees with the results by Lara et al. (1999).
Using the WENSS 612-MHz, the WSRT 840-MHz, the NVSS 1.4-GHz and the VLA 8.4-GHz observations we have determined the rotation measures (RM) towards the four main components of B 1834+620. We have mapped the 612 and 840-MHz WSRT data using a Gaussian -taper of 1166 and 841m, respectively, to match them with the NVSS data. The VLA 8.4-GHz maps have been convolved to the NVSS resolution. Since artefacts may arise from this we have given this data little weight in determining the rotation measure.
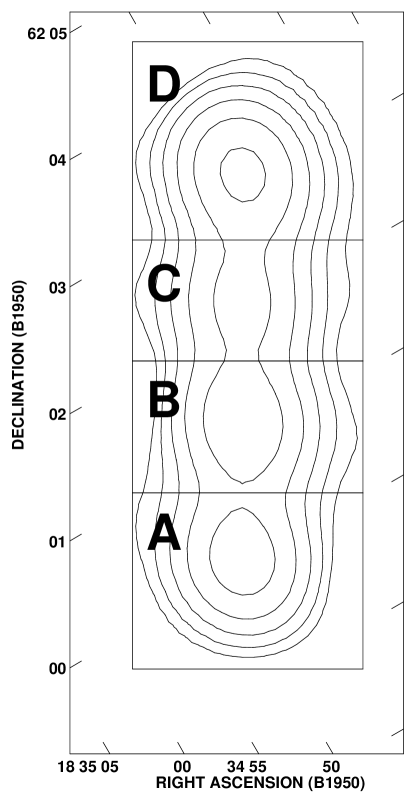
We have defined four rectangular areas (see Fig. 8) in which we have integrated the Stokes’ and flux at each frequency. The 840-MHz WSRT observations have four separate channels, so that for each rectangular area we have box-averaged polarization angles at 7 different frequencies. The RMs have been determined by a least-squares linear fit of the polarization angles to , where is the wavelength of the observation. The data points and their best fits are shown in Fig. 9.
The found RMs roughly range from to rad m-2. These numbers agree with the lack of a detectable change in polarization angle of the inner structures between the different channels of our 1.4-GHz VLA data. We note that the large RM-values ( rad m-2) found by Lara et al. (1999) must be wrong. If the RM were that large, we would have seen a significant change in the polarization angle between the different channels in our 1.4 GHz observations ( per channel, or 25°over the whole range). We would also have suffered from severe bandwidth depolarization in the 612-MHz data. Further, the change in the polarization angle measured between the separate channels in the 840-MHz data are not reconcilable with such a large value of RM. We therefore believe are our values are the correct ones. If this is indeed true, the polarization angles in the 5 GHz data of Lara et al. (1999) are wrong by almost exactly 90°.
The small differences in RM that we measure vbetween the different components suggest that the major contribution to the rotation is galactic in origin, and not intrinsic to the radio source. The low amount of variation of the RM over the source, and the lack of depolarization towards the inner structure at 1.4 GHz, suggest the presence a low density environment around the radio source. The largest RM contrast is that between components B and D, and is only rad m-2.
| Freq | Instr. | North | South | ||
|---|---|---|---|---|---|
| MHz | |||||
| 1395 | WSRT | 20.7 | 0.8 | 19.9 | 0.8 |
| 1435 | VLA | 21.9 | 0.7 | 20.7 | 0.7 |
| 8460 | VLA | 19.1 | 0.7 | 18.7 | 0.7 |
4 Discussion
We will discuss the results of the observations assuming that the inner structures have formed after an interruption of the jet formation in the AGN, as discussed in Papers I & II. We will investigate how the emission line properties relate to the observed radio properties, and we will estimate the time scale of the interruption. Also, we will estimate the age of the inner structures, their advance velocities and the density in their ambient medium.
4.1 Emission-line luminosity and line-ratios
Tadhunter et al. (1998) have investigated the optical to radio correlations of a complete sample of powerful radio galaxies in the redshift range between 0.1 and 0.7 . Their results agree well with earlier results, in that there is a significant correlation between the radio power and the emission-line luminosity of these radio sources. Since the optical spectrum of B 1834+620 shows strong emission lines, one would expect that the associated radio source is quite powerful. If we assume that the AGN is currently only feeding the inner radio structure, we have to compare the optical properties of the AGN with the radio properties of the inner structure alone.
Following Tadhunter et al., we have calculated the total radio power, , of the inner structure and find erg s-1. Comparing the luminosity of the optical emission lines (see Tab. 2) and the radio power of the inner structure of B 1834+620 with those of the sources in Tadhunter et al., we find that the radio power is an order of magnitude too low to account for the observed emission-line luminosity. This is also the case when we compare the Oiii5007/Oii3727 line ratio with the radio power. On the other hand, when we compare the Oiii5007/Oii3727 line ratio with the emission-line luminosity of Oiii5007, Oii3727 and H, we find no discrepancies between B 1834+620 and the sources presented in Tadhunter et al. It indicates that the physical conditions, such as the density and ionization state, in the narrow-line region of the host galaxy of B 1834+620 must be quite similar to those in more radio-powerful narrow-line radio galaxies. This, and the high emission-line luminosity, strongly suggests that the energy output of the AGN is comparable to that of radio sources which are an order of magnitude more radio-luminous. In case of B 1834+620 this hints towards a low efficiency for the transformation of jet energy into synchrotron radiation. A low density of the environment of the inner lobes may account for this.
4.2 The time scale of the interruption of the jet
Under the assumption that the inner structures have formed after an interruption of the jet formation in the AGN we can constrain the length of time of the interruption in B 1834+620. Since hotspots fade rapidly (within yr, depending on their size; e.g. Paper II) the presence of a bright hotspot in the northern outer lobe implies that it still receives jet material. The travel time of jet material from the core to the northern hotspot, , is , with the physical distance from the core to the hotspot and the velocity of the material flowing down the jet; is probably close the speed of light, , and we will therefore assume it is equal to it. Further, we will assume that the interruption is instantaneous and that the last of the jet material also flows at a velocity of through the jet. This yields Myr, where is the angle between the line of sight and line connecting the core to the northern hotspot. The outer structure of B 1834+620 has a projected linear size of 1660 kpc. This makes it unlikely that the orientation of the radio axis is close to the line of sight. The absence of broad emission lines, a nuclear non-thermal continuum in the optical spectrum or a dominating unresolved QSO in our optical image further indicates that the angle between the radio axis and the plane of the sky is (cf. Barthel 1989). This results in a travel time between 2.66 and 3.76 Myr.
However, because of light travel time effects the orientation of the source complicates matters. If the northern outer lobe is oriented away from us (i.e. ), it will take longer for the information that the last jet material has arrived in the hotspot to reach the observer than if it is oriented towards us. The observed time difference, , between the ejection of the last jet material from the core and its arrival in the outer hotspot is given by Myr. We have plotted as a function of in Fig. 10 (the dot-dashed line). If the jet is interrupted for a time scale which surpasses , the inner structure and the hotspot can not be observed simultaneously. Therefore, the interruption of the jet activity must have lasted less than between 1.1 and 6.4 Myr, depending on the orientation of the radio source. Further, within this length of time, the inner structure must have developed so that even less time is available for the interruption itself.

4.3 The age and velocity of the inner structure
We will assume that the restart of the jet after it has stopped is instantaneous, since this provides a lower limit to the velocity of the inner structure. From the distance between the core and the northern inner lobe, we can calculate its apparent (i.e. projected) advance velocity , where is in units of . The true advance velocity of the inner lobe, , can be found in a way which is equivalent to finding true velocities for superluminal VLBI sources. We find . The projected distance between the core and the northern inner component is 229 kpc or lightyears. Therefore, . The true advance velocity is shown as a function of in Fig. 10.
The allowed advance velocities of the inner structure range between , if is close to , and , if is close to . For reasonable values of , i.e. , we find an advance velocity of the inner structure between and , which translates into an age between 1.9 and 5.8 Myr.
If we assume that the two inner components are advancing equally fast, this should lead to asymmetries in the observed armlength ratio. For the inner structure of B 1834+620 we measure an armlength ratio, , of only . Using , we have plotted In Fig. 10 the expected armlength-ratio as a function of , using as the advance velocity. A value of smaller than 1 indicates that the northern inner lobe is observed closer to the nucleus than the southern inner lobe. We find that under the assumptions we have made, . The advance velocity of the inner structures is then , and their age is Myr.
A second method to constrain the advance velocity of the inner lobes uses the observed large asymmetry in hotspot flux density in B 1834+620 (see Fig. 7). We will assume that the hotspot in the southern outer lobe is weak because no jet material is arriving there anymore, i.e. it has faded. This need not be the case of the observed asymmetry. Other possibilities include variations of the jet power, instabilities in the jet and inhomogeneities in the external medium. The projected distance from the core to the southern outer hotspot is 844 kpc and that to the northern outer hotspot 815 kpc. Therefore, assuming that the termination of the jet production occurs simultaneously on both sides and that jet material travels at the speed of light, the difference in travel-time for the jet material between the two hotspots is Myr. For a distant observer, the light travel-time difference between the northern and the southern hotspot is Myr. Assuming that the northern hotspot is currently still active, implies that the light travel-time difference must be larger than the difference in travel-time of the jet material. This leads to the constraint that , i.e. the northern side of the source must be pointing away from us. For this orientation, the upper limit of the advance velocity of the northern inner lobe is and the corresponding minimal age is Myr. This agrees reasonably with the value determined using the armlength asymmetry. We stress again that all these velocity estimates assume a direct restart of the interrupted jet.
4.4 The density of the environment of the inner structure
Even the lower limit of the advance velocity of the hotspots of is quite high, when compared to such values in other radio galaxies (e.g. Alexander & Leahy 1987). In general, the highest advance velocities are found in the most powerful radio galaxies, but the inner structure of B 1834+620 is only of modest luminosity. This strongly suggests that it must be expanding in an extremely low density environment. We estimate the density of the environment of the inner lobes, , following the method outlined in Daly (1995) and Wellman, Daly & Wan (1997). This assumes that the lobe propagation is ram pressure controlled, so that , with the propagation velocity of the radio lobe and the non-thermal pressure in the radio lobe, which can be estimated from the minimum magnetic field strength . In the inner lobes of B 1834+620 we find G. We note that this is probably an overestimate, since we use the integrated flux of the lobes and this is dominated by the hotspots. Wellman et al. (1997) find that the true magnetic field strength in radio lobes is probably smaller than by a factor of . When we take this into account, we find a non-thermal pressure in the inner lobes of dyn cm-2. Adopting the lower limit on the lobe advance velocity of , which we found earlier, the ambient density gr cm-3. Assuming that the ambient medium of the inner lobes is comparable to an IGM with a mean particle mass of 1.4 amu, we find an ambient particle density of cm-3. Note that this value scales with the inner lobe advance velocity as and therefore strictly is an upper limit. Wellman et al. (1997) find cm-3 for a sample of powerful FRII-type radio sources. This is almost three orders of magnitude above our value. Part of this may be related to powerful FRII-type sources being situated in much denser cluster environments, whereas large sources such as B 1834+620 probably are not. However, this cannot explain a contrast of three orders of magnitude.
In the restarted radio jet scenario (Paper II) the new radio jet is propagating in the old cocoon formed by the first phase of activity. The density inside the cocoon is expected to be much less than the density of the ambient IGM. In Paper II we predict a particle density of cm-3 inside the old cocoon. This is a factor of five above our estimate, which even is an upper limit. Given the high number of assumptions in both our method to find the ambient density and in the model used in Paper II, we do not think this is distressing.
5 Summary and Conclusions
We have investigated the radio structure of the double-double radio galaxy B 1834+620, using a wide variety of frequencies and resolutions. Both the outer and the inner radio lobes have an FRII-type morphology. The northern outer lobe has a bright hotspot, in contrast to the southern outer lobe. The brightness-ratio is , which is rather extreme when compared to values obtained for a nearly complete sample of FRII-type radio galaxies from Hardcastle et al. (1998).
We have obtained an optical spectrum and an -band CCD image of the host galaxy of this peculiar radio source. We find that it is the brightest member of a group of three galaxies. Its -magnitude, corrected for galactic extinction, is . The spectrum shows prominent emission lines for which we measure a redshift of .
As we have argued in Papers I and II, the radio properties of the outer and inner source strongly point towards interrupted jet activity as the cause of the DDRG-strucure. The presence of the hotspot in the northern lobe then limits the length of time of the interruption to the range between 1.1 and 6.8 Myr, depending on the orientation of the source. On geometrical grounds we have estimated the advance velocity of the inner lobes to be in the range of , which corresponds to an age between 1.9 and 5.8 Myr. If we assume that the armlength asymmetry of the inner structure is the result of light travel time effects, the advance velocity of the inner structures must be , and their (observed) age Myr. Similarly, if the southern hotspot has disappeared because of an end to its energy supply, we can constrain the orientation angle between the line of sight and the line connecting the core to the northern hotspot to and set an the upper limit to the velocity of the northern inner lobe of . All these results indicate large advance velocities of the inner structures, much larger than measured in other FRII-type radio sources on size-scales of a few hundred kpc. We estimate the density in the medium surrounding the inner lobes to be gr cm-3 (particle density cm-3), which is a factor of five below the density predicted in Paper II for this source. An extremely low density of the ambient medium of the inner structure is further supported by the contrast between the relatively high luminosity of the optical emission lines, and the low radio power of the inner lobes.
The results presented here strongly suggest that the inner lobes are advancing rapidly in a low density environment, in agreement with the model presented in Paper II. The numbers we find for, e.g., the density of the gas surrounding the inner lobes or the age of the inner structure, do not completely agree with the model predictions, but the difference are always within a factor of two to five. Given the extreme conditions inside the cocoon predicted by the model, we find this not alarming.
Acknowledgments
The INT is operated on the island of La Palma by the Isaac Newton Group in the Spanish Observatorio del Roque de los Muchachos of the Instituto de Astrofisica de Canarias. The Westerbork Synthesis Radio Telescope (WSRT) is operated by the Netherlands Foundation for Research in Astronomy (NFRA) with financial support of the Netherlands Organization for Scientific Research (NWO). The National Radio Astronomy Observatory (NRAO) is operated by Associated Universities, Inc., and is a facility of the National Science Foundation (NSF). This research has made use of the NASA/IPAC Extragalactic Database (NED) which is operated by the Jet Propulsion Laboratory, California Institute of Technology, under contract with the National Aeronautics and Space Administration. We would like to thank B. Clark for scheduling the 8.4 GHz VLA observations and C. de Breuck and W. van Breugel for the Lick observations. H. Sanghera and D. Dallacasa are thanked for their help in the early stages of this project. C. Kaiser, P. Best and M. Lehnert are thanked for many useful discussions. We also thank the referee, J. P. Leahy, for his comments on the manuscript.
References
- [1] Alexander, P., Leahy, J. P., 1987, MNRAS, 225, 1
- [2] Baars, J. W. M., Genzel, R., Pauliny-Toth, I. I. K., Witzel, A., 1977, A&A, 61, 99
- [3] Barthel, P. D., 1989, ApJ, 336, 606
- [4] Bhatnagar, S., Gopal-Krishna, Wisotzki, L., 1998, MNRAS 299, L25
- [5] Blandford, R., Rees, M., 1974, MNRAS, 169, 395
- [6] Burstein, D., Heiles, C., 1978, ApJ, 225, 40
- [7] Cardelli, J. A, Clayton, G. C., Mathis, J. S., 1989, ApJ, 345, 245
- [8] Condon, J. J., Cotton, W. D., Greisen, E. W., Yin, Q. F., Perley, R. A., Taylor, G. B., Broderick, J. J., 1998, AJ, 115, 1693
- [9] Daly, R. A., 1994, ApJ, 426, 38
- [10] Djorgovski, S., 1985, PASP, 97, 1119
- [11] Fanaroff, B. L., Riley, J. M., 1974, MNRAS, 167, 31
- [12] Gregory, P. C., Scott, W. K., Douglas, K., Condon, J. J., 1996, ApJS, 103, 427
- [13] Hales, S. E. G., Mayer, C. J., Warner, P. J., Baldwin, J. E., 1991, MNRAS, 251, 46
- [14] Hales, S. E. G., Waldram, E. M., Rees, N., Warner, P. J., 1995, MNRAS, 274, 447
- [15] Hardcastle, M. J., Alexander, P., Pooley, G. G., Riley, J. M., 1998, MNRAS, 296, 445
- [16] Hartmann, D., 1994, PhD.-thesis, University of Leiden
- [17] Kaiser, C. R., Schoenmakers, A. P., Röttgering, H. J. A., 1999, MNRAS, accepted Paper II
- [18] Lacy, M., Rawlings, S., Saunders, R., Warner, P. J., 1993, MNRAS, 264, 721
- [19] Macklin, J. T., 1981, MNRAS, 196, 967
- [20] Rees, N., 1990, MNRAS, 244, 233
- [21] Rengelink, R., Tang, Y., de Bruyn, A. G., Miley, G. K., Bremer, M. N., Röttgering, H. J. A., Bremer, M. A. R., 1997, A&AS, 124, 259
- [22] Rudnick, L., Jones, T. W., Fiedler, R., 1986, AJ, 91, 1011
- [23] Scheuer, P. A. G., 1974, MNRAS, 166, 513
- [24] Schoenmakers, A. P., de Bruyn, A. G., Röttgering, H. J. A., van der Laan, H., Kaiser, C. R., 1999, MNRAS, accepted Paper I
- [25] Spoelstra, T. A. T., Patnaik, A. R., Gopal-Krishna, 1985, A&A, 152, 38
- [26] Tadhunter, C. N., Morganti, R., Robinson, A., Dickson, R., Villar-Martin, M., Fosbury, R. A. E., 1998, MNRAS, 298, 1035
- [27] Wellman, G. F., Daly, R. A., Wan, L., 1997, ApJ, 480, 96