Understanding Blazar Jets
Through Their Multifrequency Emission
Abstract
Being dominated by non-thermal (synchrotron and inverse Compton) emission from a relativistic jet, blazars offer important clues to the structure and radiative processes in extragalactic jets. Crucial information is provided by blazars’ spectral energy distributions from radio to gamma-rays (GeV and TeV energies), their trends with bolometric luminosity, and their correlated variability properties. This review is focussed on recent multiwavelength monitorings of confirmed and candidate TeV blazars and the constraints they provide for the radiative properties of the emitting particles. I also present recent observations of the newly discovered class of “blue quasars” and the implications for current blazars’ unification schemes.
The blazar family
Blazars are radio-loud Active Galactic Nuclei (AGNs) with polarized, luminous, and rapidly variable non-thermal continuum emission, extending from radio to gamma-rays (GeV and TeV energies), from a relativistic jet oriented close to the line of sight. As such, they are rare laboratories to study the physics and structure of extragalactic jets, present in all radio-loud AGNs megunif .
Strong clues are provided by blazars’ spectral energy distributions (SEDs). These are typically double-humped (Fig. 1; from wehrle98 ; kataoka99a ), with the first component peaking at IR/optical wavelengths in “red blazars” (also called Low-energy peaked blazars, LBLs) and at UV/X-rays in “blue blazars” (or HBLs, High-energy peaked blazars) 111A practical way to discriminate between LBLs and HBLs is though their radio-to-X-ray spectral indices, , with in LBLs and in HBLs padovani95 . Flat Spectrum Radio Quasars (FSRQs) have SEDs similar to LBLs, but are more luminous and have stronger optical emission lines scarpa .. Its rapid variability and high polarization leave little doubt that it is due to synchrotron emission from relativistic electrons in the jet. The second spectral component extends from X-rays to gamma-rays, and its origin is less well understood. In the leptonic models, it could be due to inverse Compton (IC) scattering off the electrons of photons either internal or external to the jet (synchrotron-self Compton, SSC and external Compton, EC, respectively; see, e.g., bottcher99 ). Here I will assume the leptonic models, but acknowledge that an alternative is provided by the hadronic scenario (e.g., rachen99 ).


Red and blue blazars are just the extrema of a continuous distribution of SEDs rita96 ; rita97 . Indeed, deep multicolor surveys perlman99 ; sally are finding an increasing number of sources with intermediate SED shapes, and new trends with jet bolometric luminosity are discovered rita96 ; fossati98 . Specifically, the lower-luminosity blue blazars have higher synchrotron and IC peak frequencies, lower ratios of the IC to synchrotron peak fluxes, and weaker or absent optical emission lines than their more luminous red counterparts.
A possible interpretation is that the different SEDs are due to different predominant electrons’ cooling mechanisms ghisello98 . In a homogeneous scenario, the synchrotron peak frequency , where is the electron energy determined by the competition between acceleration and cooling. Because of the lower energy densities, in line-less blue blazars the balance between heating and cooling is achieved at larger . In contrast, in red blazars the electrons are more efficiently cooled due to the additional EC component and reach a lower final . The emerging scenario is that blue blazars are SSC-dominated, while the EC mechanism dominates the production of gamma-rays in red blazars. While there are a few caveats to this picture meg99 , the clear message is that the spectral diversity of blazars’ jets cannot be explained by beaming/orientation effects only, but require instead a change of physical parameters and/or a different jet environment rita96 ; markos99 .
Probing blazars’ paradigm:
Multiwavelength variability
of TeV blazars
Correlated multiwavelength variability provides a way to test the cooling paradigm since the various synchrotron and IC models make different predictions for the relative flare amplitudes and shape, and the time lags. Since the same population of electrons is responsible for emitting both spectral components (in a homogeneous scenario), correlated variability of the fluxes at the low- and high-energy peaks with no lags is expected (see vulcano and references therein). In blue blazars, the TeV emission is largely due to lower-energy electrons scattering low-energy (IR) photons, with the higher-energy electrons () producing the harder TeV photons tavecchio98 . The X-ray light curve should track the TeV one, with relative amplitude for the flares at the two energies in a linear relationship coppi99 . Thus, TeV blazars probe the spectrum of the emitting particles. This is amply demonstrated by the case of Mrk 421 and Mrk 501, the two brightest and best-studied TeV blazars.
Mrk 421
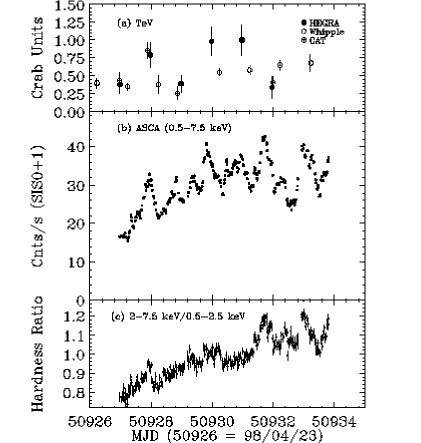
Mrk 421 was extensively studied during multifrequency campaigns conducted in 1994, 1995, and 1998. The early monitorings with ASCA, Whipple, EUVE, and ground-based telescopes established that the X-ray and TeV emission is well correlated on longer ( days) timescales, with amplitude generally decreasing with increasing wavelength tak96 , although within a rather sparse sampling. An intensive campaign, continuous over a period of seven days, was performed in 1998 April, involving ASCA, SAX, EUVE, and various TeV telescopes tak99 . The ASCA and TeV light curves are shown in Fig. 2a. Complex X-ray flux and spectral variability is detected by ASCA, with short ( 0.5 day) flares superposed on a longer trend and intra-day variations. The TeV light curve, disrupted by unfortunate episodes of bad weather, tracks the general trend observed at X-rays.
A few days before the start of the ASCA observations and partly overlapping with it, Mrk 421 was observed with Whipple and SAX, with a strong flare observed at both wavelengths (Fig. 2b). The new and exciting result is the first detection of X-ray/TeV correlated variability on timescales of hours laura99 , strongly supporting the idea that the same electron population is responsible for emitting the X-rays via synchrotron and the TeV photons via IC. Note the different decay times of the flare, much faster at TeV than at X-rays (Fig. 2b), difficult to explain in the context of a simple homogeneous model laura99 .
Mrk 501
Mrk 501 attracted much attention in 1997 April when it underwent a spectacular flare at TeV energies catanese97 ; aharonian99 ; djannati99 , well correlated with a similarly-structured X-ray flare detected by RXTE. No delays longer than one day were detected between the X-ray and TeV emission henric99 . A remarkable spectral behavior was observed in the X-rays (Fig. 1b), where an unusually flat (photon index ) X-ray continuum was measured by SAX and RXTE during the TeV flare pian98 ; henric99 . This implies a shift of the synchrotron peak toward higher energies by more than two orders of magnitude, almost certainly reflecting a large increase of the electron energy pian98 , or the injection of a new electron population on top a quiescent one kataoka99a . Later RXTE observations in 1997 July found the source still in a high and hard X-ray state lamer98 , indicating a persistent energizing mechanism. A similarly flat X-ray continuum was observed in another weaker TeV blazar, 1ES2344+514 giommi99 .


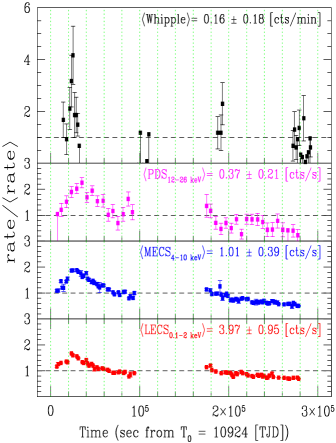
An interesting new behavior was observed during our latest 2-week RXTE and HEGRA monitoring of Mrk 501 in 1998 June rita99a , when 100% overlap between the X-rays and TeV light curves was achieved (Fig. 3a). A strong (factor 20 or more), short-lived ( two days) TeV flare is detected, well correlated to a lower-amplitude, broader flare in the X-rays. As in 1997 April, large X-ray spectral variations are observed in 1998 June, with the X-ray continuum flattening to at the peak of the TeV flare. This implies a similar shift to 50 keV of the synchrotron peak, but on much faster timescales (Fig. 3b). However, while in 1997 April the TeV spectrum hardened during the flare djannati99 , as it did in the X-rays, in 1998 June the TeV hardness ratios stayed relatively constant during the flare and softened one day later (Fig. 3a). The correspondence between the X-ray and TeV spectra is no longer present during the 1998 June flare.
Intra-hour TeV variability is also detected, with a doubling timescale for the TeV flux of 30 min rita99a . No correlation with the X-ray light curve on such short timescales was possible, due to unfortunate gaps in the RXTE sampling. The short TeV variability timescale implies a size of the emitting region cm and a Doppler factor of the emitting plasma , similar to Mrk 421 gaidos96 .
Acceleration and cooling in blazars jets
Multiwavelength correlated variability of the synchrotron emission provides tight clues to the structure of the jet through the study of the energy-dependence of the flare and the accompanying spectral variations. The rise and decay times of the synchrotron flux depend on a few source typical timescales chiaberge99 , while the accompany spectral variability is a strong diagnostic of the electron acceleration versus cooling processes kirk98 , with characteristic patterns predicted for the hardness ratios as a function of total intensity depending on the timescales of the two processes. When cooling dominates, the radiative time can be approximated by the lag between the shorter and longer synchrotron wavelengths, providing an estimate of the magnetic field of the source via , where is in keV, in Gauss, and is the Doppler factor of the emitting plasma tak96 ; meg97 .
Two excellent laboratories to study the energy propagation of the synchrotron flare are PKS 2155–304 and PKS 2005–489, since they are bright and rapidly variable at all observed wavelengths from optical to X-rays. They were the targets of recent monitorings, as described below.
Multiwavelength observations of PKS 2155–304
PKS 2155–304 was detected at TeV energies by the Durham group chadwick99 in 1997 November, during a period of intense X-ray activity chiappetti99 ; chadwick99b , although the source was not bright enough to allow a detailed TeV light curve. The synchrotron peak in the SED, usually in the EUV/soft X-ray energy range, shifted forward one order of magnitude bertone99 , indicating a more modest acceleration event than in Mrk 501. Because of its intermediate SED, the correlated TeV and X-ray variability properties of PKS 2155–304 could be different than the Markarian objects, and this source qualifies as a high-priority candidate for future X-ray/TeV monitoring campaigns.
In 1991 November, PKS 2155–304 was observed with 4.5-day continuous monitoring from optical to UV and X-rays. It exhibited small-amplitude (10%), energy-independent variability, with well-correlated flares from optical to X-rays on timescales of a few hours and the shorter wavelengths leading the longer ones edelson95 . However, in a subsequent campaign in 1994 May, PKS 2155–304 showed a substantially different behavior. The source was observed continuously for 10 days in UV and EUV, and for 2 days in the X-rays and optical meg97 , exhibiting energy-dependent variations. A well-defined X-ray flare was observed, followed by broader, lower-amplitude flares at EUV and UV by 1 and 2 days, respectively. In X-rays, the harder energies lead the softer ones by one hour kataoka99b ; zhang99 , implying a magnetic field of Gauss for , similar to Mrk 421 tak96 ; meg97 . This apparent progression of the X-ray flare to longer wavelengths in 1994 May was explained well by an acceleration (or equivalent) event in the context of synchrotron radiation, with the time delay reflecting either synchrotron loss timescales or physical inhomogeneities of the emission region meg97 . However, the quantitatively different behaviors between the campaigns in 1991 and 1994 show that the variability properties of blazars are complex, involving different modes and likely reflecting an underlying complexity in the jet structure and/or in the emission mechanisms.


PKS 2155–304 was monitored again in 1996 May from IR to X-rays (Fig. 4a; from rita99b ). In the X-rays excellent sampling was achieved with RXTE, and a complex flux and spectral behavior was observed, with short ( 1-2 days), energy-dependent flares superposed to a longer-timescale trend. Inspection of the X-ray hardness ratios versus flux shows that the individual flares exhibit different spectral variability patterns. Hysteresis loops of opposite signs, both in a “clockwise” (C) and “anti-clockwise” (A) sense, are observed (Fig. 4b,c). Analysis of individual flares with various correlation methods shows that C loops correspond to soft lags (hard energies varying first) while A loops correspond to hard lags (soft energies varying first).
This behavior is consistent with a model where energetic electrons are injected in the source via a shock and escape into the emission region, where they cool kirk98 . When acceleration is faster than cooling, the latter dominates variability and, because of its energy dependence, the harder energies are emitted first, with C loops/soft lags observed. If instead the acceleration is slower (), the electrons need to work their way up in energy and the softer energies are emitted first, yielding A loops and hard lags. For the first time, we are observing electron acceleration, which, together with cooling, is responsible for the observed X-ray variability properties of PKS 2155–304 in 1996 May.


The TeV candidate PKS 2005–489
PKS 2005–489 qualifies as a TeV candidate because of its SED, similar to Mrk 421, and its proximity (=0.071) rita95 ; stecker . Observations by the CANGAROO group yielded only an upper limit to the TeV flux roberts . We monitored this source in 1998 September with RXTE and EUVE, to study the energy-dependence of the synchrotron flares. Unfortunately, the source was faint at EUV wavelengths, with a count rate of 0.01 c/s; no variability is observed in the daily-binned light curve (Fig. 5a). The X-ray light curves in a soft (2–6 keV) and hard (6–20 keV) energy band are shown in Fig. 5a. Despite the gaps, due to the RXTE observational constraints, it is apparent that the variability at hard X-rays is faster than at soft X-rays, consistent with cooling dominating the synchrotron flux changes. This is confirmed by the analysis of the hardness ratios versus flux, where only clockwise loops are observed. A similar behavior was also observed one month later during a larger-amplitude, longer-lasting flare, when spectral variations occurred on timescales of a few hours perlman99lett (Fig. 5b).

Blue Quasars:
Undermining the blazar paradigm?
A simple and yet powerful probe of the blazar paradigm described above is provided by the X-ray spectra of the various blazar classes. In blue blazars, where the synchrotron peak falls at high frequencies, the X-rays are dominated by the high-energy tail of the synchrotron component and their X-ray continua should thus be steep and convex, as a result of radiative losses. On the other end of the spectral sequence, FSRQs are dominated in the X-rays by the emerging Compton component and their X-ray continua should be flatter. This is confirmed by observations of large samples of sources with ROSAT and ASCA rita97 ; kubo , which yield flat (photon index ) X-ray continua for FSRQs, steep () and downward-curved continua for HBLs, and intermediate slopes for LBLs ().
It was thus surprising when a sub-group of FSRQs, with otherwise “canonical” properties, was observed to have unusually steep ROSAT spectra, 2, similar to HBLs rita97 ; padovani96 . These objects were dubbed “blue quasars” to indicate that they could be the quasar counterparts of HBLs, contrary to the predictions of the blazar paradigm which purports that blue blazars are essentially line-less. Recent deep multicolor surveys, including our own perlman99 , are finding an increasing number of these sources, which now amount to a non-negligible fraction of the total blazar population.
What is the true nature of blue quasars? A first simple test is to measure their hard X-ray continua. If synchrotron dominates the optical through X-ray emission, as in HBLs, the X-ray emission above 2 keV should be as steep or even steeper than at softer energies. We performed exploratory ASCA observations of four blue quasars from our ROSAT sample rita97 , selected because relatively nearby () and not yet detected at gamma-rays, thus avoiding an a priori bias toward flat X-ray slopes. We find that their ASCA spectra are consistent with flat X-ray continua above 2 keV, , similar to the “canonical” FSRQs of the red type and implying an upturn in the SEDs (Fig. 6), most likely the onset of the Compton tail fsrq99 .
In Fig. 6, the nature of the emission below 1 keV is not well constrained, and both a thermal and non-thermal origin is possible. To this regard, blue quasars could be similar to 3C 273 and 3C 345, two quasar-like blazars where a thermal “blue bump” from the accretion disk is notoriously present, intruding into the soft X-rays (see rita97 and references therein). It is thus entirely plausible that the large observed in blue blazars (or at least some of them) is due to a strong thermal contribution from the accretion disk, as in 3C 273 and 3C 345. Future simultaneous optical-UV-X-ray spectra will have the potential to better constrain the nature of blue quasars and their role in the blazar family.
Conclusions and Future prospects
Recent multiwavelength campaigns of blazars expanded the currently available database, from which we are learning important new lessons. Detailed modeling of the SEDs of bright gamma-ray blazars of the red and blue types tend to support the current cooling paradigm, where the different blazars flavors are related to the predominant cooling mechanisms of the electrons at the higher energies (EC in more luminous red sources, SSC in lower-luminosity blue ones). Future larger statistical samples are needed, to fully address the observational biases, especially in gamma-rays. In particular, it will be important to expand the sample of TeV blazars, which currently includes only a handful of sources.
Correlated multiwavelength variability is the key to understanding the structure of blazars’ jets. In TeV blazars, the X-rays are well correlated to the TeV emission down to timescales of days and hours (in Mrk 421), supporting a model where the same electrons are responsible for the emission at both wavelengths. It will be important to determine the shortest timescales on which this correlation holds, to pin down the electron energy distribution and the location of the emitting region(s) in the jet. This awaits well-sampled gamma-ray light curves, which will be afforded by the next higher-sensitivity missions (HESS, VERITAS, MAGIC, CANGAROO II at TeV and GLAST at GeV). Broader-band, higher quality gamma-ray spectra will also be available, allowing a more precise location of the Compton peak.
An outstanding still unanswered question is the jet composition (electrons/positrons versus protons). Single-epoch SEDs of blazars are adequately modeled by both the leptonic and hadronic models, with different tuning of the parameters. However, while the leptonic models make specific predictions for the correlated variability properties, more extensive modeling is currently needed in the context of the proton jet models. A first effort was presented at this meeting rachen99 .
Finally, coordinated X-ray and longer-wavelength observations of the synchrotron component in blue blazars strongly suggests that acceleration, cooling, and escape are the dominant mechanisms responsible for the observed variability properties. The case of PKS 2155–304 shows that different flaring modes could be present in a single source, stressing the importance of multi-epoch monitorings to obtain a complete picture of the physical processes in blazar jets.
This work was funded through NASA contract NAS–38252 and NASA grant NAG5–7276. I thank Felix Aharonian and the HEGRA team for allowing me to show the 1998 TeV data of Mrk 501, Eric Feigelson for comments, and Lester Chou for help with the RXTE data reduction.
References
- (1) Urry, C.M. and Padovani, P., PASP 10, 803 (1995).
- (2) Wehrle, A. et al. ApJ 497, 178 (1998).
- (3) Kataoka, J. et al., ApJ 514, 138 (1999).
- (4) Padovani, P. and Giommi, P., ApJ 444, 567 (1995).
- (5) Scarpa, R. and Falomo, R., A&A 325, 109 (1997).
- (6) Böttcher, M. (1999), this volume.
- (7) Rachen, J. (1999), this volume.
- (8) Sambruna, R.M., Maraschi, L., and Urry, C.M., ApJ 463, 444 (1996).
- (9) Sambruna, R.M. ApJ 487, 536 (1997).
- (10) Perlman, E.S. (1999), this volume.
- (11) Laurent-Muehleisen, S. et al., ApJS 118, 127 (1998).
- (12) Fossati, G. et al., MNRAS 299, 433 (1998).
- (13) Ghisellini, G. et al., MNRAS 301, 451 (1998).
- (14) Urry, C.M., Astroparticle Physics 11, 159 (1999).
- (15) Georganopoulos, M. and Marscher, A., ApJ 506, 621 (1998).
- (16) Sambruna, R.M., “Coordinated RXTE and multiwavelength observations of blazars”, in Proceedings of the Frascati ’99 Workshop on Multifrequency behavior of high-energy cosmic sources, May 24–29, Vulcano, Italy, MEMSAIt (1999) in press.
- (17) Tavecchio, F., Maraschi, L., & Ghisellini, G., ApJ 509, 608 (1998).
- (18) Coppi, P. and Aharonian, F., ApJ 521, L33 (1999).
- (19) Takahashi, T. et al., ApJ 470, L89 (1996).
- (20) Takahashi, T. et al., Astroparticle Physics 11, 177 (1999).
- (21) Maraschi, L. et al., ApJ Letters (1999), in press.
- (22) Catanese, M. et al., ApJ 487, 143 (1997).
- (23) Aharonian, F. et al., A&A 342, 69 (1999).
- (24) Djannati-Atai, A. et al., A&A (1999) in press (astro-ph/9906060).
- (25) Krawczynski, H. et al., A&A (1999), in press.
- (26) Pian, E. et al. ApJ 486, 770 (1998).
- (27) Lamer, G. and Wagner, S. A&AL 331, 13 (1998).
- (28) Giommi, P., Padovani, P. and Perlman, E.S., MNRAS, in press (1999) (astro-ph/9907377).
- (29) Sambruna, R.M. et al., ApJ Letters (1999), subm.
- (30) Gaidos, J.A. et al., Nature 383, 319 (1996).
- (31) Chiaberge, M. and Ghisellini, G., MNRAS 306, 551 (1999).
- (32) Kirk, J.G., Riegler, F.M., and Mastichiadis, A., A&A 333, 452 (1998).
- (33) Urry, C.M. et al. ApJ 486, 799 (1997).
- (34) Chadwick, P. et al., ApJ 513, 161 (1999).
- (35) Chiappetti, L. et al., ApJ 521, 552 (1999).
- (36) Chadwick, P. et al. (1999), this volume.
- (37) Bertone, E. et al. (1999), in prep.
- (38) Edelson, R.A. et al., ApJ 438, 120 (1995).
- (39) Kataoka, J. et al., ApJ (1999), in press.
- (40) Zhang, Y.H. et al. ApJ (1999), in press (astro-ph/9907325).
- (41) Sambruna, R.M. et al., (1999) in prep.
- (42) Sambruna, R.M. et al., ApJ 449, 567 (1995).
- (43) Stecker, F.A., De Jager, O.C., and Salamon, M.H., ApJ 473, L75 (1996).
- (44) Roberts, M.D. et al., A&A 343, 691 (1999).
- (45) Perlman, E.S. et al., ApJ 523, L11 (1999).
- (46) Kubo, H. et al., ApJ 504, 693 (1998).
- (47) Padovani, P., Giommi, P., and Fiore, F., MNRAS 284, 569 (1997).
- (48) Sambruna, R.M., Chou, L., and Urry, C.M., ApJ (1999), subm.