On the inability of Comptonization to produce
the broad X-ray iron
lines observed in Seyfert nuclei
Abstract
It has recently been suggested that Compton downscattering may give rise to the broad iron lines seen in the X-ray spectra of Seyfert 1 galaxies. This challenges the standard model in which these lines originate from the innermost regions of the black hole accretion disk with Doppler shifts and gravitational redshifts giving rise to the broadened line profile. Here, we apply observational constraints to the Compton downscattering model for MCG6-30-15 and NGC 3516, the two best cases to date of Seyfert galaxies with relativistically broad lines. We show that the continuum source in MCG6-30-15 required by the constrained model violates the black body limit. In the case of NGC 3516, only a very small region of parameter space is compatible with the constraints. Hence, we conclude that the Comptonization model is not a viable one for the broad line seen in these two objects. The accretion disk model remains the best interpretation of these data.
Subject headings:
galaxies:Seyfert, galaxies:individual:MCG6-30-15, galaxies:individual:NGC 3516, line:formation, X-ray:galaxies1. Introduction
The X-ray study of Seyfert nuclei and other types of active galactic nuclei (AGN) has been energized for the past few years by the observation of relativistically broad iron K lines in their X-ray spectra (Tanaka et al. 1995; Nandra et al. 1997; Reynolds 1997). In particular, the Seyfert galaxy MCG6-30-15 has become an important testing ground for models of broad iron line formation. A long observation of MCG6-30-15 by the Advanced Satellite for Cosmology and Astrophysics (ASCA) revealed a high signal-to-noise broad iron line with a velocity width of and a profile which is skewed to low energies (Tanaka et al. 1995). The excitement stirred by these studies is due to the widely held belief that the iron lines originate from the surface layers of an accretion disk which is in orbit about a supermassive black hole, and that the line width and profile provide a direct probe of the velocity field and strong gravitational field within a few Schwarzschild radii of the black hole. Models of line emission from the inner regions of a black hole accretion disk (e.g., Fabian et al. 1989; Laor 1991) fit the observed line profiles well.
The suggestion that we are observing the immediate environment of an accreting supermassive black hole is a bold one and certainly warrants a critical examination. In this spirit, Fabian et al. (1995; hereafter F95) examined a number of alternative hypotheses for the origin of these broad iron lines including models in which the line is produced in an outflow or jet, and models in which the line is intrinsically narrow (or even absent) and a complex underlying continuum mimics the broad line. Both of these classes of models were found to be unphysical or did not reproduce the observed spectrum.
Another alternative model, first proposed by Czerny, Zbyszewska & Raine (1991) but also considered by F95, is one in which the iron line is intrinsically narrow (i.e., emitted in slowly moving material which is very far from a compact object) and then broadened to the observed profile by Compton downscattering in matter that surrounds the source of line photons. F95 rejected this model on the basis that the Comptonizing cloud must have a radius of in order to maintain the required high ionization state and that, with such a small radius, gravitational effects from a central black hole would be important anyway for determining the line profile. The principal aim of F95 was to demonstrate the need to include strong gravity in any model of the iron line, so they terminated their chain of reasoning at that point. The question remains, however, as to whether Compton downscattering has a significant affect on the line profile or whether we can interpret iron line observations in terms of naked accretion disk models.
Misra & Kembhavi (1998) and Misra & Sutaria (1999; hereafter MS99) have recently developed the Comptonization model further. In their current model, they suggest that a cloud with optical depth and temperature surrounds the central engine. The upper limit to the temperature of the Compton cloud comes from the fact that the iron K line photons need to be primarily downscattered, rather than upscattered, in order to reproduce the observed line profile. The central engine produces the continuum emission which keeps the cloud ionized, and a narrow iron line which is Compton broadened to the observed width. They show that the resultant line profiles can be brought into good agreement with the ASCA observations.
A direct prediction of the Comptonization model (F95, MS99) is that the multiple Compton scatterings should produce a break in the spectrum of the power-law continuum radiation at approximately (i.e., –). Recently, it has been reported that BeppoSAX (Guainazzi et al. 1999) observations constrain the location of the continuum break to be at energies greater than , thereby arguing against the Comptonization model (Misra 1999). However, a robust determination of the continuum break is not completely straightforward since it depends upon the parameters assumed for the Compton reflection component (e.g., see Lee et al. 1999). Thus, while the lack of a spectral break at 30–40 keV remains the most compelling argument against the Comptonization model, it is interesting to consider constraints on the Comptonization model that are independent of a continuum spectral break.
In this paper, we apply a number of observational constraints to the MS99 model. We focus on the case of the iron line in MCG6-30-15, but also address the line in NGC 3516, the other high signal-to-noise case of a relativistically broad line. We show that the continuum source in MCG6-30-15 required by the constrained model violates thermodynamic limits (i.e., the “black body” limit). We also show that only a very small region of parameter space is open to the Comptonization model in the case of NGC 3516. Hence, we conclude that the Compton downscattering model is not a viable model for the broad iron lines in one, and possibly both, of these sources.
2. Constraints from continuum variability in MCG6-30-15
The iron line in MCG6-30-15 has been observed to change flux and profile on timescales of (Iwasawa et al. 1996, 1999). This is the shortest timescale on which detailed line changes can currently be probed and there may indeed be line variability on shorter timescales. MS99 note that such variability is consistent with the line originating from a Compton cloud of size .
However, in the Comptonization model, the continuum photons also pass through the same Comptonizing medium as the iron line photons. Thus, continuum variability can be used to place much tighter constraints on the size of the cloud. Any variability of the central source would be smeared out as the photons random walk through the cloud on a timescale of
| (1) |
Appreciable continuum variability in MCG6-30-15 is observed on timescales down to (Reynolds et al. 1995; Yaqoob et al. 1997). Since we must have , an upper limit on the Compton cloud is , two orders of magnitude less than the size assumed in MS99. Assuming a geometrically thick cloud and solar abundances, the density of the material is .
In assessing the robustness of this constraint, it should be noted that the iron line in MCG–6-30-15 is always observed to be broad (although the width of the line does indeed vary, e.g. Iwasawa et al. 1996), and the source is always observed to vary its flux with a temporal power spectrum that extends down to 100 s timescales (Lee et al. 1999b; Nowak & Chiang 1999; Reynolds 1999). Thus, it is difficult to support a model in which the Compton cloud is sometimes present (producing a broad line and a slowly varying continuum) and sometimes absent (producing a narrow line and a rapidly varying continuum).
3. The Compton temperature and the black-body limit
In the situation postulated by the MS99 model, the temperature of the Compton cloud will be locked to the Compton temperature of the (local) radiation field. We model the continuum spectrum of the central source as the superposition of a black body spectrum (which may represent thermal emission from an accretion disk) and a power-law spectrum with energy index which extends up to hard X-ray energies (which may be identified as accretion disk photons that have been subjected to multiple Compton upscattering by an accretion disk corona).
The flux at the inner edge of the Compton cloud is then given by
| (2) |
where is the inner radius of the Compton cloud, is the luminosity of the black body component, the Stefan-Boltzmann constant, is the luminosity in the power-law component, in the range (and zero elsewhere), and is given by
| (3) |
Guided by the hard X-ray observations of MCG6-30-15 (e.g., Lee et al. 1999), the parameters describing the power-law component are fixed to have the following values:
| (4) | |||||
| (5) | |||||
| (6) |
The resulting Compton temperature is given by
| (7) |
where is the ratio of the black body luminosity to the power-law luminosity:
| (8) |
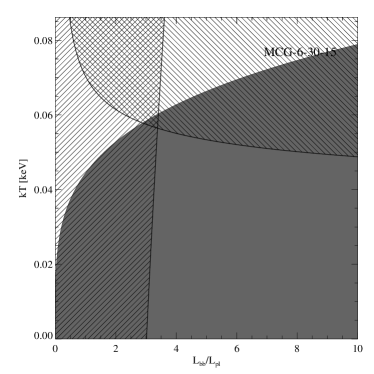
The line corresponding to a Compton temperature of on the -plane is shown on Fig. 1a, and the forbidden region of parameter space (giving ) is shaded with lines of positive gradient.
For completeness, it should be noted that the above expression for the Compton temperature is only strictly valid due to the soft nature of our spectrum. The Compton temperature depends, of course, on the form of the radiation field inside the cloud. Ignoring downscattering, this field is greater than the external radiation field by a factor of . For the high-energy radiation (), has an energy dependence due to Klein-Nishina corrections, thereby affecting the Compton temperature. The neglect of downscattering is also invalid at these energies. However, these corrections to the Compton temperature have a negligible effect in our case.
The ASCA observation shows no evidence for a soft excess component in MCG6-30-15 across the entire well-calibrated spectral range of the solid-state imaging spectrometers (SIS; 0.6–10 keV). Thus, we impose the condition that the black-body flux at 0.6 keV is less than the power-law flux at the same energy:
| (9) |
The region on the -plane forbidden by this constraint is shaded with lines of negative gradient in Fig. 1a.
Finally, we make the observation that there is a fundamental limit to the black body luminosity which is imposed by thermodynamics:
| (10) |
where is the maximum allowed size of the black body source. Since the continuum source is hypothesized to be interior to the Compton cloud, we must have . The region of the -plane forbidden by this constraint is shown in solid-shade in Fig. 1a.
We see that applying these three constraints eliminates all regions of the -plane. One must conclude that the Compton cloud model discussed by Misra & Kembhavi (1998) and MS99 is not valid in the case of MCG6-30-15.
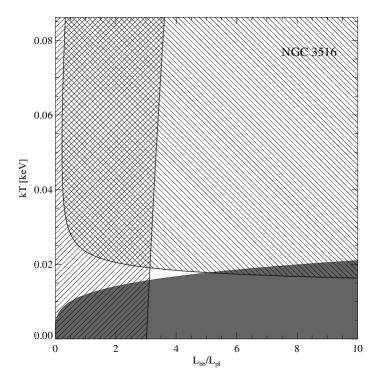
NGC 3516 also displays a strong broad iron line that has been observed at high signal-to-noise with ASCA (Nandra et al. 1999). We have also examined constraints on the Comptonization model for this iron line. Continuum variability in this object is observed on timescales down to (Edelson & Nandra 1998; K. Nandra, private communication), giving a maximum size of for the Comptonizing cloud, rather larger than the case of MCG6-30-15. Also, BeppoSAX observations fail to see a soft excess in the X-ray spectrum all of the way down to (Stirpe et al. 1998). Noting that produces the constraint diagram shown in Fig. 1b. It is seen that these constraints eliminate all but a very small region of parameter space. Thus, although the broad line in NGC 3516 could in principle be explained with the Comptonization model, the amount of fine tuning necessary for finding the line parameters makes the model improbable in this case.
4. Discussion
It should be stressed that we have used conservative parameters in our assessment of these observational constraints. In particular, we assume that the power-law component of the continuum emission possesses an energy index of (corresponding to a photon index of ) and a high energy cutoff of . In fact, the overall X-ray spectrum is harder than this (especially once the Compton reflection component is accounted for) and the high energy cutoff may well occur at rather higher energies. Either of these effects will raise the Compton temperature of the power-law component and require an even cooler black body component in order to cool the Compton cloud below the limit. It should also be noted that we have ignored any infra-red emission from the continuum source. Due to the high densities of the matter in the Compton cloud, IR emissions redwards of will be free-free absorbed and act to heat the cloud rather than Compton cool it. Again, the neglect of the IR emissions is a conservative assumption for our purposes.
There is another, independent, problem faced by the Compton cloud model: it is very difficult to maintain the required ionization state. F95 treated this problem by considering the required cloud size necessary to acheive some critical ionization parameter . According to F95, the AGN spectrum of Mathews & Ferland (1987), can be considered the point at which a photoionized plasma becomes completely ionized. Using the observed luminosity of MCG6-30-15, they deduced that the cloud must have a size in order to achieve at least this critical ionization parameter. As we will now show, this is a very conservative argument and, in fact, ionization balance imposes much more severe limits on the cloud size.
While the formal ionization parameter may be very high, the very soft continuum spectrum postulated by MS99 may still have trouble fully ionizing the iron throughout the whole cloud. To see this, note that all continuum photons capable of ionizing hydrogen like iron (Fe xxvi) reside in the power law component of the continuum. The continuum source in MCG6-30-15 emits Fe xxvi ionizing photons at a rate
| (11) |
where is the ionization potential of Fe xxvi. This evaluates to . The radiative recombination rate of the postulated Compton cloud, on the other hand, is given by
| (12) |
where the coefficients and are given by Shull & van Steenberg (1982). For a temperature of and , this gives . Thus, there are just enough ionizing photons present in the entire power law tail to ionize the hydrogen-like iron. If the temperature of the Compton cloud is below 0.5 keV, or the radius of the cloud is larger111Note that the quantity is proportional to the optical depth of the cloud and so is fixed by the width of the broad iron line., it will be impossible to photoionize the cloud. Very large iron edges would then be present in the observed X-ray spectrum, contrary to observations. Thus, ionization balance imposes a size limit of , independently of continuum variability constraints.
Finally, we address whether there are reasonable modifications that can be made to the MS99 scenario that will avoid the constraints imposed in this paper. There are three such modifications that we should consider. Firstly, if the geometry is such that the X-ray continuum source is viewed directly (rather than through the Compton cloud), one might imagine that the size of the Compton cloud and the X-ray continuum variability would be decoupled thereby relaxing the constraints discussed above. An example of such a geometry is if the Compton cloud forms a torus around the central X-ray source. In such a geometry, the X-ray continuum source illuminates and ionizes the observed face of the Compton cloud and powers iron line fluorescence from an optical depth of into the cloud. However, in this case, one would expect ionized iron lines (from the ionized zones that overlay the near-neutral zones in the Compton cloud) rather than the observed cold iron lines. Also, the illuminated surface of the Compton cloud, which must be highly ionized so as not to be a strong narrow iron line emitter, would act as a Compton mirror and smear out the observed continuum variability, even though the continuum source is viewed directly. Of course, any such modification to the basic Comptonization model in which the Compton cloud is allowed to be bigger than must be subject to the ionization problem described above.
Secondly, a large region of parameter space would open up if the Compton cloud experienced a different soft continuum to that observed (i.e. if the soft excess can be ‘hidden’ from view). Noting that the black body component must scatter though the same parts of the Compton cloud that broadens the iron line (in order to Compton cool it), one concludes that the black body photons and broad iron lines photons will follow very similar paths through the system. Hence, it is impossible to hide the soft excess emission from view in a system in which we observe a Compton broadened iron line.
Thirdly, the black body limit can be bypassed if the soft continuum source is placed outside of the Compton cloud. While it is difficult to construct rigorous arguments against this case, we consider that placing a powerful () soft continuum source at large distances from the central hard X-ray continuum source is an ad-hoc solution.
5. Conclusions
In this work, we have constrained the Compton cloud model for the broad iron line in both MCG6-30-15 and NGC 3516 by considering two observational constraints which are independent of the detection of a spectral break in the continuum spectrum: the continuum variability timescale and the absence of an observed soft excess. We have then demonstrated that the constrained model requires a continuum source which violates the black body limit. We also point out that the difficulty of photoionizing the Compton cloud to the required levels. Thus, we rule out the Comptonization model for the broad iron line in MCG6-30-15, and show that fine tuning is required in order for the model to explain the line in NGC 3516. We conclude that the combination of relativistic Doppler shifts and gravitational redshifts still provides the best explanation for the broad iron lines seen in AGN.
References
- (1) Czerny B., Zbyszewska M., Raine D. J., 1991, in Treves A., ed., Iron Line Diagnostics in X-ray Sources. Spring-Verlag, Berlin, p.226.
- (2) Edelson R., Nandra K., 1999, ApJ, 514, 682
- (3) Fabian A. C., Rees M. J., Stellar L., White N. E., 1989, MNRAS, 238, 729
- (4) Fabian A. C. et al. 1995, MNRAS, 277, L11 (F95)
- (5) Guainazzi M. et al., 1999, A&A, 341, L27
- (6) Iwasawa I. et al.,1996, MNRAS, 282, 1038
- (7) Iwasawa I., Fabian A. C., Young A. J., Inoue H., Matsumota C., 1999, MNRAS, 306, L191
- (8) Laor A., 1991, ApJ, 376, 90
- (9) Lee J. C., Fabian A. C., Brandt W. N., Reynolds C. S., Iwasawa K., 1999, MNRAS, in press
- (10) Lee J. C., Fabian A. C., Reynolds C. S¿, Brandt W. N., Iwasawa K., 1999b, MNRAS, submitted.
- (11) Mathews W. G., Ferland G. J., 1987, ApJ, 323, 456
- (12) Misra R., 1999, IUCAA preprint 32/99.
- (13) Misra R., Kembhavi A. K., 1998, ApJ, 499, 205
- (14) Misra R., Sutaria F. K., 1999, ApJ, 517, 661 (MS99)
- (15) Nandra K., George I. M., Mushotzky R. F., Turner T. J., Yaqoob T., 1997, ApJ, 477, 602
- (16) Nowak M. A., Chiang J., 1999, ApJ, submitted
- (17) Reynolds C. S., 1999, ApJ, submitted
- (18) Reynolds C. S., 1997, MNRAS, 286, 513
- (19) Reynolds C. S., Fabian A. C., Nandra K., Inoue H., Kunieda H., Iwasawa K., 1995, MNRAS, 277, 901
- (20) Stirpe G. M., Wilkes B. J., Comastri A., Mathur S., O’Brien P. T., 1998, in Scarsi H., Giommi P., Fiore F., ed., The Active X-ray Sky: Results from BeppoSAX and RXTE, Nuclear Physics B Proceedings Supplements, 69, 505
- (21) Tanaka Y. et al., 1995, Nat, 375, 659
- (22) Yaqoob T., McKernan B., Ptak A., Nandra K., Servemitsos P. J., 1997, ApJ, 490, L25