Simultaneous EUV and X-ray variability of NGC 4051
Abstract
We present a flux variability study of simultaneous RXTE and EUVE observations of the highly variable Seyfert galaxy NGC 4051. We find a strong correlation between variability in the EUV and medium energy X-ray bands, indicating that both are sampling the same power-law continuum. The lag between the two bands is less than 20 ks and, depending on model assumptions, may be ks. We examine the consequences of such a small lag in the context of simple Comptonisation models for the production of the power-law continuum. A lag of ks implies that the size of the Comptonising region is less than 20 Schwarzschild radii for a black hole of mass M⊙.
keywords:
galaxies: active – galaxies: Seyfert – galaxies: NGC 4051 – X-rays: galaxies1 Introduction
Despite two decades of observations, the mechanism for the production of
the X-ray continuum of radio-quiet AGN remains poorly
understood. The power-law nature of the continuum implies a
Comptonisation origin, possibly upscattering of low energy (optical, UV)
photons by a thermal distribution of energetic electrons (as indicated
by the OSSE detection of high energy cutoffs in Seyfert spectra e.g.,
Zdziarski et al., 1997). Rapid variability of the continuum
implies that the X-rays are produced in a small region, close to the
putative central black hole. These conclusions are still vague;
further understanding of the innermost regions of AGN requires more
detailed knowledge of the size and geometry of the X-ray producing
region, the source of the low energy ‘seed’ photons and the physical
characteristics of the scattering particles.
We can begin to address these points by answering two questions:
1. How low (in energy) does the power-law continuum extend?
2. Are there any lags between the variations in the X-ray band and lower energy bands?
Answering the first question will allow us to place an upper limit on the energy of the seed photons (and hence allow us to constrain the temperature of the source of the seed photons). Answering the second question will allow us to determine the size and possibly the geometry of the emitting region. In upscattering of low energy photons by a cloud of Comptonising particles, more scatterings are required to produce high energy photons than lower energy photons, hence there will be an intrinsic lag between high and low energy bands. The size of this lag is determined by the optical depth and size of the Comptonising region.
Searches for lags between the X-ray band and lower-energy contnuum bands in AGN have proved difficult, due to the difficulty of scheduling simultaneous observations between space-based and ground-based instruments for the long durations required to search for correlated variability. In this respect, the best studied radio-quiet AGN to date are the Seyfert galaxies NGC 4151, NGC 5548 and NGC 7469. The X-ray/UV monitoring of NGC 4151 and NGC 5548 constrained any lags between the UV and X-ray continua to be less than 0.15 d (Edelson et al. 1996) and less than 6 d (Clavel et al. 1992) respectively. The intense, month-long monitoring of NGC 7469 with the Rossi X-ray Timing Explorer (RXTE) and IUE (Nandra et al. 1998) revealed a complex correlated behaviour. In this case, the UV continuum led the X-rays by d at the peaks in the lightcurves, while there was no apparent lag between both bands during the lightcurve minima, suggesting that complex, multi-zone Comptonisation models may be required to explain the relationship between the X-ray and UV continua in NGC 7469. The similarity between X-ray spectral shape and variability properties (e.g. the power spectrum, McHardy 1988, Edelson & Nandra 1998) of Galactic Black Hole Candidates (GBHCs) and AGN suggests that GBHCs may be scaled-down analogs of AGN. A lag of ms has been measured between medium-energy (5–14 keV) and low-energy (2–5 keV) X-ray bands in the GBHC Cygnus X-1 (Page 1985), which scales to a lag of order s–10 ks in AGN, if we naively scale by the black hole mass (for a range of black hole masses, M⊙, as measured by Wandel Peterson & Malkan 1999). In simple Comptonisation models, we expect lags between bands to be energy dependent, with greater lags being seen between bands which are more separated in energy. This expected dependence has been seen in GBHCs (e.g. Cygnus X-1, Nowak et al. 1999), so that if the same applies to AGN, we might expect lags between the X-ray and EUV bands to be less than those between the X-ray and UV bands (i.e. less than 1 day) and more easily measurable by a relatively short monitoring campaign.
NGC 4051 is a nearby (), low luminosity ( ergs s-1) Narrow Line Seyfert 1 galaxy, which displays strong X-ray variability in both medium energy X-rays [Papadakis & Lawrence 1995] and low energy X-rays (Lawrence et al. 1987, McHardy et al. 1995) with a doubling timescale of less than 1 ks. This strong variability makes NGC 4051 an ideal candidate for searching for lags between the X-ray band and lower-energy bands. We therefore obtained simultaneous observations of NGC 4051 with RXTE and the Extreme Ultraviolet Explorer (EUVE) satellite in May and December 1996. In this paper we present the results of these observations as they relate to flux variability. Detailed spectral analysis of the RXTE observations is left to a later work.
In the next section we discuss the observations and data reduction method, while in section 3 we present the lightcurves and their cross-correlation function. In section 4 we further constrain any lag by assuming a simple spectral model. Finally, we discuss the implications of our results for the size of the scattering region in NGC 4051 and for Comptonisation models of the X-ray continuum.
2 Observations and Data Reduction
From May 20 to May 28 1996 RXTE observations of typical duration ks were carried out approximately every half-day and continuous (subject to source visibility) EUVE observations were also carried out at this time. Additional simultaneous observations occurred on May 6 1996. From December 13 to December 16, a long RXTE observation was carried out, which overlapped with a continuous three-day EUVE observation for ks.
The RXTE satellite observed NGC 4051 with the Proportional Counter Array (PCA) and the High Energy X-ray Timing Experiment (HEXTE) instruments. The PCA consists of 5 Xenon Proportional Counter Units (PCUs), sensitive to X-ray energies from 2–60 keV. The HEXTE covers a range of between 20–200 keV, but due to the faint nature of the source we only consider the PCA data in this work.
Discharge problems mean that of the 5 PCUs in the PCA, PCUs 3 and 4 are often switched off, so we include data from PCUs 0, 1 and 2 only. We extract data from the top layer of the PCA using the standard ftools 4.1 package, excluding data obtained within and up to 20 minutes after SAA maximum and data obtained with earth elevation . We generate background data for the PCA with pcabackest v2.0c using the new L7 model for faint sources.
NGC 4051 was observed with the Deep Survey Spectrometer (DS/S) on board the EUVE satellite. The DS/S (e.g. Welsh et al. 1990) is equipped with a broad band imaging detector (covering the 66–178 Å band in the Lexan/B filter) and three spectrometers covering the ‘short’ (SW: 70–190 Å), ‘medium’ (MW: 140–380 Å) and ‘long’ (LW: 280–760 Å) EUV wavelengths (Abbott et al. 1997). This configuration allows simultaneous imaging and spectroscopy with a spatial resolution of arcmin and a spectral resolution of at the short wavelengths.
NGC 4051 was detected only in the SW spectrometer because the interstellar medium ( cm-2 Elvis, Lockman & Wilkes 1989) severely attenuates the EUV spectrum for wavelengths longer than Å. But despite the long ( ks) total effective exposure, the average signal-to-noise ratio (SNR) achieved in the spectrum – per 1 Å bin – is very low ( in the range 80-90 Å) and spectral data will not be discussed further here. For the purposes of this work, we only use the lightcurves produced by the DS imaging detector in the energy range 124–188 eV (with the Lexan/B filter).
We extracted the light curves from the DS time-ordered event list using the EUVE Guest Observer Center software (IRAF/EUV package) and other IRAF timing tasks adapted for EUVE data. After correcting the data for instrumental deadtime, telemetry saturation, vignetting and eliminating intervals of high particle background, the total effective exposure is 178738 s. We counted the source photons in a circle of radius, and we estimated the background in a concentric annulus with inner and outer radii of and respectively. The extraction region includes more than 98% of the DS point spread function (Sirk et al. 1997) and the background is generally very uniform in the chosen area. The effective area of the DS instrument (25 cm2 at Å, Sirk et al. 1997), is more than 10 times larger than the spectrometer effective area at this wavelength and a good detection of the source was obtained during each 5544 s EUVE orbit (see figures 1 and 2). A complete description of the EUVE observation and data analysis can be found in Fruscione et al. (1999). Similar lightcurve extractions have been performed on other AGNs detected by EUVE (e.g. 3C273, Ramos et al. 1997, NGC 5548, Marshall et al. 1997).
3 timing analysis
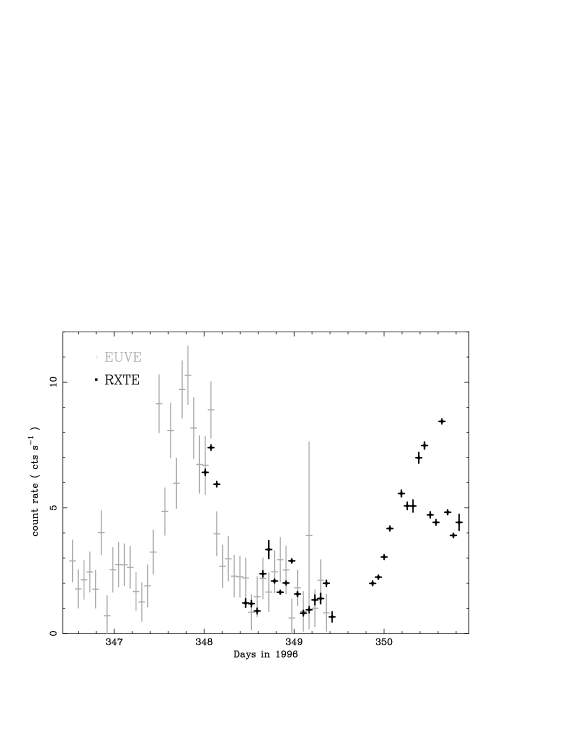
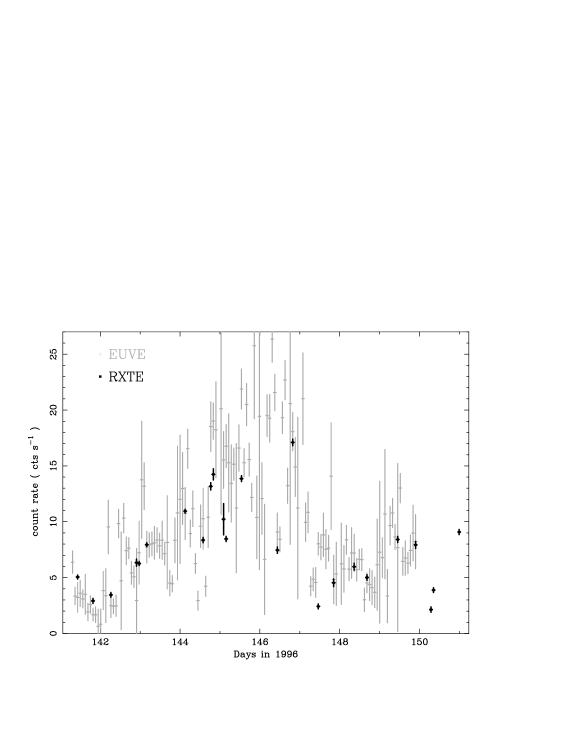
We show the background-subtracted RXTE (2–10 keV) and EUVE lightcurves for the May observations in Fig. 1. For presentation purposes, we have scaled up the EUVE lightcurve by a factor of 100. The bin width is 5544 s, which is the orbital period of EUVE. For clarity we do not show the May 6th observations (but we note that the 2–10 keV and EUVE count rates for this time were cts s-1 and 0.12 cts s-1 respectively). As can be seen from the figure, the EUVE count rate varies strongly between less than 0.05 cts s-1 and cts s-1. The 2–10 keV count rate also varies greatly between RXTE observations, with a range of between 3 cts s-1 and 17.4 cts s-1. The lightcurves for the December observations are shown in Fig. 2, using the same bin width and the same scaling factor for the EUVE lighcurve including, for completeness, the data obtained by both instruments outside the times of overlap. Strong variability can be seen, with NGC 4051 reaching a particularly low flux state during the period of overlap.

Visual inspection of the lightcurves shows a striking correlation between the two bands. We can quantify this correlation and search for lags between the two bands by carrying out a cross-correlation analysis of the lightcurves. In the context of this paper we are particularly interested in the relation of the power-law component of the X-ray spectrum to the EUV emission. Since NGC 4051 is known to display both variable low energy X-ray absorption and an iron fluorescent emission line at keV [Guainazzi et al. 1996], we will exclude these components and obtain the ‘pure’ power-law contribution to the emission by extracting a lightcurve in the 4–10 keV band, excluding 5–7 keV (corresponding to PCA channels 12–14 and 21–28 in the current gain epoch 3).
We compute the cross-correlation function (CCF) of the time series using the Z-transformed Discrete Correlation Function (ZDCF) method of Alexander (1997), which is based on the DCF method of Edelson & Krolik (1988) but estimates errors more reliably. We calculate seperate ZDCFs for May and December 1996 and bin up the resulting noisy ZDCFs (which have different binning) into identical 20-ks-wide bins, before combining them by adding together values corresponding to the same lag (weighting according to errors). We show the resulting combined ZDCF in Fig. 3.
A simple visual inspection of the ZDCF indicates that the EUV band leads the X-rays by between 0 and 20 ks. Simulations of perfectly correlated lightcurves (with zero lag) which use the same sampling pattern as our data show that the peak at 20 ks is probably artificial, due to an excess of data pairs sampled at that particular lag. Therefore, we believe that the most likely lag is within the 0 ks bin. We now turn to an alternative technique for constraining the lag, which is not affected by the sampling pattern.
4 a simple spectral model
The simplest explanation for the strong correlation between the EUVE and RXTE lightcurves is that both instruments are sampling the same continuum, i.e the X-ray power-law extends to the EUV band. A detailed spectral analysis of the RXTE data will be described in a later work, but here we can test the hypothesis that the EUV continuum is an extension of the X-ray power-law continuum by fitting a simple power-law to the 4–10 keV (excluding 5–7 keV) region of the spectrum for the brightest observation in May. We find a power law slope (photon index, ) of , corresponding to a 2–10 keV flux of ergs cm-2 s-1. If we use these parameters in the pimms v2.3 count rate calculator, assuming a galactic absorption of cm-2, we obtain a predicted EUVE DS/S (Lexan/B) count rate of cts s-1. This agrees well with the actual EUVE count rate (simultaneous with the 500 s long RXTE observation) of cts s-1. Note that because the EUVE count rate can be adequately explained as the extrapolation of the X-ray power law modified by Galactic absorption, there is no requirement for a significant neutral column in the AGN host galaxy, a result consistent with previous ROSAT and ASCA observations. The lack of any significant absorbing column (in addition to Galactic) implies that the significant low energy X-ray absorption seen in previous observations of NGC 4051 (McHardy et al., 1995; Guainazzi et al., 1996) must be due to ionised gas (so that hydrogen and helium are virtually completely ionised). This is again consistent with previous observations, which indicate that the X-ray absorption is due to an ionised ‘warm absorber’.

Previous observations of NGC 4051 with EXOSAT [Papadakis & Lawrence 1995] and recently ASCA [Guainazzi et al. 1996], indicate that the photon index of the X-ray power-law is positively correlated with the source luminosity, in the sense that the continuum becomes softer as the source flux increases. An inspection of the scaled EUVE and RXTE lightcurves indicates that this may indeed be the case; there is a tendency for the linearly scaled EUVE flux to exceed the 2–10 keV count rate when the source is bright, and vice versa when the source is dim. If the EUVE count rate can be described as a simple function of the RXTE count rate, we can fit such a function to the data. The scaled lightcurves indicate that the EUVE count rate scales with the RXTE count rate in a non-linear way. We suggest a simple function of the form:
where and are the predicted EUVE count rate and the RXTE (4–10 keV, excluding 5–7 keV) count rate respectively. , and are constants. The error on the predicted values is given by:
where and are the errors on the EUVE and 4–10 keV count rates respectively.
For given parameters , and we can calculate the predicted value (and error) of for each point in the RXTE lightcurve and compare with the actual values by calculating a value, defined as:
Where and are the measured values of the EUVE count rate and associated error respectively, and the sum is over the pairs of data points that are measured simultaneously in both bands. By stepping through a range of values of the parameters we can attempt to find the set of best-fitting model parameters.
We use the 4–10 keV band of the RXTE data (excluding 5–7 keV), so that we sample only the continuum component of the X-ray spectrum. Due to orbital constraints there are gaps in the EUVE lightcurve so that not all RXTE data points have corresponding simultaneous EUVE data points. We therefore bin the lightcurves into identical 1 ks bins (so the corresponding time for each bin is the same for both the EUVE and 4–10 keV lightcurves). In this way we only sample times where the EUVE and RXTE data are simultaneous to within 1 ks. This restriction is necessary because large flux changes can occur on timescales of a few ks, so the flux in both bands must be measured as simultaneously as possible to allow a good comparison between bands. We next fit the simultaneous data with our model.
We first fit a simple linear model to the data (). We obtain best-fit values of and , with for 31 degrees of freedom. This model is acceptable, but a non-linear model (allowing to be a free parameter) improves the fit (), with best-fit values , and . Negative and positive values of (as given by the linear and non-linear model fits) correspond to constant flux components in the RXTE and EUVE bands respectively. Recently NGC 4051 was observed in an ultra-low state by BeppoSAX, RXTE and EUVE (Guainazzi et al. 1998, Uttley et al. 1999). The BeppoSAX and EUVE observations revealed a constant soft component which may be associated with the extended emission in the host galaxy imaged by ROSAT (Singh 1999). This component contributes an EUV flux consistent with the constant value estimated by our non-linear model fit. Additionally, RXTE and BeppoSAX detected a constant hard component which may be due to reflection from a molecular torus. On its own, such a component would lead to a negative value of . The exact value of , which is at present not well constrained, is determined by a trade-off between these two constant components. We note also that fluctuations in the cosmic X-ray background, which are unaccounted for by the PCA background model, could lead to some additional constant negative or positive offset which will contribute to . However, the good agreement between the simultaneous medium-energy X-ray spectra obtained by BeppoSAX and RXTE during the ultra-low state (Uttley et al. 1999) shows that any offset due to inaccurate background estimation is much smaller than any offset due to the torus component. Using our data, we cannot formally rule out either the non-linear or linear model, however the -test indicates that the non-linear model is better at describing the data at confidence. In figure 4 we show a comparison of the linear and non-linear models with the data.
The fact that we can successfully model (reduced ) the relationship between both energy bands to a simultaneous time resolution of 1 ks implies that there is no significant lag between the bands (i.e. any lag is less than 1 ks). This result is consistent with the less-than-unity value of the zero-lag peak in the lower resolution CCF. We can rule out the possibility that our model is so general that it will fit any time lag by shifting the lightcurves with respect to each other and fitting the model. If we cause the EUVE lightcurve to lag the RXTE lightcurve by 1 ks, the best-fitting non-linear model yields . If we cause the RXTE lightcurve to lag the EUVE lightcurve by 1 ks we obtain . If the RXTE lightcurve lags the EUVE lightcurve by 2 ks we find . Clearly the model does not easily fit other lags, although a lag of 1 ks between the X-ray and EUV bands is allowed by the model. We might expect the model to fit short lags even if the true lag is zero, since both lightcurves are autocorrelated on short timescales (ks). In any case, it remains true that effectively zero lag between the bands is adequate to describe the data.
Recent simultaneous observations of NGC 5548 with RXTE and EUVE showed evidence that the 2–20 keV X-ray variations lagged changes in the EUV by 35 ks (Chiang et al. 1999). Scaling this lag by the black hole mass, using the masses of NGC 4051 ( M⊙) and NGC 5548 ( M⊙) measured by reverberation mapping (Wandel, Peterson & Malkan 1999), we predict an X-ray–EUV lag of s in NGC 4051, consistent with our upper limit.
5 Discussion
We have shown that the variable X-ray and EUV fluxes almost certainly come from the same spectral component, and that the best-fitting model to describe the relationship between the fluxes in both bands is probably non-linear, implying that increases in continuum flux are accompanied by spectral slope changes. Specifically, the power-law steepens as the continuum flux increases. This behaviour was observed previously by ASCA [Guainazzi et al. 1996]. Using pimms we can estimate the change in power-law slope associated with a doubling of the RXTE count rate assuming . The corresponding slope increase is , a value consistent with the results obtained by Guainazzi et al.
By constraining the lag between the EUV and 4–10 keV bands to be less than 20 ks or less than 1 ks (depending on whether we take the conservative result of the ZDCF, or the more speculative result of the scaling model), we can constrain the physical size of the Comptonising region in the context of simple upscattering models. In this context, the lag between the EUV and 4–10 keV bands corresponds to the time taken to upscatter EUV photons to medium X-ray energies (regardless of the energy of the initial seed photons). We now consider a simple Comptonisation model, where the EUV photons originate at the centre of a homogeneous spherical cloud of thermal electrons, and are upscattered on their way through the cloud to produce the medium-energy X-ray photons. We use this simple model to estimate an upper limit to the size of the X-ray emitting region.
The time spent to upscatter a photon from an energy to a higher energy is:
| (1) |
where is the number of scatterings required to raise the energy from to and is the mean free path of the photon between scatterings. The mean free path is given by:
| (2) |
where is the electron density and is the Thomson cross-section (assuming ). We can express in terms of the optical depth of the Comptonising cloud, and the radius of the cloud, :
| (3) |
Incorporating equations 2 and 3 into equation 1, and rearranging yields:
| (4) |
so that substituting our maximum lag for sets an upper limit on . The number of collisions required to scatter the photons from energy to depends on the electron temperature, (e.g. see Longair, 1992). In the non-relativistic regime, the number of scatterings is given by:
| (5) |
The electron temperature is not well constrained, but because the power-law continuum extends right across the useful PCA band (up to 15 keV) with no cut-off at the highest energies, we are justified in assuming a lower limit to the electron temperature of keV. OSSE observations of Seyfert galaxies show high energy cutoffs in their continua which correspond to typical electron temperatures of keV ( keV in the case of NGC 4151) [Zdziarski et al. 1997], consistent with our simple non-relativistic assumption.
The ratio of photon energies between the two bands is , so for an example where keV, . For keV, . For photon energies , the optical depth for Compton scattering in a spherical cloud can be determined from the spectral slope of the resulting Comptonised continuum [Posdnyakov, Sobol & Sunyaev 1983]:
where is the energy spectral index of the Comptonised continuum. Using the spectral index of 1.3 measured by RXTE, we find for keV, and for of 25 keV. Therefore, in the range of temperatures 25–100 keV, we expect the ratio . Using this limit in equation 4, we arrive at an upper limit for assuming s:
A size of cm corresponds to Schwarzschild radii for a M⊙ black hole. Thus, if the power-law continuum is produced by a single central source, the emitting region is very close to the central black hole. Alternatively, in disk corona models (e.g. see Haardt, Maraschi & Ghisellini, 1997) the power-law continuum is produced by the scattering of thermal photons from an accretion disk in a hot corona above the disk. In this case, the continuum may originate in many scattering regions spread over the disk, so the size constraint we impose may represent the size of a typical scattering region. Note that this size limit increases by a factor if we instead choose the more conservative 20 ks upper limit on the lag, inferred from the ZDCF.
We note here that Monte Carlo simulations of thermal Comptonisation in the relativistic regime [Skibo et al. 1995] show that if , for keV. In the case of very low optical depth to scattering, EUV and X-ray photons may undergo only one upscattering from the original seed photons before leaving the Comptonising cloud. In this case, upper limits to lags between the two bands yield no information regarding the size of the Comptonising region. This situation is extreme however, but in the case of NGC 4051 we cannot be completely confident in our assertion of a small Comptonising region until finite lags are measured between different energy bands, or a spectral cut-off is determined.
Finally, we note that although our constraint on the size of the emitting region in NGC 4051 is model dependent, simple causal arguments place a model-independent upper limit of cm on the separation between the EUV and X-ray emitting regions, if the lag between both bands is less than 1 ks. Combining this constraint with the rapid variability seen in both bands, we can infer that the continuum in both bands is emitted co-spatially within a region of that size (i.e., 1000 light-seconds).
6 Conclusions
In the introduction to this paper, we raised two key questions which would shed light on the nature of the X-ray continuum production mechanism in Seyfert Galaxies, namely how low in energy does the power-law extend? And are there any lags between the X-ray band and lower energy bands? We have answered these questions to some extent in the case of NGC 4051. We have shown that the EUV variability of NGC 4051 can be adequately explained as being due to the extension of the X-ray power-law into the EUV band. This implies that the source of ‘seed’ photons required must be looked for at lower energies. Done et al. (1990) have shown that NGC 4051 does not vary significantly in the optical band, so the X-ray power-law must end somewhere in the UV, Far UV or in the unobservable, heavily absorbed EUV band above the Lyman edge.
We have shown that there are no significant lags down to timescales of 20 ks, and that if the EUV emission is the extension of the X-ray power-law (of varying slope or otherwise), the lag is reduced much further to less than 1 ks. This places strong constraints on the size of the Comptonising region, implying that it lies within a few gravitational radii of the central black hole for a typical black hole mass of between and M⊙, if the X-ray source is central.
Since NGC 4051 is a low luminosity Seyfert galaxy, we might expect that more luminous AGN will contain larger continuum emission regions. The lack of strong variability in higher luminosity AGN makes the type of study outlined in this paper difficult, but the high count rate, high observations that will be available with XMM should prove excellent for constraining the size of the continuum emission region across a range of source luminosities.
Acknowledgments
We wish to thank the RXTE and EUVE schedulers and Guest Observer support teams for efficiently co-ordinating and supporting these observations. We also thank the anonymous referee for helpful suggestions. PU acknowledges financial support from the Particle Physics and Astronomy Research Council, who also provided grant support to IMcH. AF was supported by AXAF Science Center NASA contract NAS 8-39073. IC was supported by NASA grants NAG5-3191 and NAG5-3174.
References
- [Abbot et al. 1996] Abbott M., Boyd W., Jelinsky P., Christian C., Miller-Bagwell A., Lampton M., Malina R. F., Vallerga J. V., 1996, ApJS, 107, 451
- [Alexander 1997] Alexander T., 1997, in Maoz D. et al., ed., Astronomical Time Series, Kluwer Academic Publishers, Netherlands, p. 163
- [Chiang et al. 1999] Chiang J., Reynolds C. S., Blaes O. M., Nowak M. A., Murray N., Madejski G., Marshall H. L., Magdziarz P., 1999, ApJ, submitted
- [Clavel et al. 1992] Clavel J. et al., 1992, ApJ, 393, 113
- [Done et al. 1990] Done C., Ward M. J., Fabian A. C., Kunieda H., Tsuruta S., Lawrence A., Smith M. G., Wamsteker W., 1990, MNRAS, 243, 713
- [Edelson & Krolik 1988] Edelson R. A., Krolik J. H., 1988, ApJ, 333, 646
- [Edelson & Nandra 1999] Edelson R. A., Nandra K., 1999, ApJ, 514, 682
- [Edelson et al. 1996] Edelson R. A. et al., 1996, ApJ, 470, 364
- [Elvis, Lockman & Wilkes 1989] Elvis M., Lockman F. J., Wilkes B. J., 1989, AJ, 97, 777
- [Fiore et al. 1992] Fiore F., Perola G. C., Matsuoka M., Yamauchi M., Piro L., 1992, A&A, 262, 37
- [Fruscione et al. 1999] Fruscione A., Cagnoni I., McHardy I. M., Papadakis I. E., 1999, in prep.
- [Guainazzi et al. 1996] Guainazzi M., Mihara T., Otani C., Matsuoka M., 1996, PASJ, 48, 781
- [Guainazzi et al. 1998] Guainazzi M. et al., 1998, MNRAS, in press
- [Haardt, Maraschi & Ghisellini 1997] Haardt F., Maraschi L., Ghisellini G., 1997, ApJ, 476, 620
- [Lawrence et al. 1987] Lawrence A., Watson M. G., Pounds K. A., Elvis M., 1987, Nat, 325, 696
- [Leighly et al. 1996] Leighly K. M., Mushotzky R. F., Yaqoob T., Kunieda H., Edelson R., 1996, ApJ, 469, 147
- [Longair 1994] Longair M. S., 1992, High Energy Astrophysics Vol. 1, CUP, Cambridge
- [McHardy 1988] McHardy I. M., 1988, Mem. Soc. Astron. Ital., 59, 239
- [McHardy et al. 1995] McHardy I. M., Green A. R., Done C., Puchnarewicz E. M., Mason K. O., Branduardi-Raymont G., Jones M. H., 1995, MNRAS, 273, 549
- [Marshall et al. 1997] Marshall et al., 1997, ApJ, 479, 222
- [Nandra et al. 1998] Nandra K., Clavel J., Edelson R. A., George I. M., Malkan M. A., Mushotzky R. F., Peterson B. M., Turner T. J., 1998, ApJ, 505, 594
- [Nowak et al. 1999] Nowak M. A., Vaughan B. A., Wilms J., Dove J. B., Begelman M. C., 1999, ApJ, 510, 874
- [Page 1985] Page C. G., 1985, Sp. Sci. Rev., 40, 387
- [Papadakis & Lawrence 1995] Papadakis I. E., Lawrence A., 1995, MNRAS, 272, 161
- [Posdnyakov, Sobol & Sunyaev 1983] Posdnyakov L. A., Sobol I. M., Sunyaev R. A., 1983, Astrophysics & Space Physics Reviews, 2, 263
- [Ramos et al. 1997] Ramos E., Kafatos M., Fruscione A, Bruhweiler F. C., McHardy I. M., Hartman R. C., Titarchuk L. G., von Montigny C., 1997, ApJ, 482, 167
- [Singh 1999] Singh K. P., 1999, MNRAS, in press
- [Sirk et al. 1997] Sirk M. M., Vallerga J. V., Finley D. S., Jelinsky P., Malina R.F., 1997, ApJS, 110, 347
- [Skibo et al. 1995] Skibo J. G., Dermer C. D., Ramaty R., McKinley J. M., 1995, ApJ, 446, 86
- [Wandel, Peterson & Malkan 1999] Wandel A., Peterson B. M., Malkan M. A., 1999, ApJ, in press
- [Welsh et al. 1990] Welsh B. Y., Jelinsky P., Vallerga J. V., Vedder P. W., Finley D. S., Malina R. F., 1990, Proc. SPIE, 1343, 166
- [Zdziarski et al. 1997] Zdziarski A. A., Johnson W. N., Poutanen J., Magdziarz P., Gierlinski M., 1997, Proc. of the 2nd INTEGRAL Workshop, ESA SP-382, 373