Simultaneous Observations of GRS 1758–258 in 1997 by VLA, IRAM, SEST, RXTE and OSSE: Spectroscopy and Timing
Abstract
We report the results of our multi-wavelength observations of GRS 1758–258 made in August 1997. The energy bands include radio, millimeter, X-ray, and gamma-ray. The observations enable us to obtain a complete spectrum of the source over an energy range of 2 – 500 keV. The spectrum shows that GRS 1758–258 was in its hard state. It is well fitted by the Sunyaev-Titarchuk (ST) Compton scattering model with a plasma temperature of 45 keV and a Thomson depth of 3.3. Taking relativistic effects into account, we get a little higher plasma temperature (52 keV) by using the improved version of the ST model (HT model) plus a soft black-body component. The spectrum is also fit by a power law with an exponential cutoff (PLE) plus a soft black-body component. The temperature of the soft components in both models is about 1.2 keV, and the energy flux is less than 1.5% of the total X- and gamma-ray flux. The deduced hydrogen column density is in the range of cm-2. No significant iron lines are detected. The radio emission has a flat energy spectrum. The daily radio, X-ray and gamma-ray light curves show that GRS 1758–258 was stable during the observation period, but was highly variable on smaller time scales in X- and gamma-rays. The power density spectra are typical for the low-state, but we find the photon flux for the 5 to 10 keV band to be more variable than that in the other two energy bands (2 – 5 keV and 10 – 40 keV). Harmonically spaced quasi-periodic oscillations (QPOs) are observed in the power spectra. The phase lags between the hard photons and the soft photons have a flat distribution over a wide range of frequencies. A high coherence of about 1.0 (0.01 – 1 Hz) between the hard photons and the soft photons is also obtained in our observations. We compare these results with two variation models. Our millimeter observations did not reveal any conclusive signatures of an interaction between the jet from GRS 1758–258 and the molecular cloud that lies in the direction of GRS 1758–258.
1 Introduction
GRS1758–258, discovered by ART-P and SIGMA on GRANAT in the spring of 1990, is one of the brightest persistent sources above 100 keV in the vicinity of the galactic center (Sunyaev et al. (1991)). Its spectrum extends up to 300 keV, and because this hard spectrum resembles those of other black hole candidates (BHC) in the hard (= soft X-ray low) state, GRS1758–258 is generally considered to be a BHC (Tanaka & Lewin (1995); Liang & Narayan (1997); Liang (1998); Poutanen (1998)). The nature of the donor star orbiting around the black hole is still controversial, although a high mass companion is certainly ruled out (e.g. Martí et al. (1998)). Monitoring has shown that the source was in this hard state for almost a year during a three-year period before the hard X-ray flux (above 35 keV) decreased by a factor of 10 (Gilfanov et al. (1993); Kuznetsov et al. (1999)). This decrease in the hard X-ray flux may indicate a transition from the hard state to the soft (= soft X-ray high) state. Unfortunately, the lack of simultaneous soft X-ray observations prevents us from drawing a definitive conclusion about the transition. A significant soft X-ray excess was suggested by simultaneous ROSAT-SIGMA observations in 1993, when the hard component had a lower intensity (Mereghetti, Belloni, & Goldwurm (1994)). But a reanalysis suggests that the excess was due to the contamination from GX 5–1 (Grebenev, Pavlinsky, & Sunyaev (1997)). From ASCA observations, it was inferred that the soft component contributes only a few percent of the total X-ray and gamma-ray flux when the source is in its hard state although there were no simultaneous gamma-ray observations (Mereghetti et al. (1997)). A significant soft component for GRS 1758–258 was also reported by Heindl & Smith (1998), and in 1999 it has oscillated between the hard and soft states(Smith, Heindl, & Swank (1999)). To be able to understand the nature of the soft component when the spectrum is in its hard state, it is essential to have good simultaneous coverage of GRS 1758–258 over as broad an energy range as possible.
Here we report the results of our simultaneous radio, millimeter, X-ray and gamma-ray observations of GRS 1758–258 in August 1997. The radio observations were performed by the Very Large Array (VLA). The millimeter observations were performed by IRAM, and we compared to the early observations made using the Swedish ESO Sub millimeter Telescope (SEST) at La Silla (Chile). The X-ray and gamma-ray observations involved the Proportional Counter Array (PCA) and High Energy X-ray Timing Experiments (HEXTE) on the Rossi X-Ray Timing Explorer (RXTE) and the Oriented Scintillation Spectrometer Experiment (OSSE) on the Compton Gamma-Ray Observatory (CGRO). Since the energy ranges of these three instruments overlap, we get a good measurement of the complete X- and gamma-ray spectrum.
The rapid X-ray variability can also provide direct information about the accretion disk. Observations of GRS 1758–258 made by RXTE in 1996 (Smith et al. (1997)) found that the source had a typical power spectrum for BHCs in their hard states. The integrated fractional rms amplitude (IFRA) was 24%. Unlike the case in 1996 when the power spectrum had little energy dependence, our observations show that the 5 – 10 keV band was more variable than the 2 – 5 keV and 10 – 40 keV bands.
In section 2, we describe the details of the observations and data reductions. Daily and short time scale light curves are shown in section 3. In section 4, we present the analysis of the spectral data. The timing analysis is discussed in section 5. We summarize the results in section 6.
2 Observations and Data Reductions
2.1 Radio Observations
At radio wavelengths, GRS 1758–258 has been found to be a “microquasar” with relativistic jets emanating from a central variable source VLA-C (Rodríguez, Mirabel, & Martí (1992); Mirabel & Rodríguez (1994)).
We performed a series of nine VLA observations between 1997 August 3 – 24, spanning our entire CGRO run. Some of these were simultaneous with the RXTE observations discussed in §2.2. All the observations were made in the C configuration at the 6 and 3.5 cm wavelengths (4860 and 8460 MHz), with a bandwidth of 100 MHz. The VLA runs were all 2 hours long except for 1.5 hours on August 15. This included time for both amplitude and phase calibration: the amplitude calibrator was 1331+305 and the phase calibrator 1751–253, whose bootstrapped flux density was always close to 0.48 Jy at 6 cm and 0.27 Jy at 3.5 cm, respectively.
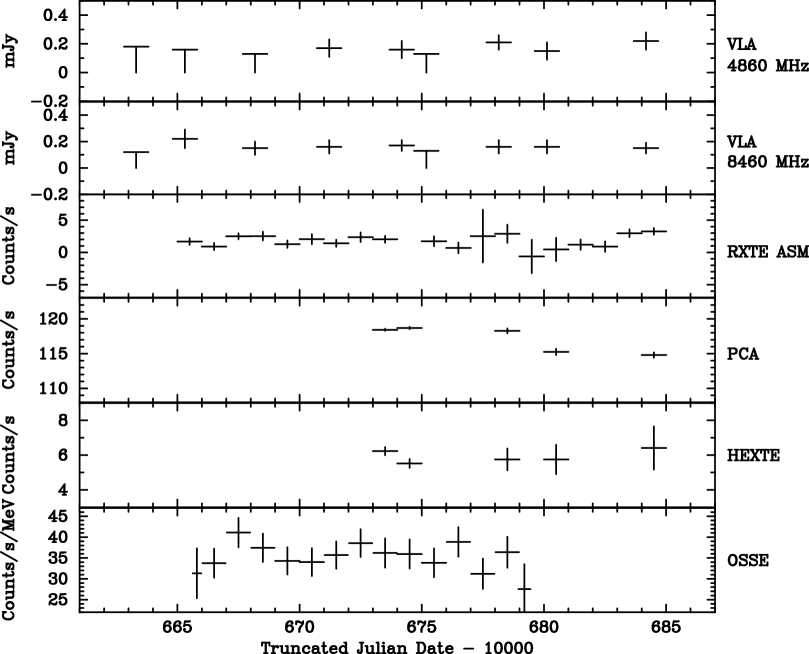
Table 1 gives the flux densities for the central radio source for each of our separate observations. The flux densities and errors have been measured by fitting an elliptical Gaussian to the source with the AIPS task JMFIT. The upper limits are based on the map rms noise, measured using the AIPS task IMSTA. The radio light curves are also plotted in Figure 1. As has been found previously, VLA-C is often a weak radio source close to the detection threshold in our daily observations.
The central source is clearly detected () when we concatenate the VLA data from all our 1997 August 3–24 observations. The average flux density values were mJy at 4860 MHz and mJy at 8460 MHz, giving a flat spectral index of . We combine the averaged radio spectrum with our averaged X-ray and gamma-ray spectra in Figure 8.
The radio emission suggests the continual presence of an outflow from VLA-C. The approximately flat spectrum is not consistent with optically thin emission (unless the electron distribution is exceptionally hard) and is indicative of some synchrotron self-absorption in the radio-emitting regions. One possible geometry would be a conical jet such as discussed in Hjellming & Johnston (1988).
For comparison, in 1997 August the nearby source VLA-D had average flux densities of mJy at 4860 MHz and mJy at 8460 MHz, giving a spectral index of . The 6 cm flux density of VLA-D is the value it had in 1992 which was also measured in the C configuration (Rodríguez, Mirabel, & Martí (1992)). Maps and further details of these and other VLA observations of GRS 1758–258 will be presented elsewhere (J. Martí et al. 2000, in preparation).
2.2 Millimeter Observations
The discovery of a molecular cloud (Bally & Leventhal 1991; Mirabel et al. 1991) in the direction of 1E 1740.7–2942 raised the picture of a compact source embedded inside a molecular cloud that is accreting material from the cloud. GRS 1758–258 has similar X-ray properties to 1E 1740.7–2942, but the lower value of suggests that GRS 1758–258 is not inside a dense molecular cloud (Chen, Gehrels, & Leventhal 1994).
To determine whether there is a molecular cloud in the direction of GRS 1758–258, we performed millimeter observations during our multi-wavelength campaign on 1997 August 7 using the IRAM 30-m telescope at Pico Veleta (Spain). We also report here on earlier millimeter observations of GRS 1758–258 that were conducted in April 1995 and October 1995 using the 15-m SEST.
As well as observing the core radio source, we also made millimeter observations along the radio jets in order to look for signatures of the jet interaction with a molecular cloud such as an increase in the width of the line or the detection of wings in the peak. For example, we previously detected a correlation between the ROSAT X-ray hot spots and the CO mm measurements in observations of SS 433 (Durouchoux et al. 1999). The higher ionization environments in shocked molecular gas and near X-ray sources can also enhance the emission from molecules such as and HCN (Krolik & Kallman 1983; Phillips & Lazio 1995; Lepp & Dalgarno 1996; Yan & Dalgarno 1997).
2.2.1 SEST Observations
We performed observations using the transition at 115.3 GHz and the transition at 230.5 GHz. Observations were made in the direction of the core source ( 17:58:07, 25:44:30, epoch 1950.0) and at one location in the northern radio jet ( 17:58:06.8, 25:43:45) and one in the southern jet ( 17:58:05.5, 25:45:50). The observations were carried out in a position beam switching mode, choosing an absolute reference position in and in away from the source. Such a distant location was required to find a region without radio emission in the crowded Galactic center area.
The receivers yielded an overall system temperature (including sky noise) and 300 K at 115 and 230 GHz respectively. The backend was an acousto-optical spectrometer. The low resolution spectrometer with a channel separation of 0.7 MHz (or 2.4 ) was used for these observations. The antenna beam-widths were 45″ and 23″ for the and transitions respectively. All the spectral intensities were converted to the main brightness temperature scale, correcting for a mean beam efficiency of 0.7 at 115 GHz and 0.5 at 230 GHz. The calibration was checked by monitoring M17SW, and was found to be consistent between the different observing periods to within 19%. The pointing accuracy, obtained from measurements of the SiO maser W Hya, was better than 5″.
A molecular cloud was found in and in the direction of GRS 1758–258 with a velocity . The results are given in Table 2. The peak area / ratio of is consistent with the values found in other molecular clouds (Oka et al. 1998).
A line with the same velocity was also detected in the northern and southern parts of the jet. For the northern direction, the flux density was slightly lower than in the core direction, but not significantly. For the southern direction, the width of the line is slightly larger than for the core source, but again not significantly. was also detected in the north and south jets with velocities, peak areas, and line widths consistent with the ones measured for this transition in the core source. We conclude that there are no obvious signatures for the interaction of the jet with the molecular cloud.
We also searched for the line in the and transitions, but no significant detections were made: integrating over 10 minutes the mean upper limit was K for both the transitions. We also did not detect the or lines: the mean upper limit was K.
2.2.2 IRAM Observations
We observed simultaneously in the transition at 89.2 GHz with the SIS 3mm-1 receiver, in the transition at 88.6 GHz with the SIS 3mm-2 receiver, in the at 220.4 GHz with the 230G1 receiver, and the transition at 230.5 GHz with the 230G2 receiver. The half power beams varied from 27″ at 90 GHz to 10.4″ at 230 GHz. As for the SEST runs, the observations were carried out in a position beam switching mode, choosing an absolute reference position in and in away from the source. The main system temperatures were 356, 389, 912, and 1000 K, and the opacities 0.16, 0.18, 0.58, and 0.62 at 89.2, 88.6, 220.4, and 230.5 GHz respectively.
We observed GRS 1758–258 at 12 different positions on the jet axis separated by 24″. The integration time was 1 minute on each location. The individual observations did not have sufficient significance to study the line emissions, and so we added them together to make an average result for each transition.
We did not detect any lines in the (0.04 K, ) and (0.6 K, ) spectra. The transition was clearly detected at with a line width of , similar to that seen earlier by SEST. However, the intensity of K and peak area of are almost double those seen earlier by SEST.
The transition was also detected in our IRAM observation at with a line width of , intensity K and peak area of . Although the statistical significance is weak, this also seems to be brighter than was seen in our SEST observations.
The comparison between the SEST and IRAM results suggests a brightening in the outflow in the 2 years between the observations. The fact that the IRAM beam size is less than half that of SEST implies that if the emission is diffuse, there has actually been an increase of in the line emissions. However, we caution that a longer-term monitoring program is required to prove that the line emissions are variable.
We conclude that while there is a molecular cloud in the direction of GRS 1758–258, we have not yet found any conclusive signatures that there is an interaction between the jet and this molecular cloud. We suggest that longer observations using the transition would also be worthwhile to search for an interaction.
2.3 RXTE Observations
The PCA consists of five Xe proportional counters with a total effective area of about 6500 (Jahoda et al. (1996)). Its sensitive energy range is from 2 to 60 keV with an energy resolution of 18% at 6 keV, and a time resolution of 1 s. The HEXTE consists of two independent clusters (clusters A and B) each containing four phoswich scintillation detectors (Rothschild et al. (1998)). It has a total effective area of 1600 cm2 and a sensitive energy range of 15 – 250 keV with an energy resolution of 15 % at 60 keV and a time resolution of 8 s. Both the PCA and the HEXTE have a field of view of (FWHM).
Both the PCA and HEXTE made observations on 5 days during the period of August 13 - 24, 1997. During the observations, the on-source pointing direction (RA = 270.315∘, DEC = –26.245∘, J2000) was offset from GRS 1758–258 by half a degree to avoid the X-ray source GX 5–1, which is away from the on-source location. The flux of GX 5–1 during the observation was about 1 Crab based on the observations by the All Sky Monitor (ASM) on the RXTE. However, the offsetting effectively reduced the contamination from GX 5–1, whose contribution is estimated to be much less than 0.033% of the total count rate in the energy band of 2 – 12 keV. The HEXTE cluster A was rocked by and cluster B by to make the background measurements with a switching time of 16 seconds. The PCA has no direct background measurements.
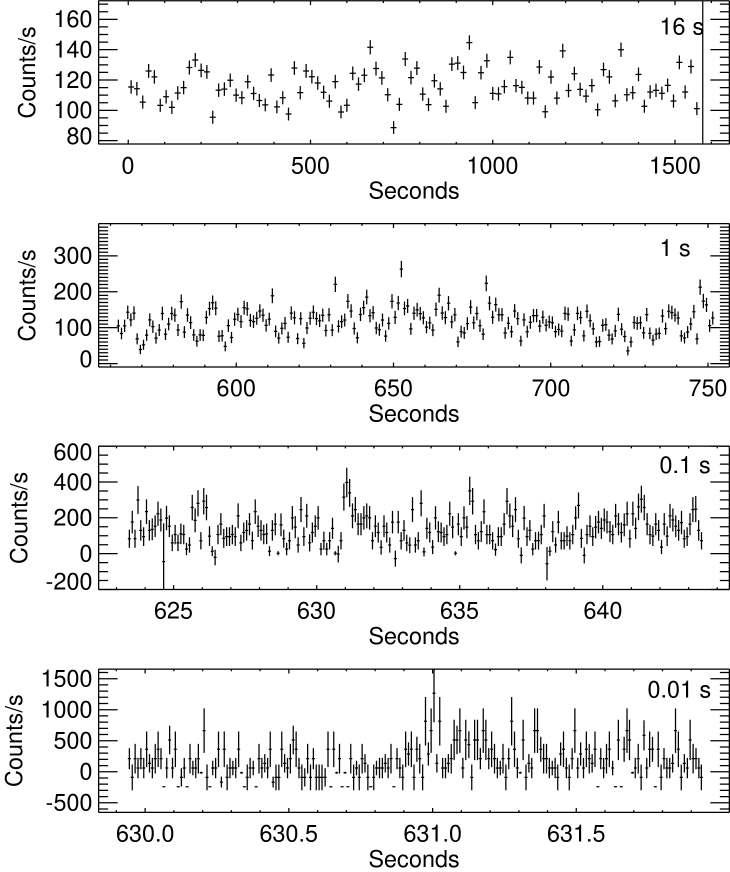
The PCA and HEXTE data were reduced using FTOOLS 4.1.1. Both data sets were screened so that only those data were used when the spacecraft was not passing through the South Atlantic Anomaly and when the source was observed at elevations above the Earth’s limb and the pointing was offset from the on-source pointing to filter out the slew data. After the screening, 14 observation segments have valid data. The start and stop times of each segment are listed in Table 3. Figure 2 shows the PCA 16-second resolution light curves for the 14 observation segments.
For the PCA, Standard 2 production data from all layers of the five PCU detectors were used to generate an average spectrum over our entire RXTE run. The FTOOLS program PCARSP (version 2.36) was used to generate the response matrix file with corrections made for the off-axis pointings. The total exposure time with dead-time correction is 33399 seconds. A scheme of adding systematic errors to the PCA data was also applied (Rothschild et al. (1998)). The added errors are 0.5% for 2.5 – 5.5 keV, 1% for 5.5 – 8 keV, 0.5% for 8 – 20 keV, and 3% for 20 – 90 keV. The estimation of the PCA background is complicated by the fact that the current PCA background models do not include the galactic diffuse emission, which significantly contaminates our observations. We used the previous RXTE observations in the vicinity of GRS 1758–258 (Smith et al. (1997)) to estimate the contribution from the diffuse emission. By combining these background data with the detector internal background (Q6 + activation), we are able to estimate the true background for our PCA measurements. In the timing analysis, we neglect the time variation of the diffuse emission, which is estimated to be less than 10% of that of GRS 1758–258 based on the background observations. Therefore, we remove the effects of the diffuse emission by subtracting from the light curves constant count rates of 15.1 counts/s for the 2 – 5 keV band, 17.9 counts/s for 5 – 10 keV, and 8.4 counts/s for 10 – 40 keV.
For the HEXTE, we only used the cluster A data for the spectral analysis, because the data from cluster B are less reliable due to the count piling problem and the off-axis pointing. The data were taken using the E_8us_256_DXIF mode. The HEXTE background measurements agree very well with the on source measurement in the energy channels above 125 keV. The response matrix file hexte_97mar20c_pwa.rmf was used. The collimator effective area has been corrected with the calibration file hexte_pwa.fov for the off-axis pointing. The total exposure time with dead-time correction is 9683 seconds.
2.4 OSSE Observations
The OSSE instrument, consisting of four nearly identical NaI-CsI phoswich detectors, has a field of view of 3.8∘ 11.4∘ (FWHM), and has a sensitive energy range of 0.05 – 10 MeV with an energy resolution of 7.8% at 661 keV (Johnson et al. (1993)).
The current OSSE observations were carried out on August 5 – 19, 1997. During the observations, the four detectors made alternating on-source and off-source pointings with 2.048 minute dwell time on each pointing. The rocking direction, which is perpendicular to the long dimension of the collimator, was at an angle of 41∘ to the galactic plane to avoid confusing sources. The on-source pointing was at RA = 270.45∘, DEC = 26.12∘. Detectors 1 and 2 did the standard off-source pointings (RA = 257.45∘, DEC = –29.59∘; RA = 282.5∘, DEC = –21.37∘). However, due to the instruments’ configuration, detectors 3 and 4 could not be rocked to the regular off-source pointings, and instead had off-source pointings at + 12∘ and –7∘ (RA = 277.60∘, DEC = –23.48∘). Unfortunately, the known OSSE source GS 1826–24 (Strickman et al. (1996)) sits in the center of the –7∘ background pointing, and so we did not use the data from detectors 3 and 4.
The OSSE data were reduced with the IGORE data analysis package. A count spectrum and a response matrix were generated from the data of detectors 1 and 2 with the background subtracted. Both the count spectrum and the response matrix could be read by XSPEC (version 10.0) to make a joint fit with the PCA and the HEXTE data. The total OSSE exposure time is 320078 seconds.
Since the background pointings are 12 degrees away from the on-source pointing, the measured background, which IGORE automatically subtracts from the data during the processing, may be different from the real background at the on-source location. We have checked all the sources monitored by the ASM/RXTE. No other significant hard X-ray point sources are in the fields of view of detectors 1 and 2. However, an important problem is the spatial variation in the galactic diffuse emission (GDE). Since our background pointings are farther away from the galactic center than the on-source pointing, we need to make a correction to get the true on-source background. Based on several OSSE observations of the GDE and coordinated SIGMA observations (Purcell et al. (1996)), a model of the GDE distribution in and around the galactic plane is:
| (1) |
where is the photon flux emitted from a unit area in the galactic coordinates, is the photon energy in keV, and are the galactic longitude and latitude respectively, posm() is the positronium continuum spectrum defined in XPSEC, is the normalization factor of posm(), = 0.78 photons/cm2/s/keV/degree2, = 2.55, = , = = , and = . These numbers were determined by folding the observations at l=0∘, 25∘ and 339∘ through the detector response function, which is assumed to be a Gaussian function with a two-dimension FWHM of 3.8∘ 11.4∘. The lack of measurements at locations other than these three longitudes prevents us from determining the exact form of . But we can still set upper and lower limits to the background correction that should be made to our OSSE data. The lower limit is when = . The upper limit is when = for the on-source measurements and = for the off-source measurements. The two limiting versions of the correction spectrum are shown in Figure 4, which can be simulated with XSPEC and then subtracted from the OSSE data.
3 Light Curves
Daily light curves of the VLA, RXTE, and OSSE observations are shown in Figure 1. We fit constants to the light curves. The fitting results, listed in Table 4, show that GRS 1758–258 was stable on the day time scale, although there was a small decline in the flux observed by the PCA.
On shorter time scales, GRS 1758–258 is clearly variable. Significant variations are seen in the PCA 16-second light curves (Figure 2), which show the 14 valid observation segments. Some small bursts are seen in the light curves. In Figure 3, the observation segment 11 is examined at higher time resolutions. The peak near 650 seconds in the 16-second resolution light curve actually consists of several small bursts on the 1-second time scale. Moreover, a narrow burst near 630 seconds in the 0.1-second light curve still has substructure in the 0.01-second resolution light curve. However, these bursts are relatively small compared to those in other sources such as GX 339–4 (Smith & Liang (1999)).
4 Spectrum analysis
For all three instruments, we combined all the data to make one spectrum. Though the source is highly variable on small time scales, we will show in section 5.3 that there are no significant trends in the hardness ratio. Thus the average spectrum shown here should be a good representative shape, though the instantaneous amplitude varies significantly with time. Since the HEXTE data has fewer problems with the background, in the following discussion we will normalize the OSSE and PCA spectra to the HEXTE spectrum.
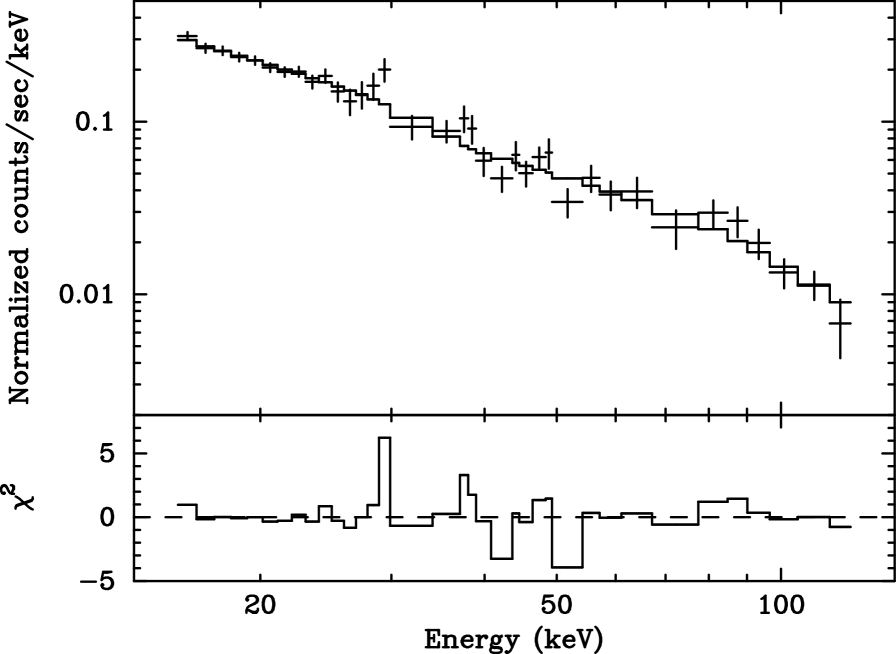
The HEXTE data can be well fit by a power law with photon index of 1.550.04 in the energy range of 15 – 125 keV (Figure 5). Above 125 keV, the background dominates the data. The photon flux between 20 – 100 keV is (2.0 0.4) 10-2 photons/cm2s. This is consistent with the average flux of (2.8 0.2) 10-2 photons/cm2s detected by the BATSE Earth Occultation technique in the same period. The errors are 1-sigma throughout this paper.
Figure 6 shows the joint spectra of the OSSE and HEXTE data. The fit model is a power law with an exponential cutoff (PLE):
| (2) |
where is the photon flux, is the normalization flux in the unit of photons/cm2/s/keV, E is the photon energy in keV, is the photon power-law index, and is the cutoff energy. The higher curve in the figure, which has been scaled up by a factor of 10 for illustrative purposes, has the minimum background correction applied to the OSSE data, while the lower curve is the maximum background correction case. The most significant spectral difference between the minimum and maximum corrections is the difference in the cutoff energies. This is not surprising, since the effect of the positronium continuum is significant only when the energy is close to and less than 511 keV.
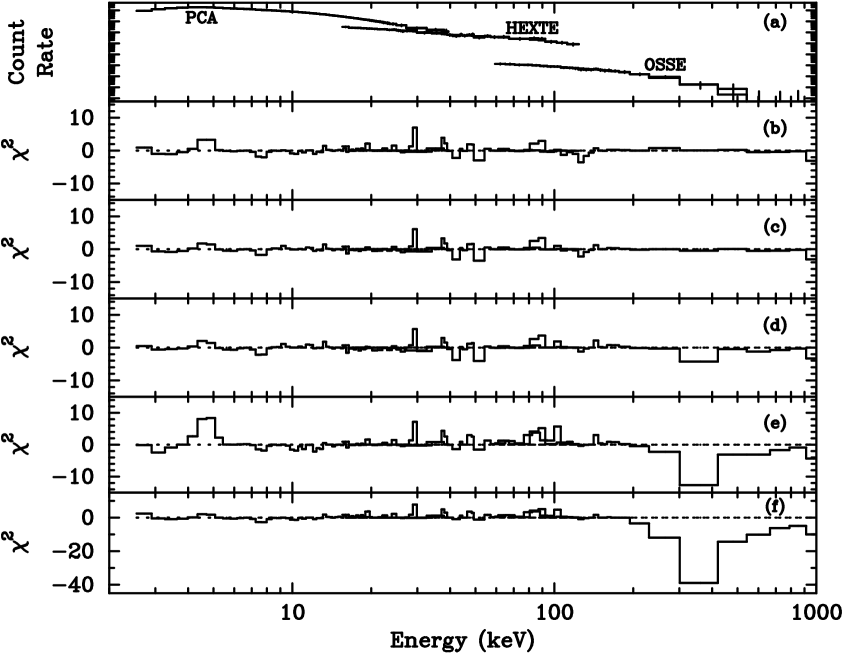
However, for a joint fit to the PCA, HEXTE and OSSE data, the PLE model alone (Figure 7(e)) is not as good as the Sunyaev-Titarchuk (ST) Compton scattering model (Sunyaev & Titarchuk (1980)). An example of a ST fit is shown in Figure 7 (a) & (b). In Table 5, we give the fit parameters for two cases, one using the Maximum OSSE background correction, the other using the Minimum. Since these two extreme cases set the limits for the parameters, we use the average values over the two cases (the Average column in Table 5) as the true values. Assuming a distance of 8.7 kpc, we get a soft X-ray luminosity (2 – 20 keV) of ergs/s and a hard X-ray luminosity (20 – 200 keV) of ergs/s. These values place GRS 1758–258 outside the “X-ray burst box” in Figure 1 of Barret, McClintock, & Grindlay (1996). This further supports that GRS 1758–258 is a black hole. The hydrogen column density is (2.0 0.1) cm-2, which is consistent with the ASCA and EXOSAT observations (Skinner (1991); Mereghetti et al. (1997)). The residuals in Figure 7 suggest that no significant iron lines are seen in the spectrum.
Titarchuk (1994) and Hua & Titarchuk (1995, hereafter HT, or COMPTT in XSPEC) generalized the ST model to cover a wide range of the plasma parameters, such as low Thomson depths and relativistic effects. The best HT model fit to the data gives a negative hydrogen column density () and a seed photon energy keV (or the cutoff energy in the lower end of the spectrum). The negative suggests that the true value of must be much smaller than 0.85 keV. In the further model fits, we set = 0.01 keV. because we don’t have valid data below 2.5 keV, the exact value of does not affect the fit results as long as it is much smaller than 0.85 keV. With the fixed , the HT model alone can not fit the data well. Adding a back-body component to the model gives a good fit (Figure 7(c)). The best fit parameters are listed in Table 6. Compared with the ST model, the HT model gives a slightly higher plasma temperature due to the relativistic corrections. The black body temperature is about 1.18 keV, which is much higher that the seed photon energy ( keV). Therefore, it is very likely that the soft component and the seed photons have different origins. The total flux of the soft black-body componnent is ergs/cm2/s, which is about 0.9% of the total continuum flux from 2 keV to 10 MeV. The low flux of the soft component in the hard state has been reported in the ASCA observations (Mereghetti et al. (1997)). The hydrogen column density given by the HT model is lower than that by the ST model, but is close to the ASCA results (Mereghetti et al. (1997)).
Adding a soft component to the PLE model also improves the fit, in particular to the shape of the residuals (Figure 7(d)). The fit parameters are listed in Table 7. The soft black-body component (BB) has a temperature of keV and a total flux of ergs/cm2/s, which is about 1.3 % of the total continuum flux from 2 keV to 10 MeV and is slightly higher than that given by the HT model. The hydrogen column density obtained from the (PLE + BB) model is lower than that from previous EXOSAT and ASCA observations. We therefore conclude that the (PLE + BB) model is less favored than the Compton scattering models (ST and HT models).
Figure 7(f) shows that a power-law model cannot fit the data. This means that the exponential cut-off is real. In Figure 8 we show the unfolded and normalized PCA, HEXTE and OSSE spectrum using the ST model.
5 Timing Analysis
The timing analysis was done only on the GoodXenon PCA data using all five PCUs. After the basic steps mentioned in section 2, background-subtracted light curves were generated for three energy bands: 2 – 5 keV, 5 – 10 keV, and 10 – 40 keV. From these light curves, power spectra, phase lags, coherences and hardness ratios were calculated. In the calculations, the counts have been summed into 46.875 ms bins, the power spectra etc. were generated for intervals that are 384 seconds long, and the results were then averaged.
5.1 Power Density Spectrum
We performed the power density spectra (PDS) analysis on the 14 separate segments. In all cases, the power spectrum had a white noise at high frequencies, and this has been subtracted from the results shown here. We normalized our plots so that their integral gives the squared fractional rms variability, i.e. the power spectrum is in the unit of rms2/Hz.
The power spectra in Figure 9, which have been averaged over all the observation segments, resemble the typical low-state power spectrum of GBHC: a flat noise at the low frequencies, rolling over to approximately a power law at higher frequencies (Van der Klis (1995)). We find that the power spectrum varies between the energy bands. The IFRA (0.0025 – 10 Hz) is , , and for the energy bands 2 – 5 keV, 5 – 10 keV, and 10 – 40 keV respectively. Our result is interestingly different from the previous RXTE observation in 1996 Aug. 3 – 5 when the IFRA (0.002 – 60 Hz) was nearly independent of energy: 26% (2 – 6 keV), 27% (6 – 13 keV), 25% (13 – 28 keV) (Smith et al. (1997)). It is also interesting to compare our results with other sources in their low states. GX 339–4, for example, had the highest variability in the 2 – 5 keV band during an RXTE observation (Smith & Liang (1999)). This energy dependence of the variability may be useful in characterizing different X-ray sources, and its implication is explored elsewhere (Lin et al. 1999a, b ).
We fit the general shape of the average PDS in Figure 9 using two zero-centered Lorentzians. Though a broken power law is also commonly used in the fitting, the double-Lorentzian model gives better fits in our case. An additional pair of Lorentzians QPOs are necessary to obtain a good fit. The Lorentzian function is defined as:
| (3) |
where is the frequency, is the central frequency, is the half width at half maximum (HWHM), and A is the area under the function (). The fit parameters are listed in Table 8. Unlike the previous observations of GRS 1758–258 (Smith et al. (1997)), the current observations detected the QPOs at 0.21 Hz and 0.42 Hz instead of at 0.4 Hz and 0.8 Hz.
Our power spectra are typical of low state power spectra, with two breaks at 0.1 Hz and 1 Hz. According to an inhomogeneous corona model (Böttcher & Liang (1999)), which assumes that soft photons are injected into an inhomogeneous corona from a blob spiraling into the central black hole, the two breaks are due to different mechanisms, and they can have different energy dependencies. We performed tests on the widths of the two zero-centered Lorentzians to study their dependence on energy. If we assume that the width of the Lorentzian is constant, a test on gives a reduced of 0.67 for 2 degrees of freedom and a Q value of 0.51, while the test on has a reduced of 3.5 for 2 degrees of freedom and a Q value of 0.021. Therefore, at the 95% confidence level, the width of the lower zero-centered Lorentzian has no significant difference between the three energy bands, but this may not be the case for the width of the higher Lorentzian . Further analysis using PDS ratios shows that the general PDS shapes are energy independent for GRS 1758–258 (Lin et al. 1999b ), although this technique is less sensitive to the detailed shape of the PDS.
In addition to studying the averaged power spectra, we also generated the power spectra integrated over all energies and searched for QPOs in each separate observation segment. A broad QPO (or “peaked noise”) at Hz is present in all the segments. It is a very stable feature in the power spectrum. A pair of harmonically-spaced narrow QPOs at 1.4 Hz and 2.8 Hz with a total IFRA of 5% were found in observation segment 7 (Figure 10). They are not positively identified in the other observation segments. Only two cases of these narrow significant X-ray QPOs have previously been observed in black hole candidates in the hard state (Van der Klis (1995)).
5.2 Phase Lags
Another known characteristic of BHCs is that the phase lag between hard photons and soft photons changes very little with frequency (Miyamoto et al. (1992)). This is supported by our observations (Figure 11). Constant phase lags between the energy bands can fit the data well. The fits give a phase lag of radians between the energy bands 2 – 5 keV and 5 – 10 keV ( for 19 degrees of freedom, Q = 0.66) and radians between 2 – 5 keV and 10 – 40 keV ( for 19 degrees of freedom, Q = 0.042). The apparent increase of the phase lags between the 2 – 5 keV and 10 – 40 keV bands may suggest a constant time delay over the frequencies, but the constant time delay model cannot fit the data well, where is the phase lag, is the frequency, and is the time delay. The fit gives for 19 degrees of freedom and Q = .
This flat distribution of phase lags over a wide range of frequencies ( – 10 Hz) was predicted by the extended atmosphere model (Kazanas, Hua, & Titarchuk (1997)) that assumes that the phase lags are generated by Compton scattering. The atmosphere has a density profile of , and the size has to be as large as , where is the Schwarzchild radius. Böttcher & Liang (1999) proposed a spiraling blob model that assumes that the seed photons are from a blob spiraling into the central object. It also predicted a flat phase lag distribution, but it does not need a huge atmosphere to account for the phase lags because they are caused by the motion of the blob from the cool outer disk to the hot inner disk.
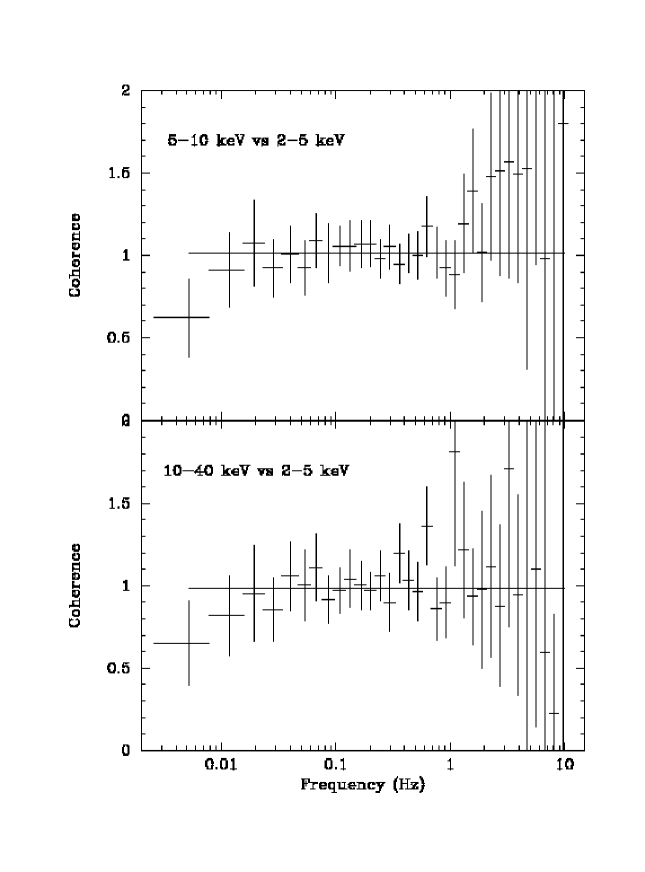
5.3 Coherence & Hardness Ratio
Like the previous measurements of GRS 1758–258 (Smith et al. (1997)) and Cyg X–1 (Vaughan & Nowak (1997); Nowak et al. (1999)), the current observations found a high coherence between the hard and soft photons (Figure 12). The coherence between 2 – 5 keV and 5 – 10 keV is , and between 2 – 5 keV and 10 – 40 keV over the frequency range of 0.01 – 1.0 Hz. As Hua, Kazanas, & Titarchuk (1997) pointed out, the high coherence () between the photon fluxes at different energies can be produced by the extended atmosphere model (Hua & Titarchuk 1995). The spiraling blob model also predicted such a high coherence.
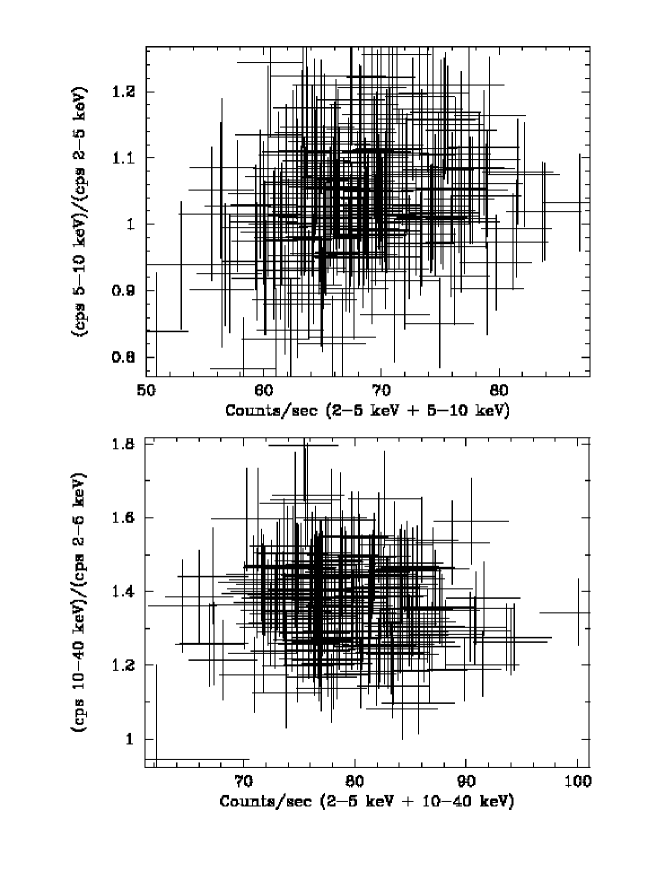
The hardness ratio vs intensity plots for observation segment 7 are shown in Figure 13. Similar results are seen in the other segments. The hardness ratio has little dependence on the photon flux, although the poor statistics prevent us from drawing any significant conclusions. The fact that the hardness ratios show little dependence on the time or brightness indicates that the spectral shape we have found did not change markedly in 1997 August.
6 Summary
Our simultaneous observations of GRS 1758–258 in radio, millimeter, X-ray and gamma-ray add support to the idea that the source is a black hole. It has a very hard spectrum with a photon power law index of 1.40, but there is a cutoff energy around 200 keV. For Compton scattering models, the electron temperature is about 45 keV without considering relativistic effects, and 52 keV with relativistic corrections. At a distance of 8.7 kpc, the hard X-ray ( keV) luminosity is ergs/s, which is higher than the upper limit for a neutron star binary (NSB). The power spectra resemble those of the BHCs, flat at low frequencies and breaking into a power law at higher frequencies. The phase lags between the hard and soft photons have a canonical frequency dependence for BHCs (Miyamoto et al. (1992)). A high coherence of about 1.0 is also found among the different energy bands. The flat distribution of phase lags and the high coherence were predicted by the extended atmosphere model and the spiral blob model. The radio flux was stable during the observations, and had a flat energy spectrum. The millimeter observations did not reveal any conclusive signatures of an interaction between the jet from GRS 1758–258 and the molecular cloud that lies in the direction of GRS 1758–258.
The spectrum can be fit with ST, (HT + BB), and (PLE + BB) models. The hydrogen column density deduced from the ST fitting is cm-2, cm-2 from (HT + BB), and cm-2 from (PLE + BB). It is not surprising that the value of the hydrogen column density is model dependent because we have valid data only down to 2.5 keV. Though the presence of a soft component is also model dependent – the (HT + BB) and (PLE + BB) models need a soft component while the ST model does not – we can certainly conclude that the flux of the soft component is low. The low flux of the soft component implies that the soft photon injection regions are either small or mostly covered by the hot corona. One interesting result from the HT model fitting is that the seed photons and the soft component may have different origins. The soft component is usually believed to originate from the cool optically thick disk (e.g. Liang (1998)). The seed photons may have two origins. One is the cool optically thick disk, and the other is the internal emission processes in the corona such as synchrotron emission (e.g. Esin et al. (1996)). Therefore, the seed photons are very likely from the internal sources.
We find that GRS 1758–258 is more variable in the 5 – 10 keV energy band than in the other two energy bands (2 – 5 keV and 10 – 40 keV). This property is interestingly different from other sources, such as GX 339–4. Systematic studies show that the property is indeed significantly different for the four hard X-ray sources: Cygnus X–1, GX 339–4, GRS 1758–258 and 1E 1740.7–2942 (Lin et al. 1999a, b ). However, further observations of the sources are necessary to correctly understand the energy dependence of the variability when the sources are in different flux and spectral states.
References
- Bally & Levelthal (1991) Bally, J., & Leventhal, M. 1991, Nature, 353, 234
- Barret, McClintock, & Grindlay (1996) Barret, D., McClintock, J. E., & Grindlay, J. E., 1996, ApJ, 473, 963
- Böttcher & Liang (1999) Böttcher, M., & Liang, E. P., 1999, ApJ, 511, L37
- Chen, Gehrels, & Leventhal (1994) Chen, W., Gehrels, N., & Leventhal, M. 1994, ApJ, 426, 586
- Durouchoux et al. (1999) Durouchoux, Ph., et al. 1999, in 32nd COSPAR Scientific Assembly, Nagoya, Japan, in press
- Esin et al. (1996) Esin, A., Narayan, R., Ostriker, E., & Yi, I. 1996, ApJ, 465, 312.
- Gilfanov et al. (1993) Gilfanov, M., et al. 1993, ApJ, 418, 844
- Grebenev, Pavlinsky, & Sunyaev (1997) Grebenev, S. A., Pavlinsky, M. N., & Sunyaev, R. A. 1997, in Proceedings 2nd INTEGRAL Workshop The Transparent Universe, ESA SP-382, 183
- Heindl & Smith (1998) Heindl, W. A., & Smith D. M. 1998, ApJL, 506, L35
- Hjellming & Johnston (1988) Hjellming, R. M., & Johnston, K. J. 1988, ApJ, 328, 600
- Hua & Titarchuk (1995, hereafter HT, or COMPTT in XSPEC) Hua, X.-M.& Titarchuk, L. 1995, ApJ, 449, 188
- Hua, Kazanas, & Titarchuk (1997) Hua, X.-M., Kazanas, D., & Titarchuk, L. 1997, ApJ, 482, L57
- Jahoda et al. (1996) Jahoda, K., Swank, J. H., Giles, A. B., Stark, M. J., Strohmayer, T., Zhang, W., & Morgan, E. H. 1996, SPIE, 2808, 59
- Johnson et al. (1993) Johnson, W. N., et al, 1993, ApJS, 86, 693
- Kazanas, Hua, & Titarchuk (1997) Kazanas, D., Hua, X.-M., & Titarchuk, L. 1997, ApJ, 480, 735
- Krolik & Kallman (1983) Krolik, J. H., & Kallman, T. R. 1983, ApJ, 267, 610
- Kuznetsov et al. (1999) Kuznetsov, S. I., et al. 1999, Astronomy Letters, 25, 351
- Lepp & Dalgarno (1996) Lepp, S., & Dalgarno, A. 1996, A&A, 306, L21
- Liang (1998) Liang, E. P. 1998, Physics Reports, 302, 67-142
- Liang & Narayan (1997) Liang, E. P., & Narayan, R. 1997, in Proceedings of the Fourth Compton Symposium Part one, ed. C. D. Dermer, M. S. Strickman, & J. D. Kurfess (New York: AIP), 461
- (21) Lin, D., Smith, I. A., Liang, E. P., Böttcher, M. 1999a, BAAS, 31, 708
- (22) Lin, D., Smith, I. A., Böttcher, M., Liang, E. P. 1999b, submitted to ApJ
- Martí et al. (1998) Martí, J., Mereghetti, S., Chaty, S., Mirabel, I.F., Goldoni, P., Rodríguez, L.F., 1998, A&A, 338, L95
- Mereghetti, Belloni, & Goldwurm (1994) Mereghetti, S., Belloni, T., & Goldwurm, A. 1994, ApJ, 433, L21
- Mereghetti et al. (1997) Mereghetti, S., Cremonesi, D. I., Haardt, F., Murakami, T., Belloni, T., & Goldwurm, A. 1997, ApJ, 476, 829
- Mirabel et al. (1991) Mirabel, I. F., Morris, M., Wink, J., Paul, J., & Cordier, B. 1991, A&A, 251, L43
- Mirabel & Rodríguez (1994) Mirabel, I. F., & Rodríguez, L. F. 1994, in Proceedings of the Second Compton Symposium, eds. C. E. Fichtel, N. Gehrels, & J. P. Norris (New York: AIP), 413
- Miyamoto et al. (1992) Miyamoto, S., Kitamoto, S., Iga, S., Negoro, H., & Terada, K. 1992, ApJ, 391, L21
- Nowak et al. (1999) Nowak, M. A., Vaughan, B. A., Wilms, J., Dove, J. B., & Begelman, M. C. 1999, ApJ, 510, 874
- Oka et al. (1998) Oka, T., Hasegawa, T., Hayashi, M., Handa, T., & Sakamoto, S. 1998, ApJ, 493, 730
- Phillips & Lazio (1995) Phillips, J. A., & Lazio, T. J. W. 1995, ApJ, 442, L37
- Poutanen (1998) Poutanen, J. 1998, in Theory of Black Hole Accretion Disks (Cambridge: Cambridge U. Press)
- Press et al. (1996) Press, W. H., Teukolsky, S. A., Vetterling, W. T., & Flannery, B. P. 1996, Numerical Recipes in C (Cambridge: Cambridge U. press)
- Purcell et al. (1996) Purcell, W. R., et al. 1996, A&AS, 120, 389
- Rodríguez, Mirabel, & Martí (1992) Rodríguez, L. F., Mirabel, I. F., & Martí, J. 1992, ApJ, 401, L15
- Rothschild et al. (1998) Rothschild, R. E., et al. 1998, ApJ, 496, 538
- Skinner (1991) Skinner, G. K. 1991, Gamma-Ray Line Astrophysics, ed. P. Durouchoux & N. Prantzos (New York: AIP), 358
- Smith et al. (1997) Smith, D. M., Heindl, W. A., Swank, J., Leventhal, M., Mirabel, I. F., & Rodriguez, L. F. 1997, ApJ, 489, L51
- Smith, Heindl, & Swank (1999) Smith, D. M., Heindl, W. A., & Swank, J. H. 1999, IAUC 7266
- Smith & Liang (1999) Smith, I. A., and Liang, E. P., 1999, ApJ, 519, 771
- Smith et al. (1999) Smith, I. A., et al., 1999, ApJ, 519, 762
- Strickman et al. (1996) Strickman, M., Skibo, J., Purcell, W., Barret, D., & Motch, C. 1996, A&AS, 120, 217
- Sunyaev & Titarchuk (1980) Sunyaev, R. A., & Titarchuk, L. G. 1980, A&A, 86, 121
- Sunyaev et al. (1991) Sunyaev, R., et al. 1991, A&A, 247, L29
- Tanaka & Lewin (1995) Tanaka, Y., & Lewin, W. H. G. 1995, in X-Ray Binaries, ed. W. H. G. Lewin, J. van Paradijs, & E. P. J. van den Heuvel (Cambridge: Cambridge Univ. Press), 126
- Titarchuk (1994) Titarchuk, L. 1994, ApJ, 434, 313
- Van der Klis (1995) Van der Klis, M., 1995, in X-Ray Binaries, ed. W. H. G. Lewin, J. Van Paradijs, and E. P. J. Van den Heuvel(Cambridge: Cambridge U. press), 252
- Vaughan & Nowak (1997) Vaughan, B. A., & Nowak, M. A. 1997, ApJ, L43
- Yan & Dalgarno (1997) Yan, M., & Dalgarno, A. 1997, ApJ, 481, 296


| UT Date 1997 | 4860 MHz flux | 8460 MHz flux |
|---|---|---|
| August (central) | density (mJy) | density (mJy) |
| 03.313 | ||
| 05.308 | ||
| 08.176 | ||
| 11.211 | ||
| 14.182 | ||
| 15.187 | ||
| 18.149 | ||
| 20.123 | ||
| 24.174 |
| Location | Transition | Velocity | Antenna temp | Flux density | Line width | Peak area |
|---|---|---|---|---|---|---|
| () | (K) | (mJy) | () | () | ||
| Core | ||||||
| North jet | ||||||
| South jet |
| Segment # | Start time | Stop time | TJD |
|---|---|---|---|
| UT Date August 1997 | UT Date August 1997 | ||
| 1 | 13.501 | 13.540 | 10673 |
| 2 | 13.568 | 13.606 | 10673 |
| 3 | 13.635 | 13.673 | 10673 |
| 4 | 13.701 | 13.740 | 10673 |
| 5 | 13.768 | 13.776 | 10673 |
| 6 | 13.788 | 13.807 | 10673 |
| 7 | 14.502 | 14.540 | 10674 |
| 8 | 14.568 | 14.607 | 10674 |
| 9 | 14.635 | 14.673 | 10674 |
| 10 | 14.702 | 14.729 | 10674 |
| 11 | 18.103 | 18.121 | 10678 |
| 12 | 18.170 | 18.184 | 10678 |
| 13 | 20.103 | 20.123 | 10680 |
| 14 | 24.172 | 24.192 | 10684 |
| Data set | Constant aaThe constants have the same units as in Figure 1. | DOF | Q bbQ is the null hypothesis probability. | |
|---|---|---|---|---|
| VLA 4860 MHz | 0.123 | 2.28 | 8 | 0.02 |
| VLA 8460 MHz | 0.139 | 1.57 | 8 | 0.13 |
| RXTE ASM | 1.93 | 1.59 | 16 | 0.062 |
| PCA | 118.4 | 34.8 | 4 | 4.2 |
| HEXTE | 5.88 | 1.156 | 4 | 0.33 |
| OSSE | 35.6 | 0.66 | 14 | 0.83 |
| Minimum | Maximum | Average | |
|---|---|---|---|
| cm-2) aa is the hydrogen column density. | |||
| (keV) bb is the electron temperature. | |||
| cc is the Thomson depth. | |||
| dd is the normalization factor of the ST model defined in XSPEC | |||
| (DOF) | 0.91 (620) | 0.90 (620) | |
| Q | 0.94 | 0.95 |
| Minimum | Maximum | Average | |
|---|---|---|---|
| cm-2) | |||
| (keV) | |||
| aa is the normalization factor of the HT model defined in XSPEC. | |||
| (keV)bb is the black-body temperature. | |||
| cc is the flux from the black body. is the luminosity in the unit of ergs/s, and is the distance in the unit of 10 kpc. | |||
| (DOF) | 0.89 (618) | 0.89 (620) | |
| Q | 0.98 | 0.98 |
| Minimum | Maximum | Average | |
|---|---|---|---|
| cm-2) | |||
| aaPLE model defined in Equation (2). | |||
| (keV) aaPLE model defined in Equation (2). | |||
| aaPLE model defined in Equation (2). | |||
| (keV)bbSee Table 6 for explanation. | |||
| bbSee Table 6 for explanation. | |||
| (DOF) | 0.91 (618) | 0.92 (618) | |
| Q | 0.95 | 0.92 |
| 2 – 5 keV | 5 – 10 keV | 10 – 40 keV | |
|---|---|---|---|
| aaThe model components 1 & 2 are the zero-center Lorentzians, i.e. and . | |||
| aaThe model components 1 & 2 are the zero-center Lorentzians, i.e. and . | |||
| aaThe model components 1 & 2 are the zero-center Lorentzians, i.e. and . | |||
| aaThe model components 1 & 2 are the zero-center Lorentzians, i.e. and . | |||
| bbThe model components 3 & 4 are harmonic QPO Lorentzians, i.e. | *** cc*** represents that we are not able to confine the parameter. | ||
| bbThe model components 3 & 4 are harmonic QPO Lorentzians, i.e. | *** cc*** represents that we are not able to confine the parameter. | ||
| bbThe model components 3 & 4 are harmonic QPO Lorentzians, i.e. | |||
| bbThe model components 3 & 4 are harmonic QPO Lorentzians, i.e. | |||
| bbThe model components 3 & 4 are harmonic QPO Lorentzians, i.e. | |||
| (DOF) | 1.43 (64) | 1.31 (64) | 0.95 (64) |
| Q | 0.013 | 0.049 | 0.59 |