Zw 1718.1–0108: a highly disturbed galaxy cluster at low Galactic latitude
Abstract
We report the discovery of highly distorted X-ray emission associated with the nearby cluster Zw 1718.1–0108, one of whose dominant members is the powerful radio galaxy 3C353. This cluster has been missed by previous X-ray cluster surveys because of its low Galactic latitude (), despite its brightness in the hard X-ray band (2–10 keV flux of erg cm-2 s-1). Our optical CCD image of the central part of the cluster reveals many member galaxies which are dimmed substantially by heavy Galactic extinction. We have measured redshifts of three bright galaxies near the X-ray emission peak and they are all found to be around . The ASCA GIS and ROSAT HRI images show three aligned X-ray clumps embedded in low surface-brightness X-ray emission extended by arcmin. The averaged temperature measured with ASCA is keV, which appears to be hot for the bolometric luminosity erg s-1, when compared to the temperature-luminosity correlation of galaxy clusters. The irregular X-ray morphology and evidence for a non-uniform temperature distribution suggest that the system is undergoing a merger of substructures. Since the sizes and luminosities of the individual clumps are consistent with those of galaxy groups, Zw 1718.1–0108 is interpreted as an on-going merger of galaxy groups in a dark matter halo forming a cluster of galaxies and thus is in a transition phase of cluster formation.
keywords:
galaxies: clusters: individual: Zw 1718.1–0108 – galaxies: individual: 3C353 – X-rays: galaxies1 Introduction
Various surveys of clusters of galaxies have been carried out using X-ray techniques, since they provide an effective, unbiased search for hot intracluster medium (ICM) bound in a cluster potential. The largest X-ray samples of clusters to date have been compiled from the ROSAT All Sky Survey (RASS) data (e.g., The Brightest Cluster Sample or BCS, Ebeling et al 1998). However, those surveys are usually limited to the high Galactic latitude sky () to avoid confusion from Galactic extended sources and high Galactic extinction. A number of clusters of galaxies located at low Galactic latitude have therefore been missed.
We have detected a bright, extended X-ray source which is probably one of those missing X-ray clusters at low Galactic latitude. The X-ray image obtained with ASCA shows extended X-ray emission with highly disturbed morphology ( arcmin along the major axis) and total flux of erg cm-2 s-1. The X-ray source has been detected by earlier X-ray survey missions such as Uhuru (4U1716–01, Forman et al 1978) and HEAO A1 (1H1718–010, Wood et al 1984). Since the X-ray detectors of those satellites had a limited imaging capability with a collimated field of view, the extended X-ray emission was not noticed and the radio galaxy 3C353 has been suggested as a possible optical counterpart. Although the cluster is listed in the Zwicky catalogue (Zw 1718.1–0108) and the X-ray source was detected in the RASS (1RXS J172048.0–010914), it was not selected for the BCS because of the Galactic latitude , just outside the survey region.
Zw 1718.1–0108 was described as “a near, medium compact cluster” by Zwicky et al (1960). There are, however, few bright galaxies seen in the optical image as a result of the large Galactic extinction at the low Galactic latitude. We carried out an ASCA observation aiming to study 3C353 and detected hard X-ray emission from the radio galaxy as well as the cluster emission. We present the highly disturbed X-ray morphology of the cluster obtained from ASCA and the ROSAT HRI and the X-ray spectral properties as evidence for a cluster merger and then discuss a possible interpretation on the cluster evolution. The presence of an obscured active nucleus in 3C353 is also revealed through the X-ray spectrum obtained with ASCA. No redshift measurements have been available for the member galaxies apart from 3C353 (). In this paper, we present a new optical CCD image of the central region of the cluster and the first redshift measurements for the member galaxies.
2 Observations and data reduction
Zw 1718.1–0108 and 3C353 were observed with ASCA and the ROSAT HRI. A summary of the ASCA and ROSAT observations are given in Table 1. In addition to a point-like X-ray source at the position of the radio galaxy, a bright, extended X-ray source is detected at the South-East of 3C353 with the ASCA Gas Imaging Spectrometer (GIS; G2 and G3). A likely source of the extended X-ray emission is the Zwicky cluster 1718.1–0108 of which 3C353 is a member. Since the primary target of the observations was 3C353, the Solid state Imaging Spectrometer (SIS; S0 and S1) of ASCA was operating using the standard 1 CCD chip with a arcmin field of view which covers the radio galaxy and only a small fraction (north part) of the cluster emission of Zw 1718.1–0108.
For the ASCA data, standard calibration (used for the Revision 2 processing) and data reduction techniques were employed, using FTOOLS (version 4.1) provided by the ASCA Guest Observer Facility at Goddard Space Flight Center. The GIS data were mainly used to investigate the extended X-ray emission from the cluster. The SIS data are used for investigating 3C353, since it provides a better spatial resolution than the GIS, which helps to separate 3C353 from the diffuse cluster emission.
| Satellite | Detector | Operation mode | Band | Date | Exposure | Count rate |
|---|---|---|---|---|---|---|
| ks | ct s-1 | |||||
| ASCA | SIS (S0/S1) | 1CCD/Faint | 0.5–10 keV | 1996 Sep 14–15 | 40.8 | —/— |
| GIS (G2/G3) | PH | 0.7–10 keV | 40.1 | 0.25/0.22 | ||
| ROSAT | HRI | 0.1–2.4 keV | 1997 Aug 27–29 | 17.2 | 0.23 |
The ROSAT High Resolution Imager (Pfeffermann et al 1987) gave a 0.1–2.4 keV image at the spatial resolution of about 5 arcsec. With 17.2 ks of net exposure, a total of 5271 counts were detected. The raw HRI image has been smoothed with the adaptive kernel method, ASMOOTH (Ebeling, White & Rangarajan 1999), using a gaussian kernel and a characteristic smoothing threshold, above the local background, of . Three X-ray clumps were detected. However, we note that the short HRI exposure is not appropriate to study the diffuse, low surface brightness X-ray emission of the cluster.
3 Zw 1718.1–0108
3.1 X-ray images
FIGURE 1.
FIGURE 2a and 2b.

| Components | P.A. | Component | P.A. | |
|---|---|---|---|---|
| NWp–N | 138∘ | NWp | 140∘ | |
| Wp–C | 99∘ | Wp | 95∘ | |
| C–N | 3∘ | N | 173∘ | |
| S–C | 16∘ | C+S | 16∘ |
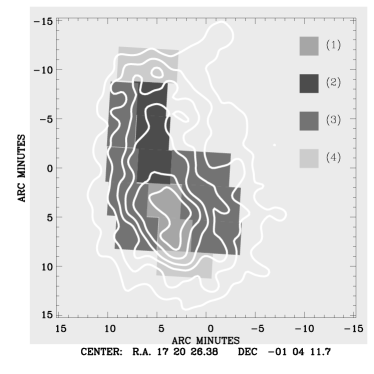
The full-band GIS image superposed by the ROSAT HRI contours is shown in Fig. 1. The angular scale is Mpc arcmin-1 at the redshift of 0.03 (H0 = 50 km s-1 Mpc-1). The X-ray source is extended roughly in the North-South direction; 3C353 is also detected at the NW edge of the cluster emission. Asymmetric, slightly twisted X-ray morphology is evident in the GIS image. Three X-ray peaks (N, C, and S from north to south) are resolved in the HRI image. Faint plumes extending to the NorthWest (NWp) and West (Wp) are seen in the GIS image. The NW plume is also seen at a faint level in the HRI image. The orientation of these X-ray components are given in Table 2.
The two GIS images in the 0.7–2 keV and 5.5–10 keV bands are shown in Fig. 2. 3C353 is the brightest source in the hard-band image but faint in the soft-band image, indicating a very hard spectrum probably due to heavy obscuration in the active nucleus (see Section 4.2). We note that the hard energy band is similar to that (5–10 keV) used in the hard X-ray serendipitous source survey with BeppoSAX (Fiore et al 1999). 3C353 is therefore a typical source which would be selected only by such a hard X-ray survey. A similar hard X-ray source in a cluster is the Seyfert 2 galaxy NGC4388 in Virgo cluster (e.g., Iwasawa et al 1997).
The projected X-ray profile along the South-North direction, obtained from the 0.7–2 keV GIS image, is shown in Fig. 3. The X-ray profile is fairly flat with three peaks. There is no evidence for the sharply peaked X-ray emission seen in cooling flow clusters.
The pointing accuracy of the GIS image has been checked using 3C353 as a reference which is clearly detected as a point-like source in the hard band image. The displacement between the optical and GIS positions of 3C353 is only arcsec, well within the mean pointing uncertainty of 20 arcsec (Gotthelf & Ishibashi 1997). A possible soft X-ray counterpart of 3C353 is barely detected in the HRI image, which we have used for the astromety of the HRI image.
3.2 Optical image and redshifts of the member galaxies
FIGURE 4.
| Imaginga | |
|---|---|
| Date | 1999 June 16 |
| Telescope | UH 2.2-m |
| Filters | R, B (Kron-Cousins system) |
| Instrument | CCD: Tektronix |
| Pixel size | 0.22′′ at f/10 |
| Field of view | 7.5′ 7.5′ |
| Seeing | 0.7′′ |
| Exposure timeb | s |
| Spectroscopyc | |
| Date | 1998 October 9 (g2) |
| 1999 July 2 (g1 and g3) | |
| Telescope | UH 2.2-m |
| Instrument | Wide Field Grism Spectrograph |
| (low dispersion) | |
| Spectral range | 4000–9000Å |
| Resolution | Å pixel-1 |
| Exposure time | s (g2) |
| s (g1 and g3) | |
Follow-up optical imaging and spectroscopy of this cluster region were carried out with the University of Hawaii 2.2-m telescope. The details of the observations are given in Table 3.
Fig. 4 shows the mosaic of optical R band CCD image of arcmin2 field centred on the X-ray emission peak. The contours show the X-ray brightness obtained from the GIS image. The redshifts of three bright galaxies, g1, g2 and g3, labeled in Fig. 4 were measured. The optical spectra of the three galaxies are dominated by stellar light and their redshifts are determined with absorption lines of NaD, MgIb (and also Balmer absorption lines in g3). The results of the redshift measurements are shown in Table 4. They are all consistent with . The redshift of 3C353, which is located near the North X-ray clump, is , about 540 km s-1 different in velocity from the brightest galaxies near the X-ray peak. From the observed X-ray luminosity and/or gas temperature (see Section 3.3), we estimate a velocity dispersion of galaxies of km s-1(cf. Fig. 1 in White, Jones & Forman 1997). It is therefore plausible that 3C353 and the three galaxies lie in the same system. The extended X-ray emission detected is not a result of projection of X-ray sources at different redshifts but physically related X-ray emission as a whole.
The three galaxies of which we have measured redshifts are all very red, probably due to large Galactic extinction. The column density deduced from the HI map by Dickey & Lockman (1990) is cm-2. Assuming the standard gas-to-dust ratio in the Galaxy, it corresponds to . An inspection of the DIRBE and IRAS 100m maps of this region suggests the visual extinction to be even larger ( mag, J. Mulchaey, priv. comm.). Perhaps this is a dusty direction in our Galaxy. The appearance of the cluster in Fig. 4 is of a relatively poor cluster with a core dominated by two equally luminous ellipticals (g2 and g3). The number of fainter galaxies in this field is entirely consistent with the number found in same size fields of other low luminosity ROSAT-selected clusters (Edge et al., in prep.) with 8–12 galaxies in the range 2 magnitudes fainter than the third brightest galaxy. Therefore this cluster is unremarkable in the optical.
| Galaxy | R.A.J2000 | Dec.J2000 | z | Ref |
|---|---|---|---|---|
| 3C353 | 17h20m28.1s | –00∘58′46′′ | 1 | |
| g1 | –01∘08′58′′ | 2 | ||
| g2 | –01∘11′57′′ | 2 | ||
| g3 | –01∘06′55′′ | 2 |
3.3 X-ray spectrum
The spectral analysis was performed using XSPEC (version 10.0). The MEKAL model (the original MEKA code, described by Kaastra 1992, with modified Fe-L line emissivity by Liedahl et al 1995) for the optically thin, collisional ionization equilibrium plasma is used to fit the observed cluster emission with solar abundances taken from Anders & Grevesse (1989). The response matrices of the GIS detectors are of Version 4.0. Since systematic errors in the low energy response of the GIS are suspected, we discarded the data below 0.9 keV for the present spectral analysis.
Galactic absorption of cm-2, taken from the HI survey by Dickey & Lockman (1990), is assumed for all the fits presented below unless stated otherwise, as no evidence for excess absorption has been found (cm-2, the 90 per cent upper limit).
The GIS spectrum of the total cluster emission was extracted, excluding the region of 3C353, which has a very hard spectrum. Fitting the two GIS detectors jointly gives a temperature of keV and metallicity of . It should be noted that the radio galaxy 3C353 would affect the temperature measurement if it is not excluded from the photon-collection region for the spectrum (a temperature of keV would be obtained due to the hard X-ray spectrum of the radio galaxy). Even though it is unlikely that there is excess absorption above the value derived from the HI observation, when the 90 per cent upper limit value of (cm-2) is used, the temperature drops to keV. This trade-off between temperature and absorption has little effect on the estimate of the bolometric luminosity given below.
The estimated observed fluxes for the whole cluster emission are erg cm-2 s-1 in the 0.5–2 keV band and erg cm-2 s-1 in the 2–10 keV band. The bolometric luminosity corrected for the Galactic absorption is erg s-1, using H0 = 50 km s-1 Mpc-1 and q0 = 0.5 (the 2–10 keV luminosity is erg s-1).
3.4 Spatial variations in temperature and metallicity

The ASCA GIS data were investigated to search for spatial variations in temperature and metallicity. A spatially resolved spectral study with the GIS data is severely limited by the broad PSF resulting from a combination of the XRT PSF which has a broad wing with half power diameter (HPD) of 3 arcmin (FWHM arcsec, see Serlemitsos et al 1995) and the GIS response of FWHM1 arcmin at 2 keV. Therefore the results presented here indicate only the qualitative trend.
The GIS image was divided into four regions as indicated in Fig. 5, from which temperature and metallicity are derived by fitting the 0.9–10 keV GIS spectra (Fig. 6). The region near 3C353 was excluded from this study to avoid contamination by the hard X-ray source in the radio galaxy. The spectral fits were performed using the same model as used for the total spectrum. Results are shown in Table 5.
There is marginal evidence for a cooler temperature in the south, the bright part (region-1), and both North and South ends of the cluster emission. A more detailed study provides a hint of a high temperature ( keV) in the middle part of region-2 [(2-m) in Table 5] which corresponds to the intermediate region between the two X-ray clumps, N and C.
There is also some evidence for metallicity variation. We note that the iron abundance is a primary driver of the metallicity measurement here, since the iron K line is the strongest line emission at the given temperature ( keV). The North core (region-2) and the North and South ends of the cluster emission (region-4) are marginally high in metallicity (0.5–0.6 ) while the south core (region-1) and the outer part (region-3) show low metallicity ().
The faint NW plume (NWp), which is not indicated in Fig. 5, shows a sign of a much higher temperature [ at 90 per cent confidence level) keV] or a hard spectrum. This result is treated with caution, since the plume is considerably faint ( ct s-1) hence the spectral shape is sensitive to background subtraction. No AGN-like objects can be found in NED, although it is not surprising for a poorly surveyed region at low Galactic latitude. The elongation of the X-ray image is not consistent with the distortion of a point-like image at a large off-axis angle. There are instead a few galaxies in the DSS image, suggesting another possible galaxy cluster.
| Region | Count rate | /dof | ||
|---|---|---|---|---|
| ct s-1 | keV | |||
| Total | 22 | 562.4/573 | ||
| (1) | 4.0 | 208.4/211 | ||
| (2) | 3.9 | 272.1/243 | ||
| (3) | 9.9 | 487.2/479 | ||
| (4) | 1.9 | 128.8/145 | ||
| (2-m)∗ | 1.4 | 98.9/96 |
4 3C353
4.1 Powerful radio galaxy in a cluster
3C353 is a powerful (log W Hz-1) FRII source with a classical double-lobe. The radio source resides in a giant elliptical galaxy. 3C353 is located at the edge of the cluster X-ray emission (Fig. 1 and Fig. 2). The optical spectrum of nonstellar light is characterized by weak, low-ionization emission lines (Baum et al 1988; Tadhunter et al 1993).
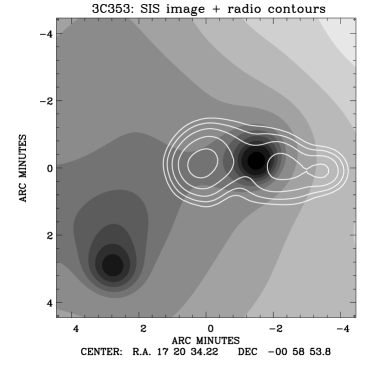
Fig. 7 shows the radio image of 3C353 taken in the NRAO/VLA Sky Survey (NVSS, Condon et al 1998) in contour superposed on the SIS full band image. The radio image was taken by the VLA at 20 cm at resolution of 45 arcsec. In this low resolution image, the radio source appears to be triple while much higher resolution images such that in Morganti, Killeen & Tadhunter (1993) and Swain, Bridle & Baum (1998) reveal more details in the radio structure as well as the weak radio core at the nucleus. A point-like X-ray source coincides with the nucleus of the radio galaxy which is located at the centre between the radio lobes. The brighter jet going towards the cluster emission terminates at a hot spot and the surface brightness of the jet-side lobe steeply declines in front of the bright cluster emission. The cluster medium may be acting as a working surface of the radio jet, or it is merely an orientation effect of the jet.
4.2 ASCA spectrum

As suggested from the image analysis, the X-ray spectrum of 3C353 is very hard. A likely explanation is an absorbed X-ray source of an active nucleus in the radio galaxy. To minimize the contamination from the cluster emission, we use the SIS data for a spectral study as the SIS provides better spatial resolution, and the data were collected from a small region with a radius of 1.5 arcmin on the two SIS detectors centred on the hard X-ray source. Half of the total photons from 3C353 should be contained in the region, when the point spread function of the ASCA XRT for a point source is assumed. The background data were taken from a region where the cluster emission is weak. The obtained spectrum should therefore contain some cluster emission in the soft X-ray band.
The SIS spectrum can be fitted with a very flat power-law of (Fig. 8). However, a realistic picture of the spectrum is a sum of the cluster emission and an absorbed power-law from an AGN. Since soft X-ray emission from the radio galaxy is very weak, as illustrated by the HRI image and the soft band GIS image, the energy band below 2 keV in the spectrum is dominated by the diffuse cluster emission. Fitting with a model consisting of a thermal emission spectrum (MEKAL) with keV and metallicity of 0.23 and an absorbed power-law with a photon-index of 1.7 gives an absorption column density cm-2. The contribution from the cluster emission (as modelled by the MEKAL component) is found to be about 60 per cent in the 0.5–2 keV energy range. The absorption-corrected 2–10 keV luminosity of the X-ray source is erg s-1.
An ASCA spectral study of a sample of radio galaxies including 3C353 will be reported elsewhere (see also Sambruna, Eracleous & Mushotzky 1999). Compared with the other ‘emission-line selected’ radio galaxies, 3C353 appears to be underluminous in X-rays for its radio power.
5 discussion

We have shown that the extended emission around the powerful radio galaxy 3C353 is a cluster with highly disturbed morphology of the X-ray emission which might affect the radio jets of 3C353. The large radio power of 3C353 could be the result of the dense environment, as speculated for Cyg A (Barthel & Arnaud 1996).
This cluster, Zw 1718.1–0108, has a high temperature (the averaged-temperature is keV) for its low bolometric luminosity, erg s-1 which is comparable to that of galaxy groups rather than clusters.
To demonstrate this, we have compiled ASCA measurements of temperatures and bolometric luminosities of galaxy clusters and groups from the recent literature that takes into account contamination from cooling flows (Fig. 9, Allen & Fabian 1998, Markevitch 1998, Fukazawa et al. 1998 and Y. Fukazawa, priv. comm.).
Zw 1718.1–0108 lies marginally within the scatter of the correlation which is large in the relevant luminosity range, relative to the scatter in the higher luminosity range. However, Zw 1718.1–0108 is certainly one of the lowest luminosity clusters at the given temperature 4–5 keV.
Three X-ray clumps are resolved in the X-ray images, each of which has a sub-Mpc size and luminosity similar to galaxy groups. Zw 1718.1–0108 therefore appears to be a system of clustered groups, which will collapse together to form a larger scale cluster of galaxies as expected from the bottom-up structure formation predicted by standard scenario of hierarchical clustering (e.g. Tormen 1998). The hot ICM of the system can be explained as a result of heating by interaction between the small clumps. The disturbed X-ray morphology and the unusually high temperature suggest that the system may not be virialized, unlike ordinary relaxed clusters. The non-uniform pattern of the temperature distribution, particularly the high temperature region between the N and C clumps, indicates the heating of the ICM by shock induced by interaction between the clumps. The low surface brightness nature of this cluster suggests that merging should also play a significant role to reduce bolometric luminosity by destroying a cooling flow at the central region of the cluster.
A dramatic cluster-cluster merger is seen in Abell 754 () for which a detailed numerical simulation can reproduce the effects of the interaction between two clumps with masses differing by a factor of about 2 (Henriksen & Markevitch 1996; Roettiger, Stone & Mushotzky 1998). Zw 1718.1–0108 is also an on-going merger but of smaller-scale structures (galaxy-group size) in the plane-of-the-sky. This system may be an example of transition phase of cluster evolution from galaxy groups to a galaxy cluster. In particular, Doe et al. (1995) pointed out the role played by the Zwicky clusters as “incubators” of compact, evolving groups: in their sample of 5 poor clusters with physical characteristics similar to Zw 1718.1–0108, four of these are embedded within larger Zwicky clusters.

Another interesting possibility is that this X-ray structure is part of a dark matter filament, since the resolved three X-ray clumps are linearly connected. The power spectrum of galaxy clustering shows major overdense regions to occur on a scale of 200 Mpc (e.g. Lin et al. 1996), which is at the redshift of 0.03. There are a few clusters and superclusters in the redshift range of 0.03–0.05 which could be alined with Zw 1718.1–0108. Fig. 10 shows the GIS image and directions to the Hercules supercluster (), Abell 2147 (), Abell 3571 (), the Shapley supercluster () and the Ophiuchus cluster (). The Ophiuchus cluster is probably the nearest one located 22∘ ( Mpc) away to the south at the same redshift. Although it is not clear whether they are linked to Zw 1718.1–0108, the two nearest clusters, the Ophiuchus cluster and Abell 2147, are moderately aligned with the elongation of Zw 1718.1–0108, which provides circumstantial evidence that a filament of large-scale structure may exist.
There are several indications in favour of a low density universe (, e.g., Eke et al 1998; Efstathiou et al 1999; Ettori & Fabian 1999). Most nearby clusters in such a low density universe are expected to be dynamically relaxed and smooth in appearance (e.g., Richstone, Loeb & Turner 1992; Buote 1998; but cf. Roettiger et al. 1998 on the role of long relaxation times for merger remnants). There are many nearby clusters, e.g., Abell 1367, Abell 2197, Abell 3627, the Virgo cluster, and the Hercules cluster, that have a complex morphology with substructures which are, however, small in size relative to the spherical main body. Zw 1718.1–0108 appears to show more disturbed morphology than that in those nearby clusters, and may be a rare example in the nearby universe.
Finally, it is worth pointing out that X-ray observations are an efficient way of finding clusters of galaxies at low Galactic latitude. Zw 1718.1–0108 is a prime example of such a cluster. A search for clusters at has been conducted using the RASS data, and has found a number of other X-ray clusters (Ebeling, Mullis & Tully 1999).
Acknowledgements
We thank all the member of the ASCA team for the operation of the satellite and maintenance of the software, John Mulchaey for information on his unpublished CCD optical image and useful comments, and Yasushi Fukazawa for providing the ASCA results on the cluster sample in his thesis. This research has made use of data obtained through the High Energy Astrophysics Science Archive Research Center Online Service, provided by the NASA’s Goddard Space Flight Center. The NASA/IPAC Extragalactic Database (NED) is operated by the Jet Propulsion Laboratory, California Institute of Technology, under contract with the National Aeronautics and Space Administration. Royal Society (ACE,ACF,SE) and PPARC (KI) are thanked for support.
References
- [1] Allen S.W., Fabian A.C., 1998, MNRAS, 297, L57
- [2] Anders E., Grevesse N., 1989, Geochimica et Cosmochimica Acta, 53, 197
- [3] Barthel P.D., Arnaud, K.A., 1996, MNRAS, 283, L45
- [4] Baum S.A., Heckman T.M., Van Breugel W., 1992, ApJ, 389, 208
- [5] Buote D.A., 1998, MNRAS, 293, 381
- [6] Condon J.J., Cotton W.D., Greisen E.W., Yin Q.F., Perley R.A., Taylor G.B., Broderick J.J., 1998, AJ, 115, 1693
- [7] De Vaucouleurs G., De Vaucouleurs A., Corwin Jr H.G., Buta R.J., Paturel G., Fouque P., 1991, Third Reference Catalogue of Bright Galaxies, version 3.9
- [8] David L.P., Slyz A., Jones C., Forman W., Vrtilek S.D., Arnaud K.A., 1993, 412, 479
- [9] Dickey J.M., Lockman F.J., 1990, ARAA, 28, 215
- [10] Doe S.M., Ledlow M.J., Burns J.O., White R.A., 1995, AJ, 110, 46
- [11] Ebeling H., Mullis C.R., Tully R.B., 1999, ApJ, submitted
- [12] Ebeling H., White D.A., Rangarajan F.V.N., 1999, MNRAS, submitted
- [13] Ebeling H., Edge A.C., Bohringer H., Allen S.W., Crawford C.S., Fabian A.C., Voges W., Huchra J.P., 1998, MNRAS, 301, 881
- [14] Edge A.C. Stewart G.C., 1991, MNRAS, 252, 414
- [15] Efstathiu G., Bridle S.L., Lasenby A.N., Hobson M.P., Ellis E.S., 19999, MNRAS, 303, 47
- [16] Eke V.R., Cole S., Frenk C.S., Henry J.P., 1998, MNRAS, 298, 1145
- [17] Ettori S., Fabian A.C., 1999, MNRAS, 305, 834
- [18] Forman W. Jones C., Cominsky L., Julien P., Murray S., Peters G., Tananbaum H., Giacconi R., ApJS, 38, 357, (4U catalog)
- [19] Fukazawa Y., Makishima K., Tamura T., Ezawa H., Xu H., Ikebe Y., Kikuchi K., Ohashi T., 1998, PASJ, 50, 187
- [20] Gotthelf E.V., Ishibashi K., 1997, X-Ray Imaging and Spectroscopy of Cosmic Hot Plasmas, eds F. Makino and K. Mitsuda, UAP, Tokyo, p.631
- [21] Henriksen M.J., Markevitch M.L., 1996, ApJ, 466, L79
- [22] Iwasawa K., Fabian A.C., Ueno S., Awaki H., Fukazawa Y., Matsushita K., Makishima K., 1997, MNRAS, 285, 683
- [23] Kaastra J., 1992, An X-Ray Spectral Code for Optically Thin Plasmas (Internal SRON-Leiden Report, updated version 2.0)
- [24] Liedahl, D.A., Osterheld, A.L. & Goldstein, W.H., 1995, ApJ, 438, L115
- [25] Lin H., Kirshner R.P., Shectman S.A., Landy S.D., Oemler A., Tucker D.L., Schechter P.L., 1996, ApJ, 471, 617
- [26] Markevitch M., 1998, ApJ, 504, 27
- [27] Morganti R., Killeen N.E.B., Tadhunter C.N., 1993, MNRAS, 263, 1023
- [28] Mulchaey J.S., Zabludoff A.I., 1998, ApJ, 496, 73
- [29] Mushotzky R.F., Sharf C.A., 1997, ApJ, 482, L13
- [30] Piccinotti G., Mushotzky R.F., Boldt E.A., Holt S.S., Marshall F.E., Serlemitsos P.J., Shafer R.A., 1982, ApJ, 253, 485
- [31] Ponman T.J., Cannon D.B., Navarro J.F., 1999, Nat, 397, 135
- [32] Ponman T.J., Bourner P.D.J., Ebeling H., Bohringer H., 1996, MNRAS, 283, 690
- [33] Richstone D., Leob A., Turner E.L., 1992, ApJ, 393, 477
- [34] Roettiger K., Stone J.M., Mushotzky R.F., 1998, ApJ, 493, 62
- [35] Sambruna R.M., Eracleous M., Mushotzky R.F., 1999, ApJ, in press (astro-ph/9905365)
- [36] Serlemitsos P.J., et al, 1995, PASJ, 47, 105
- [37] Swain M.R., Bridle A.H., Baum S.A., 1998, ApJ, 507, L29
- [38] Tadhunter C.N., Morganti R., Di Serego-Alighieri S., Fosbury R.A.E., Danziger I.J., 1993, MNRAS, 263, 999
- [39] Tanaka Y., Inoue H., Holt S.S., 1994, PASJ, 46, L37
- [40] Tormen G., 1998, MNRAS, 297, 648
- [41] White D.A., Jones C., Forman W., 1997, MNRAS, 292, 419
- [42] Wood K.S., et al 1984, ApJS, 56, 507
- [43] Zwicky F., Herzog E., Wild, P., 1960, Catalogue of galaxies and clusters of galaxies, California Institute of Technology, Pasadena, vol.1