Constraints on the Structure of Dark Matter Halos from the Rotation Curves of Low Surface Brightness Galaxies
Abstract
We re-examine the disk-halo decompositions of the rotation curves of low surface brightness (LSB) galaxies with , taking full account of the effects of beam smearing. We show that the rotation curves of these LSB galaxies are, contrary to previous claims, consistent with dark halos with steep central cusps in their density distribution. In fact, the spatial resolution of the data is not sufficient to put any meaningful constraints on the density profiles of their dark halos, or on cosmological parameters. This has important implications for numerous claims made in the literature regarding the halos of LSB galaxies, such as the self-similarity of their rotation curves, and their inconsistency with certain cosmological models or with cold dark matter altogether. Only in one case is the data of sufficient spatial resolution to obtain reliable constraints on the slope of the central density distribution of the dark matter halo. For this single case, we find a central cusp with at the 99.73 percent confidence levels. This contrasts strongly with the results for two dwarf galaxies () that we analyze, which yield at the same level of confidence. This possibly suggests that halos with constant density cores are restricted to low-mass systems. We show that violent outflows of baryonic matter by supernovae feedback can reproduce this mass-dependence of halo cusp slopes.
1 Introduction
Cosmological models make specific predictions for the structure of dark matter halos. A generic prediction of the cold dark matter (CDM) model is that dark matter halos should be very dense, with steep central cusps. Simulations by Navarro, Frenk & White (1996, 1997) found a nearly universal density profile (hereafter the NFW-profile), which rises as to the center. Higher resolution simulations suggest that the central profiles should be even steeper, rising as (Fukushige & Makino 1997, Moore et al. 1998; Ghigna et al. 1999), although other comparable simulations have found much shallower density cusps (; Kravtsov et al. 1998, Bullock et al. 1999).
Observationally, one may hope to test these predictions by measuring the dynamics of disk galaxies. For disks with a central surface brightness close to the Freeman (1970) value, however, the actual insight gained into the structure of dark halos is severely limited by the disk’s contribution to the circular velocity. The unknown mass-to-light ratio of the stellar component results in ambiguity regarding the actual density distribution of the dark matter. Although some limits can be obtained (i.e., the maximum disk), the lack of any obvious transition region from a disk-dominated to a halo-dominated part in the rotation curves (the “disk-halo conspiracy”) severely impedes the ability to obtain a unique decomposition. Many different combinations of mass-to-light ratio and halo density profile yield equally good descriptions of the data (e.g., van Albada et al. 1985; Lake & Feinswog 1989).
The structure of dark matter halos is more directly revealed in systems where the disk contributes little to the dynamics. Several studies have noted that the rotation curves of dark matter dominated dwarf galaxies are inconsistent with steeply cusped dark halos, and instead indicate constant density cores (Flores & Primack 1994; Moore 1994; Burkert 1995; Navarro, Frenk & White 1996; Burkert & Silk 1997; Stil 1999). This presents an important problem for the CDM picture, unless as suggested by Kravtsov et al. (1998) and Bullock et al. (1999), CDM halos are not as steeply cusped as suggested by others. Several solutions to the problem have already been suggested. Some argue against CDM, in favor of either modified Newtonian dynamics (McGaugh & de Blok 1998a,b) or self-interacting dark matter (Spergel & Steinhardt 1999). Others have suggested the presence of dark spheroids of baryons (Burkert & Silk 1997), or violent outflows of baryonic matter from stellar feedback (Navarro, Eke & Frenk 1996; Gelato & Sommer-Larsen 1999).
An important question in this regard is whether all dark matter halos have constant density cores as observed in the dwarfs. On the mass scale of clusters, gravitational lensing provides a promising tool to constrain the density profiles. So far, however, results have been contradictory, and the issue is still under debate (e.g., Tyson, Kochanski & Dell’Antonio 1998; Williams, Navarro & Bartelmann 1999). On the scale of massive galaxies, the most promising constraints on the density distributions of dark halos come from the rotation curves of low surface brightness (LSB) galaxies. It has been shown that the observed rotation curves of LSB galaxies are remarkably similar to those of dwarf galaxies, suggesting similar density profiles for their dark halos (Kravtsov et al. 1998; Stil 1999). Indeed, McGaugh & de Blok (1998a) have argued that, as for nearby dwarf galaxies, the rotation curves of LSB galaxies are inconsistent with the NFW profile (see also Navarro 1998).
These results imply that constant density cores are not restricted to low mass dwarf galaxies. However, while the rotation curves of dwarf galaxies are well resolved (due to their proximity), the data on more massive disk galaxies is typically of much poorer spatial resolution. Therefore, before using low resolution LSB rotation curves to put stringent constraints on the nature of dark matter, it is important that the effects of resolution (i.e. “beam smearing”) are properly taken into account.
In this paper we re-examine a set of HI rotation curves taken from the literature, focusing on LSB disk galaxies with , as described in §2. We perform disk-halo decompositions by fitting both the observed HI surface brightness and rotation curve, including the effects of beam smearing and of the adiabatic contraction of the dark halo. In §3 we describe these models, and the method used to fit the data. We present the resulting fits for low resolution and high resolution LSB data in §4 and §5, respectively, and show that all fits are consistent with NFW profiles. We discuss the implications of this result in §6, and summarize in §7.
2 Sample
To identify an appropriate sample for measuring the dark matter profiles of massive galaxies, we have selected from the literature all disk galaxies that meet the following criteria: (i) central -band surface brightness fainter than mag arcsec-2; (ii) ; and (iii) readily available -band surface photometry, HI rotation curves and HI surface brightness profiles. The 16 galaxies that meet these criteria are listed in Table 1, in order of increasing distance. In addition we list two dwarf galaxies, DDO 154 and NGC 3109, which we use for comparison in § 5.2.
To quantify the resolution of the HI rotation curves, we introduce the following two parameters: and , where is the scalelength of the stellar disk (in the -band), is the radius of the last measured point of the rotation curve, and is the FWHM of the beam of the HI observations along the beam’s major axis. Larger values of and imply that a rotation curve is better spatially resolved and has more independent data points. The majority of the galaxies listed in Table 1 are at relatively large distances and have . The only galaxy in the sample with that is well resolved is the nearby NGC 247, which has and a rotation curve that extends for almost 25 beams.
Throughout this paper we adopt a Hubble constant of . All data is converted to this value. Where necessary, we list parameter values in units of . All magnitudes and surface brightnesses are corrected for inclination and galactic extinction. Because of the poorly understood dust properties of LSB galaxies, we have not attempted a correction for internal extinction.
3 Modeling
3.1 Mass components
When fitting the rotation curves described above, we consider models with three mass-components: an infinitesimally thin gas disk, a thick stellar disk, and a spherical dark halo.
Neutral gas disks in external galaxies are typically exponential at large radii, but often contain a central hole. To model this profile, we adopt an HI surface density described by
| (1) |
Here is the scalelength of the gas disk, is a cut-off radius, and describes the magnitude of the central suppression in the HI distribution. As we show below, this simple parameterization yields extremely good fits to the observed HI surface brightness. The total HI mass that corresponds to this surface density is
| (2) |
with the incomplete gamma function. The circular velocity of the gas is computed using equation [2-146] of Binney & Tremaine (1987), assuming that the disk is infinitesimally thin and that the total surface density of the gas is 1.3 times that of the HI to take account of the mass of helium.
For the stellar disk we assume a thick exponential
| (3) |
where is the scalelength of the disk. Throughout we set . The exact value of this ratio does not influence the results to any significant degree. The circular velocity of the stellar disk is computed using equation [A.17] in Casertano (1983), and properly scaled with the stellar -band mass-to-light ratio . Except for the two giant LSB galaxies, UGC 6614 and F568-6, none of the galaxies in our sample has a significant bulge component.
We assume that initially the dark and baryonic matter virialize to form a spherical halo with a density distribution given by
| (4) |
with being the scale radius of the halo, such that for and for . For equation (4) reduces to the NFW profile. We define the concentration parameter , with the radius inside of which the mean density is 200 times the critical density for closure, i.e.,
| (5) |
Here is the circular velocity at , and . The circular velocity as function of radius can be written as
| (6) |
with and
| (7) |
The initial collapse of the gas and stellar disks within the virialized halo leads to a contraction of the dark matter halo. We assume that the baryons collapse slowly, adiabatically compressing the halo. We treat this adiabatic contraction of the dark halo following the procedure in Blumenthal et al. (1986) and Flores et al. (1993). We assume that initially the gas follows the same density distribution as the dark matter (equation [4]), and assume that all baryons end up in either the gas or the stellar disk. We thus ignore any possible hot gas that might be present in the halo, or that might have been blown out of the halo owing to stellar feedback processes; given that for the galaxies in our sample, feedback is not expected to be very efficient (Dekel & Silk 1986; Mac Low & Ferrara 1999). Our baryon fraction, defined as , where is the total mass of the galaxy (baryons plus dark matter), thus depends on the values of and that follow from fitting the rotation curves, and can be used as a sanity check of the best-fit model parameters.
3.2 Beam smearing
Because of the finite resolution of HI mapping, we need to convolve our model of the underlying surface brightness profile with the effective point spread function (i.e. the beam) of the interferometer, in order to derive the observed surface brightness at a position on the plane of the sky:
| (8) |
Here where and are the Cartesian coordinates in the equatorial plane of the disk, is the disk’s inclination angle, and is the angle between the major axes of the beam and the galaxy. We describe the beam by a two-dimensional Gaussian:
| (9) |
where is the flattening of the beam, and is the Gaussian dispersion of the beam along its major axis.
Beam smearing also affects the observed rotation curve, by allowing gas from a wide range of radii to contribute to the observed rotation velocity, , at a position on the plane of the sky:
| (10) |
(cf. Begeman 1989) where is the line of sight velocity. Throughout we assume that the gas moves on circular orbits in the plane of the disk.
3.3 Fitting the data
In order to determine the parameters which best reproduce the observed surface brightness distribution and rotation curve , we adjust our models to minimize
| (11) |
and
| (12) |
Here and are the errorbars of the HI surface brightness and rotation velocities, respectively, as quoted in the literature. and are the number of data points.
For a given choice of the Hubble constant the models described above have eight free parameters to fit the data: , , , , , , , and (or equivalently ). Note, however, that is completely determined by normalizing the models to the total mass in HI, and can thus be ignored in the fitting routine. In principle one wants to fit the surface brightness of the gas and the rotation curve simultaneously. However, a -minimization analysis using all seven parameters shows a very broad and noisy minimum and is computationally expensive. We therefore split the fitting procedure into two steps. We start by fitting the HI surface brightness, after which the observed rotation velocities are fit, while holding , , and fixed at their best-fit values. In both cases we use the downhill-simplex method (e.g., Press et al. 1992) combined with a simple random-walk routine to minimize . Tests on model galaxies show that this routine is robust in recovering the global minimum. Throughout we use equation (5) with to set , and we require and .
In order to obtain confidence levels around the best fitting kinematical model we proceed as follows. We set fixed at its best fit value and compute on a grid of -values by means of a fast one-dimensional -minimization routine to find the best fitting value of . We use the -statistic to compute confidence levels on for the given value of . The same procedure is repeated with either , or held fixed at their best fitting values.
These confidence levels should not be interpreted as strict levels of confidence on the actual physical parameters. We have not taken any uncertainties into account on the inclination angle, distance, or the rotation curves of the gas and stellar disks (i.e., we assume that the stellar mass-to-light ratio is constant throughout the galaxy). Nor in most cases are the individual data points independent of each other. Rather, the confidence levels indicate to what extent the model parameters can be changed under the given assumptions, to obtain fits to the rotation curve that are statistically equivalent.
4 Low resolution data
In order to assess the importance of beam-smearing on low-resolution data with we first analyze the six galaxies from the sample of de Blok, McGaugh & van der Hulst (1996; hereafter BMH96) that have . We do not analyze F571-8 because its high inclination angle () requires a somewhat different modeling technique than used here. The best fit parameters to the HI surface density profiles are listed in Table 2. The corresponding fits to the data are shown in Figure 1. In each case we obtain an excellent fit to the data, except for F563-1, where the wiggle in at kpc is not reproduced by our parameterized model. With the exception of F563-1, which is virtually equally well fit by a simple exponential, we find clear evidence for the presence of large holes in the HI distributions.
The best fits to the observed rotation velocities are shown in Figure 2. The parameters of the best-fit models are listed in Table 3. Circular velocities of the stellar disk are computed from the -band surface photometry (de Blok, van der Hulst & Bothun 1995). The best-fit models reproduce the observed rotation velocities extremely well. The only exception is F563-1, for which we fail to reproduce the steep inner rise of the rotation curve despite the steep central cusp of the best-fit model ().
The parameters of the best fit models span a wide range. The central cusp slope spans the entire range of allowed values from (F563-1 and F568-1) to (F583-1). The mass-to-light ratio, , spans a range from zero (F563-1 and F583-1) up to (F568-1). Finally, the baryon fraction, , covers the range from (F568-3) to (F568-1). Note that for realistic cosmologies we expect , based on a baryon density of (Walker et al. 1991). Clearly, the best fit models are not always the most physically meaningful solutions. More interesting, therefore, is to explore the areas of parameter space that yield solutions that are consistent with the data.
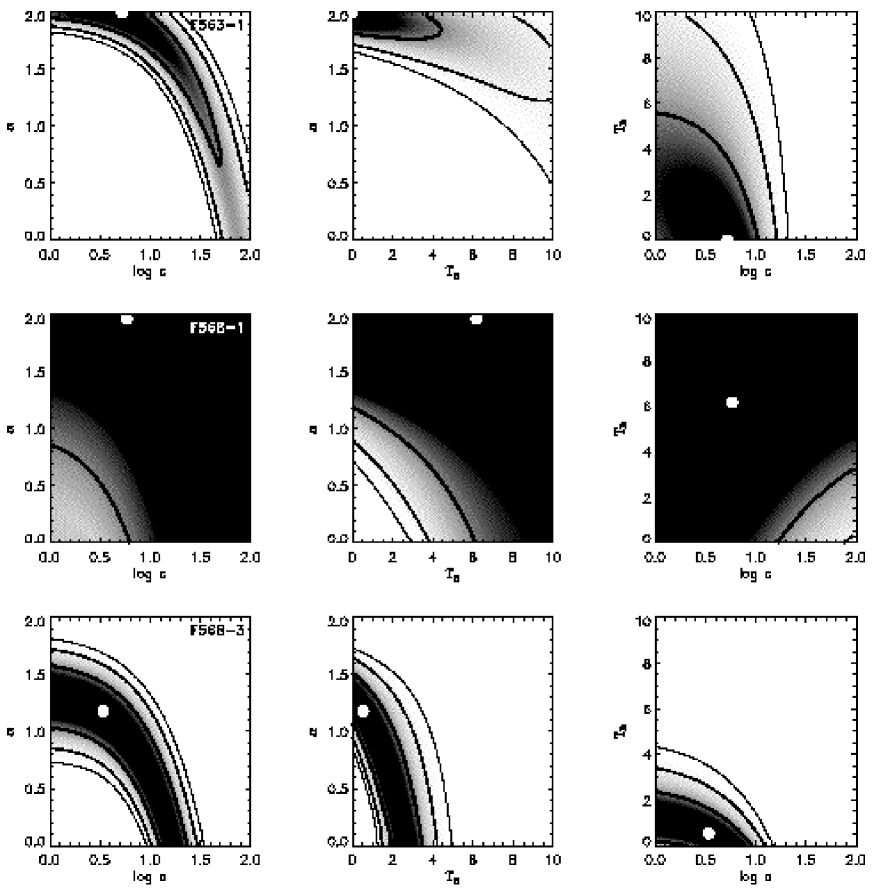
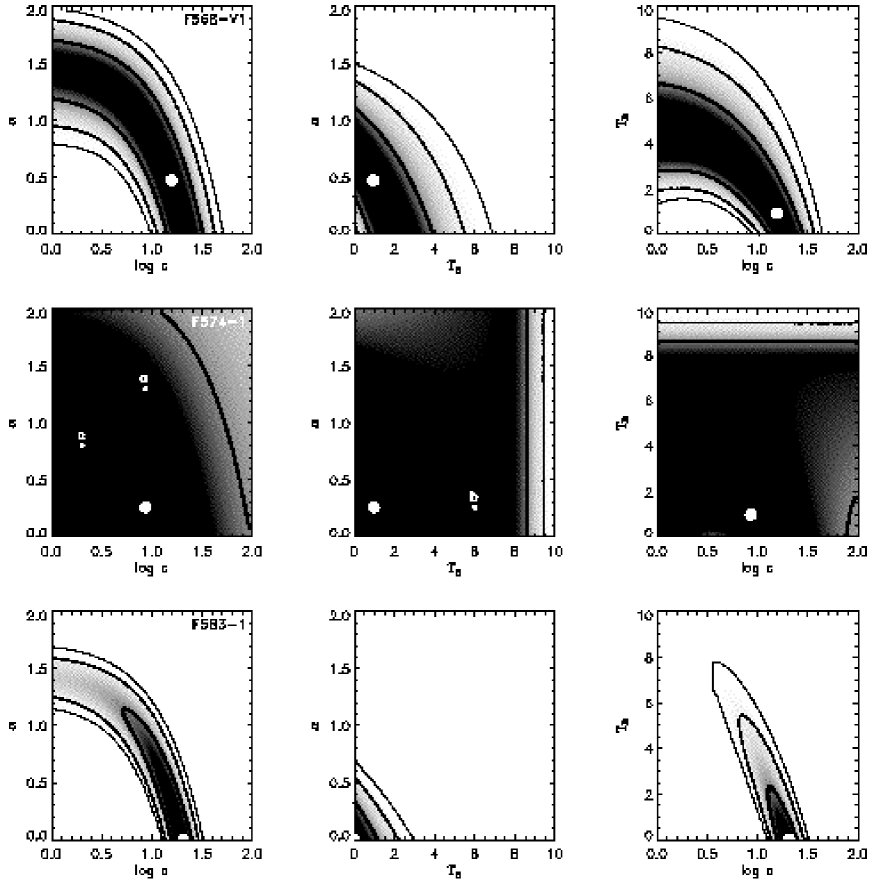
Figures 3 and 4 show contour plots of confidence levels around the best fit model for three two-dimensional cuts through parameters space. In all cases we find that large areas of parameter space are consistent with the data. The two extreme cases are F568-1 and F574-1 where virtually the entire parameter space probed falls within the 68.3 percent confidence level. Clearly, the data of the BMH96 sample is of insufficient spatial resolution to meaningfully constrain the density distributions of the dark matter halos.
To emphasize this point, in Figure 5 we plot the results for three models of F574-1 that all fall within the 68.3 percent confidence level of the best fit model. These models are indicated by small labeled dots in Figure 4, and the corresponding parameters are listed in Table 3. Models , , and have wildly different mass profiles, yet they all fit the data remarkably well; the observed rotation velocities of F574-1 are of little use in constraining the mass model.
Another important result is that the maximum mass-to-light ratios which are consistent with the data are much larger than those derived by de Blok & McGaugh (1997) using a standard maximal-disk fit (i.e., by scaling the contribution of the disk to fit the inner-most data point of the rotation curve). This inner point, however, is the point most severely influenced by beam smearing, and is artificially reduced, leading to small mass-to-light ratios (cf., Blais-Ouellette, Carignan & Amram 1998). Our results indicate that, based on the observed rotation curves, one can currently not rule out that the central regions of most of the LSB galaxies are dominated by baryons rather than dark matter.
In our fitting procedure, we consider a range of and that is much larger than the expected spread, leading sometimes to unphysical results; for instance, for small values of we often find unrealistically high values of (sometimes in excess of ). Clearly, we do not expect LSB disks to be embedded in halos this massive. In addition, -band mass-to-light ratios of are rather high given the typical colors of LSB galaxies, and might imply self-gravitating, and hence unstable, disks. Finally, we could be much more restrictive by requiring realistic baryon fractions. However, the main aim of this exercise is to illustrate that rotation curves with themselves can not be used to obtain any meaningful constraints on the density profiles or masses of dark halos.
Recently, Swaters (1999) obtained H rotation curves for five LSB galaxies in the BMH96 sample (four of which have been analyzed here). These high resolution data reveal much steeper inner rotation rotation curves than for the HI data of BMH96, clearly indicating that the HI rotation curves are severely affected by beam smearing. The H rotation curves of Swaters (1999) are in good agreement with our unsmeared best-fit rotation curves.
Reliable and strict constraints on the dark matter halos of disk galaxies thus requires much higher spatial resolution than for the sample of BMH96. Except for NGC 247, all galaxies in Table 1 with have been observed with similar spatial resolution as the galaxies of the sample of BMH96 analyzed here. The two giant LSB galaxies, UGC 6614 and F568-6, have somewhat larger than unity, but this owes mainly to the extremely large disk scalelength. These galaxies have significant bulge components which complicate constraining the density distribution of the halo component. We therefore refrain from analyzing any of the other low-resolution data, and shift our attention to the galaxy which has been observed with the highest spatial resolution: NGC 247.
5 High resolution data
5.1 The nearby LSB galaxy NGC 247
The LSB galaxy NGC 247 is a member of the nearby ( Mpc) Sculptor group and has been observed in HI by Carignan & Puche (1998). Surface photometry is taken from Carignan (1985b). The proximity of NGC 247 ensures that its HI velocity field has been very well resolved. The FWHM of the beam extends only percent of the scalelength of the stellar disk, and the HI rotation curve is measured out to 25 beams. Therefore, this galaxy is the ideal candidate to obtain useful constraints on the density distribution of its dark matter halo. Unfortunately, to date it is also the only candidate with sufficient spatial resolution that also meets our selection criteria (see § 2).
Although for NGC 247 the effects of beam smearing can easily be ignored, we have used the same analysis for NGC 247 as for the low resolution data. As a first step we fit the observed HI surface brightness. No errorbars for are given, so we assign each data point the same (arbitrary) error in our analysis. It turns out that the particular parameterization of equation (1) yields a very poor fit. After some experimenting, we found a good fit for a surface brightness profile of the form:
| (13) |
with and . The best fit parameters are listed in Table 2, and the resulting fit is shown in the upper left panel of Figure 6.
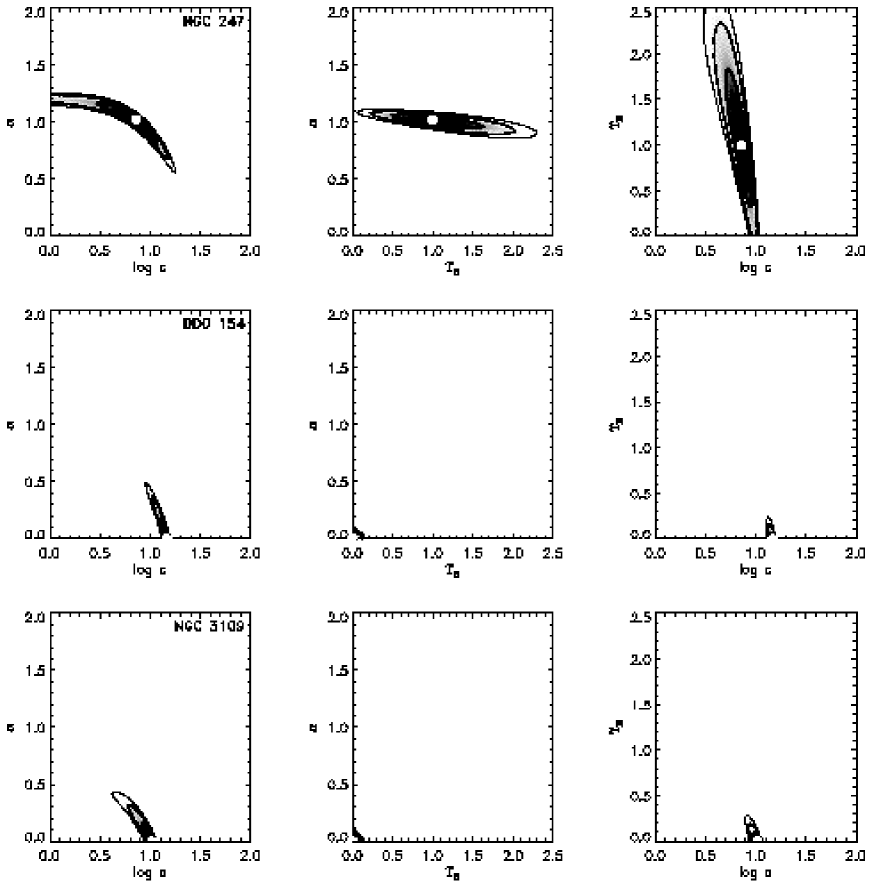
The upper right panel shows the best fit model to the observed rotation curve. This model is completely dark matter dominated, and has a dark halo with , , and . The best-fit mass-to-light ratio of the stellar disk is , resulting in a baryon fraction of . Figure 7 shows that these parameters are well constrained. We can rule out models with and at the 99.73 percent confidence level; the improvement with respect to the low resolution data of BMH96 is apparent. Note that the parameters of the best fit model are remarkably consistent with a NFW profile with a concentration parameter that is typical for realistic cosmologies (Navarro, Frenk & White 1997).
5.2 Comparison to nearby dwarfs
In order to contrast the results for NGC 247 with dwarf galaxies, we have applied the same analysis to DDO 154 and NGC 3109. These galaxies, observed by Carignan & Beaulieu (1989) and Jobin & Carignan (1990) respectively, were shown by Moore (1994) to be inconsistent with a dark matter halo that follows a Hernquist (1990) profile. Both galaxies are nearby and have been observed with good spatial resolution (see Table 1). For NGC 3109 and such that it has one of the best resolved HI velocity fields. While DDO 154 has only , the radius where the rotation curve changes slope is significantly larger than the beam size.
Our best fit models to the data are shown in Figure 6 and listed in Tables 2 and 3. As for NGC 247, no errorbars for the HI surface density are available, and we assign each data point the same (arbitrary) error. The best fit kinematic models of both galaxies are remarkably similar. Both have ( at the 99.73 percent confidence level), and . The contour plots of the confidence levels are shown in Figure 7. Clearly, the observed rotation curves of these dwarfs constrain the models extremely well, although the unphysical mass-to-light ratio suggests that our underlying model for either the surface brightness or the detailed halo shape must not be quite correct. Although firm conclusions cannot be made on the basis of three galaxies only, these preliminary results suggest that constant density cores may be a feature of only the least massive galaxies. The low resolution data of BMH96 is at least consistent with this picture.
6 Discussion
The disk-halo decompositions of LSB galaxies with presented in §4 call into question a number of strong claims that have been made in the literature. Foremost is the conclusion that the HI rotation curves of LSB disk galaxies are inconsistent with dark matter halos with steep central cusps (McGaugh & de Blok 1998a; Navarro 1998; Salucci & Persic 1997), and by implication, that observations are inconsistent with the predictions of CDM cosmologies (Navarro, Frenk & White 1997; Fukushige & Makino 1997; Moore et al. 1998). In contrast to previous interpretations, we find that for all but the lowest mass galaxies () the observations are of sufficiently low resolution that they place little or no constraints on the inner shapes of dark matter density profiles. In fact, the single case which we have found in the literature which is capable of limiting the dark matter profile (NGC 247; §5) has an inner slope which is exactly in agreement with the CDM predictions of Navarro, Frenk & White (1997).
Recently, Kravtsov et al. (1998) claimed that the rotation curves of LSB galaxies are self-similar and have the same shape as for dwarf galaxies (see also Burkert 1995). This presents another problem for CDM, since the actual density profiles of dark halos (and hence the corresponding rotation curves) are expected to reveal a significant amount of scatter (Avila-Reese et al. 1999; Ying 1999; Bullock et al. 1999). However, our results suggest that the observed self-similarity is likely to be a consequence of the large amount of beam smearing in the existing LSB observations.
The apparent shallowness of LSB rotation curves had previously lead astronomers to place strong upper limits on . For example, using halo-only NFW fits to a wide variety of disk galaxies, Pickering et al. (1997) and Navarro (1998) derived low upper limits for the concentration of the halo, and thus argued for a low-density Universe with , with the strongest constraints coming from LSB galaxies from the samples of BMH96 and Pickering et al. (1997). As the fits to these samples did not include beam smearing, the results presented here suggest that the best-fit halo concentration is likely to have been severely underestimated, and thus much larger values of are permitted by the data. For comparison, our most restrictive case in our analysis, F568-3, has at the 68.3 percent confidence level; this limit would be even higher if we had not taken account of the contributions of the gas and stellar disks, and adiabatic contraction of the halo.
While our analysis suggests that the halos of massive galaxies () are fully consistent with centrally concentrated dark matter halos and thus with large values of , we find that the halos of dwarf galaxies continue to tell a different story. Unlike their more massive LSB counterparts, there is compelling evidence that the halos of dwarf galaxies do indeed have shallow central cores. If future high-resolution studies reveal the existence of large cores in massive LSB galaxies as well, we will need to revise the standard model for the nature of dark matter (e.g., Spergel & Steinhardt 1999). If, however, these studies confirm the presence of steep central cusps in galaxies other than NGC 247, then the data on dwarf galaxies suggest that there is an intrinsic change in the structure of dark matter halos at . Although this violates the scale-free behavior predicted by almost any variant of collisionless dark matter models, it is not necessarily in contradiction with these models, if, for instance, it can be caused by baryonic physical processes. One of the most promising candidate processes is outflows (or “feedback”), a process which is known to exist in dwarf galaxies (e.g., Puche et al. 1992; Hunter, Hawley & Gallagher 1993; Martin 1999), and which is necessary to explain the slope and scatter of the Tully-Fisher relation (e.g., van den Bosch 1999). After outflows remove mass from the center of the galaxy on a short timescale, the remaining material revirializes to form a less centrally condensed system. -body simulations of this process (Navarro et al. 1996) have shown that violent outflows of baryonic matter from the center of a dark halo do result in the creation of a constant density core (see also Gelato & Sommer-Larsen 1999).
We wish (1) to test if outflows can be sufficiently large to produce cores in dwarf galaxies, and (2) to measure the velocity scale at which this process becomes ineffective. In the Appendix, we use a simple prescription to estimate how the structure of the galaxy responds to a realistic outflow. We assume that supernovae expel some fraction of the baryonic mass from the galaxy on a time-scale that is short compared to the dynamical time (i.e., resulting in a non-adiabatic change of the potential), and we tune the feedback efficiency to match the Tully-Fisher relation. The blow-out of baryonic material leads to a change in the profile of dark matter. We assume that the mass of dark matter which can essentially be displaced by this process is proportional to the mass of baryonic material lost by the galaxy, with some proportionality constant . Assuming that when the halo revirializes, the “rearranged” dark matter mass winds up outside of the scale radius , one can compute the final cusp slope of the revirialized halo.
The resulting cusp slopes are plotted in Figure 8 as function of . The locations of NGC 247, DDO 154 and NGC 3109 are plotted for comparison. Results are shown for halos with , 10, and 20, which roughly covers the range of expected values, and for initial halos with both (NFW profile) and (the value suggested by Moore et al. 1998). The models clearly show that the final cusp slope decreases with decreasing halo mass, such that dwarf galaxies could have significantly flatter cusps than more massive galaxies, in spite of having the same initial dark matter profile. If , halos initially follow an NFW profile, and have (as for NGC 3109, DDO 154, and NGC 247), this model predicts constant density cores in systems with , in reasonable agreement with observations. If, however, , there is too much mass in the center for violent outflows to destroy the central cusp; even systems with will not have constant density cores. In this case, the efficiency of relocating dark matter has to be larger. For , the resulting cusp slopes are in good agreement with the high-resolution data analyzed here. These results suggest that even if the initial structure of dark matter halos is identical for all galaxies, “gastrophysics” can easily introduce a systematic change in the profile with mass.
While this adhoc procedure ignores the detailed physics of how the dark matter adjusts to an instantaneous mass loss, it is still useful for setting the overall scale over which outflows could be effective in creating dark matter cores. Detailed -body simulations are required to test the importance of our assumptions (i.e., constant and ) and to obtain estimates of . Our results also depend on the particular model for the feedback (i.e., and , see the Appendix). With these caveats in mind, it is nevertheless reassuring that this simple model, with feedback parameters that are motivated by empirical data on the Tully-Fisher relation, yields results that are at least of the correct order of magnitude to reconcile the constant density cores in dwarfs with CDM predictions.
7 Summary and Conclusions
We have re-examined the disk-halo decompositions of several LSB disk galaxies with , improving upon previous studies by taking beam smearing and adiabatic contraction into account. Contrary to previous claims we find that the rotation curves of these systems are consistent with dark halos with steep density cusps. The actual slope of this density cusp is very poorly constrained: the data can not be used to argue against either constant density cores or against very steep cusps such as those suggested by Fukushige & Makino (1997) and Moore et al. (1998). Our results also call into question the observed self-similarity of LSB rotation curves (Kravtsov et al. 1998), and strongly reduce the constraints on (Pickering et al. 1997; Navarro 1998).
While we have shown that existing HI rotation curves for LSB galaxies are consistent with predictions of CDM and a universal baryon fraction, they cannot place any meaningful constraints. Observations at much higher resolution are required. Given the typical beam size of HI synthesis observations, this limits us to relatively nearby galaxies. Most nearby LSB galaxies, however, are dwarf galaxies with . The only LSB galaxy that meets our selection criteria and is well resolved is NGC 247, for which the HI rotation curve extends for almost 25 beams, and constrains the model parameters very well ( at the 99.73 percent confidence level with a best-fit cusp slope of ). This contrasts strongly with the nearby dwarf galaxies DDO 154 and NGC 3109, where we find at 99.73 percent confidence with a best-fit value of (i.e., a constant density core). This suggests that constant density cores are only present in dwarf galaxies, whereas more massive galaxies have dark halos with a steep central cusp as expected for CDM. We have shown that violent outflows due to supernovae feedback can account for such a mass-dependence of the shape of dark matter halos.
Although the low-resolution data examined here is consistent with this picture, it is premature to draw conclusions about the density profiles at high mass based upon the single case of NGC 247. What are needed at this point are high resolution rotation curves for a sufficiently large sample of LSB disk galaxies with . Unless these galaxies are relatively nearby ( Mpc), there is little hope that HI observations will yield sufficient spatial resolution. We need to focus on observations in either H (i.e., Blais-Ouellette et al. 1998; Swaters 1999) or CO (Sofue et al. 1999). These tracers of the velocity field can be observed at much higher spatial resolution, and, when combined with HI rotation curves to sample the outer parts of the velocity field, provide promising tools to examine whether more massive disk galaxies have cusped dark halos similar to NGC 247. Independent of the outcome, such studies will have strong implications for theories of galaxy formation and for the nature of the dark matter.
Appendix A Supernovae feedback and the mass-dependence of halo cusp slopes
We examine if outflows can explain a change in the central cusp slope of dark matter halos from for systems with (i.e., NGC 3109) to for systems with (i.e., NGC 247).
As a mechanism for producing outflows of baryonic matter we consider feedback from supernovae (SN). The total energy produced by SN can be written as
| (A1) |
with the number of SN produced per Solar mass of stars formed, the energy produced per SN, and the total mass in stars. We assume that this energy expels a mass of baryons from the halo. Taking account of the system’s escape velocity and requiring energy balance, one obtains
| (A2) |
(cf. Kauffmann et al. 1993; Natarajan 1999) where we introduce the parameter which describes the efficiency with which the SN energy expels baryonic mass from the halo. Conservation of baryon mass111Note that we make the oversimplifying assumption that all the baryonic matter is in stars or expelled; no cold gas is taken into account. requires that . Setting , ergs, and writing
| (A3) |
one obtains
| (A4) |
As a model for the feedback we consider and and we set the baryon fraction to . Semi-analytical models for the formation of disk galaxies, presented by van den Bosch (1999) and van den Bosch & Dalcanton (1999) have shown that for these values one obtains a near-infrared Tully-Fisher relation with the correct slope, scatter and normalization. In addition, adopting a feedback model with these parameters yields an absence of high surface brightness dwarf galaxies, as observed.
We now assume that the blow-out of mass results in the relocation of a dark matter mass of to larger radii, with of order unity. In order to quantify in terms of the cusp slopes of the dark halos, we make the following simplifying assumption. We assume that both the initial and final halos have density profiles given by equation (4) with and , respectively. In addition, we assume that both halos have identical dark matter masses, scale-radii, , and concentration parameters, . Defining as the difference in halo mass within a radius we obtain
| (A5) | |||||
with and given by equation (7) with set to the initial and final values, respectively.
References
- (1) Avila-Reese, V., Firmani, C., Klypin, A. A., & Kravtsov, A. V., 1999, preprint (astro-ph/9906260)
- (2) Begeman, K. C. 1989, A&A, 233, 47
- (3) Binney, J. J., & Tremaine, S. D. 1987, Galactic Dynamics. (Princeton: Princeton University Press)
- (4) Blais-Ouellette, S., Carignan, C., & Amram, P. 1989, preprint (astro-ph/9811142)
- (5) Blumenthal, G. R., Faber, S. M., Flores, R., & Primack, J. R. 1986, ApJ, 301, 27
- (6) Bullock, J. S., Kolatt, T. S., Sigad, Y., Somerville, R. S., Kravtsov, A. V., Klypin, A. A., Primack, J. R., & Dekel, A. 1999, preprint (astro-ph/9908159)
- (7) Burkert, A. 1995, ApJ, 447, L25
- (8) Burkert, A., & Silk, J. 1997, ApJ, 488, L55
- (9) Carignan, C. 1985a, ApJ, 299, 59
- (10) Carignan, C. 1985b, ApJS, 58, 107
- (11) Carignan, C., & Beaulieu, S. 1989, ApJ, 347, 760
- (12) Carignan, C., & Puche, D. 1990, AJ, 100, 641
- (13) Casertano, S. 1983, MNRAS, 203, 735
- (14) de Blok, W. J. G., van der Hulst, J. M., & Bothun, G. D., 1995, MNRAS, 274, 235
- (15) de Blok, W. J. G., McGaugh, S. S., & van der Hulst, J. M. 1996, MNRAS, 283, 18 (BMH96)
- (16) de Blok, W. J. G., & McGaugh, S. S. 1997, MNRAS, 290, 533 (BM97)
- (17) Dekel, A., & Silk, J. 1986, ApJ, 303, 39
- (18) de Vaucouleurs, G., de Vaucouleurs, A., Corwin. Jr. H. G., Buta. R. J., Paturel, G., & Fouque, P. 1991, Third Reference Catalogue of Bright Galaxies, (Springer-Verlag: New York)
- (19) Flores, R., Primack, J. R., Blumenthal, G. R., & Faber, S. M. 1993, ApJ, 412, 443
- (20) Flores, R., & Primack, J. R. 1994, ApJ, 427, L1
- (21) Freeman, K. C. 1970, ApJ, 160, 811
- (22) Fukushige, T., & Makino, J. 1997, ApJ, 477, L9
- (23) Gelato, S., & Sommer-Larson, J. 1999, MNRAS, 303, 321
- (24) Ghigna, S., Moore, B., Governato, F., Lake, G., Quinn, T., & Stadel, J. 1999, preprint (astro-ph/9910166)
- (25) Hernquist, L. 1990, ApJ, 356, 359
- (26) Hunter, D. A., Hawley, W. N., & Gallagher, J. S. 1993, AJ, 106, 1797
- (27) Jobin, , M., & Carignan, C. 1990, AJ, 100, 648
- (28) Kauffmann, G., White, S. D. M., & Guiderdoni, B. 1993, MNRAS, 264, 201 (KWG93)
- (29) Kravtsov, A. V., Klypin, A. A., Bullock, J. S., & Primack, J. R. 1998, ApJ, 502, 48
- (30) Lake, G., & Feinswog, L., 1989, AJ, 98, 166
- (31) Mac Low, M.-M., & Ferrrara, A. 1999, ApJ, 513, 142
- (32) Martin, C. L. 1999, ApJ, 513, 156
- (33) McGaugh, S. S. 1998, preprint (astro-ph/9812327)
- (34) McGaugh, S. S., & Bothun, G. D. 1994, AJ, 107, 530
- (35) McGaugh, S. S., & de Blok, W. J. G. 1998a, ApJ, 499, 41
- (36) McGaugh, S. S., & de Blok, W. J. G. 1998b, ApJ, 499, 66
- (37) Moore, B., 1994, Nature, 370, 629
- (38) Moore, B., Governato, F., Quinn, T., Stadel, J., & Lake, G. 1998, ApJ, 499, L5
- (39) Natarajan, P. 1999, ApJ, 512 105
- (40) Navarro, J. F. 1998, preprint (astro-ph/9807084)
- (41) Navarro, J. F., Eke, V. R., & Frenk, C. S. 1996, MNRAS, 283, 72
- (42) Navarro, J. F., Frenk, C. S., & White, S. D. M. 1996, ApJ, 462, 563
- (43) Navarro, J. F., Frenk, C. S., & White, S. D. M. 1997, ApJ, 490, 493
- (44) Pickering, T. E., Impey, C. D., van Gorkum, J. H., & Bothun, G. D. 1997, AJ, 114, 1858
- (45) Press, W. H., Teukolsky, S. A., Vetterling, W. T., & Flannery, B. P. 1992, Numerical Recipes (Cambridge: Cambridge University Press)
- (46) Puche, D., Westpfahl, D., Brinks, E., & Roy, J.-R. 1992, AJ, 103, 1841
- (47) Salucci, P., & Persic, M. 1997, in Dark and Visible Matter in Galaxies, ASP conference series, Vol. 117, eds. M. Persic & P. Salucci, p. 1
- (48) Scalo, J. N. 1986, Fundam. Cosmic Phys., 11, 1
- (49) Sofue, Y., Tutui, Y., Honma, M., Tomita, A., Takamiya, T., Koda, J., & Takeda, Y. 1999, preprint (astro-ph/9905056)
- (50) Spergel, D. N., & Steinhardt, P. J. 1999, preprint (astro-ph/9909386)
- (51) Stil, J. 1999, PhD Thesis, Leiden University
- (52) Swaters, R. A. 1999, PhD Thesis, University of Groningen
- (53) Tyson, J. A., Kochanski, G. P., & Dell’Antonio, I. P. 1998, ApJ, 498, L107
- (54) van Albada, T. S., Bahcall, J. N., Begeman, K., & Sancisi, R. 1985, ApJ, 295, 305
- (55) van den Bosch, F. C. 1999, ApJ, in press (astro-ph/9909298)
- (56) van den Bosch, F. C., & Dalcanton, J. J. 1999, ApJ, submitted
- (57) van der Hulst, J. M., Skillman, E. D., Smith, T. R., Bothun, G. D., McGaugh, S. S., & de Blok, W. J. G. 1993, AJ, 106, 548
- (58) van Zee, L., Haynes, M. P., Salzer, J. J., & Broeils, A. H. 1997, AJ, 113, 1618
- (59) Walker, T. P., Steigman, G., Schramm, D. N., Olive, K. A., & Kang, H.-S. 1991, ApJ, 376, 51
- (60) Williams, L. L. R., Navarro, J. F., & Bartelmann, M. 1999, preprint (astro-ph/9905134)
- (61) Ying, Y. P. 1999, preprint (astro-ph/9901340)


| Galaxy | Ref. | |||||||||
|---|---|---|---|---|---|---|---|---|---|---|
| (1) | (2) | (3) | (4) | (5) | (6) | (7) | (8) | (9) | (10) | (11) |
| NGC 247 | 1,2 | |||||||||
| UGC 11820 | 3,4 | |||||||||
| UGC 634 | 3,4 | |||||||||
| F583-1 | 7,8 | |||||||||
| UGC 5999 | 5,6 | |||||||||
| F563-1 | 7,8 | |||||||||
| F571-8 | 7,8 | |||||||||
| UGC 1230 | 5,6 | |||||||||
| UGC 5005 | 5,6 | |||||||||
| UGC 128 | 5,6 | |||||||||
| F568-3 | 7,8 | |||||||||
| F568-V1 | 7,8 | |||||||||
| F568-1 | 7,8 | |||||||||
| UGC 6614 | 9,10 | |||||||||
| F574-1 | 7,8 | |||||||||
| F568-6 | 9,10 | |||||||||
| DDO 154 | 11 | |||||||||
| NGC 3109 | 12,13 |
Note. — Column (1) lists the name of the galaxy. Columns (2) – (6) list the distance to the galaxy (in Mpc), absolute -band magnitude, central -band surface brightness (in mag arcsec-2), scalelength of the stellar disk (in kpc), and the maximum observed rotation velocity (in ), respectively. Columns (7) and (8) list the ratios of and , with the major axis of the FWHM of the beam of the HI observations. These ratios are measures for the spatial resolution of the observations. Columns (9) and (10) list the inclination angle of the galaxy and the flattening, , of the beam. Finally, column (11) lists the references to the original sources of the data (see below). All data has been converted to . Magnitudes and central surface brightnesses have been corrected for inclination and galactic extinction, but not for internal extinction.
1. Carignan & Puche (1990b), 2. Carignan (1985b), 3. van Zee et al. (1997), 4. de Vaucouleurs et al. (1991) 5. van der Hulst et al. (1993) 6. de Blok & McGaugh (1997) 7. de Blok, McGaugh & van der Hulst (1996) 8. de Blok, van der Hulst & Bothun (1995) 9. Pickering et al. (1997) 10. McGaugh & Bothun (1994) 11. Carignan & Beaulieu (1989) 12. Jobin & Carignan (1990) 13. Carignan (1985a)
| Galaxy | |||||
|---|---|---|---|---|---|
| kpc | kpc | ||||
| (1) | (2) | (3) | (4) | (5) | (6) |
| F563-1 | |||||
| F568-1 | |||||
| F568-3 | |||||
| F568-V1 | |||||
| F574-1 | |||||
| F583-1 | |||||
| NGC 247 | |||||
| DDO 154 | |||||
| NGC 3109 |
Note. — Column (1) lists the name of the galaxy. Columns (2) through (5) list the best fitting parameters for the HI surface density, and column (6) lists the corresponding HI mass.
| Galaxy | Model | |||||
|---|---|---|---|---|---|---|
| (1) | (2) | (3) | (4) | (5) | (6) | (7) |
| F563-1 | BF | |||||
| F568-1 | BF | |||||
| F568-3 | BF | |||||
| F568-V1 | BF | |||||
| F574-1 | BF | |||||
| a | ||||||
| b | ||||||
| c | ||||||
| F583-1 | BF | |||||
| NGC 247 | BF | |||||
| DDO 154 | BF | |||||
| NGC 3109 | BF |
Note. — Column (1) lists the name of the galaxy. Columns (2) lists the ID of the model, with ‘BF’ indicating the best-fit model (i.e., the one that minimizes ). For F574-1 three additional models are listed (a, b, and c) all of which fall within the 68.3 confidence level of the BF-model (see contour plots in Figure 4). Columns (3) through (5) list parameters of the model: , (in ), and (in ). Finally, column (7) gives the resulting baryon fraction