Evidence for X-ray emission from a large-scale filament of galaxies?
Abstract
Cosmological simulations predict that a large fraction of the baryonic mass of the Universe exists as K diffuse, X-ray emitting gas, tracing low density filament and sheet-like structures exterior to massive clusters of galaxies. If present, this gas helps reconcile the current shortfall in observed baryon counts relative to the predictions of the standard Big Bang model. We present here the discovery and analysis of a significance half-degree filamentary structure, present in both I-band galaxy surface density and unresolved X-ray emission in a deep ROSAT PSPC field. The estimated diffuse X-ray emission component of this structure has a surface brightness of erg s-1 cm-2 arcmin-2(0.5- 2 keV), comparable to the predictions for inter-cluster gas and may represent a direct detection of this currently unconfirmed baryonic component.
1 Introduction
Low density, large-scale, filamentary and sheet-like structures are seen in the space distribution of galaxies and are expected in many models of structure formation (e.g. Cold Dark Matter). Recent simulations (Cen & Ostriker (1993); Scaramella et al (1993); Bryan et al (1994); Cen & Ostriker (1999)) suggest that low density gas exists in such structures and can be shock-heated to K without violating microwave background spectral distortion constraints (Wright et al (1994); Cen & Ostriker (1993)). Furthermore, in order for the observed baryon ‘budget’ (Fukugita et al (1998)) to match the detailed predictions of Big Bang nucleosynthesis we might expect at least 50% of present day baryons to be in the form of these warm and hot plasmas.
Attempts to detect X-ray emission from filaments that might connect clusters (Briel & Henry (1995)) have yielded an upper limit to the emission of erg s-1 cm-2 arcmin-2(at significance). Studies of a likely supercluster sheet at has yielded evidence for sub-1 keV X-ray gas in fairly localized, diffuse structure (Wang et al (1997)), however the X-ray surface brightness is times higher than that expected from model estimates of the integrated surface brightness due to warm inter-cluster gas (Cen & Ostriker (1993); Bryan et al (1994); Cen et al (1995); Cen & Ostriker (1999)). These fall in the range of erg s-1 cm-2 arcmin-2, where the major contribution comes from structure at . Kull & Böhringer (1999) detect evidence for extended emission between a cluster pair in the Shapley Supercluster, however the emission is brighter than the Briel & Henry (1995) upper limit and may be due to cluster merger/interaction rather than genuine intercluster gas.
In order to investigate spatial correlations between galaxies and X-ray emitting intergalactic gas, we have undertaken a complete optical survey of the inner regions of 22 deep fields from the ROSAT PSPC archive (the ROSAT Optical X-ray (ROX) survey, Donahue et al, in preparation). Galaxy counts to a completeness limit of -band have been obtained for the central arcmin region of each field.
In addition to seeking distant galaxy clusters via coincidences of galaxy space overdensities and X-ray emission, this dataset is well suited to investigating the angular cross-correlation of the unresolved X-ray background with the distribution of optical galaxies. is a measure of the mean fractional excess X-ray intensity relative to the mean background at an angle () from a given galaxy. Extensive information about the composition of the X-ray background and the clustering properties of X-ray luminous sources can then be obtained, see e.g. Refregier et al (1997), Almaini et al (1997). We evaluate independently for each field using a finite cell estimator (Refregier et al (1997), Eqns 2,6).
Seven fields in the ROX survey exhibit positive plateaus in at angular scales arcmin, distinctly different from the expectations of discrete X-ray sources (Refregier et al (1997), Scharf et al, in preparation). In one of these fields (labelled CL1603, equatorial coordinates 16 04 28, +43 13 12 (J2000), ROSAT exposure time 29 ksec) we have observed a highly extended optical/X-ray structure. While correlated optical and X-ray structure is seen in other fields, none exhibit the apparently contiguous extent of this arcmin feature.
2 Data analysis
We have corrected all ROSAT data for telescope vignetting and jitter using standard exposure maps (Snowden et al (1992), and the maximum correction within the fields is %. The 0.5-2 keV counts are used (we have attempted to perform a similar analysis using the 0.1-0.5 keV band, but the higher background noise restricts us to measuring uninteresting upper limits), thereby reducing the background contribution from the Galaxy, minimizing the size of the point-spread function, and maximizing sensitivity to thermal bressstrahlung emission from warm and hot gas.
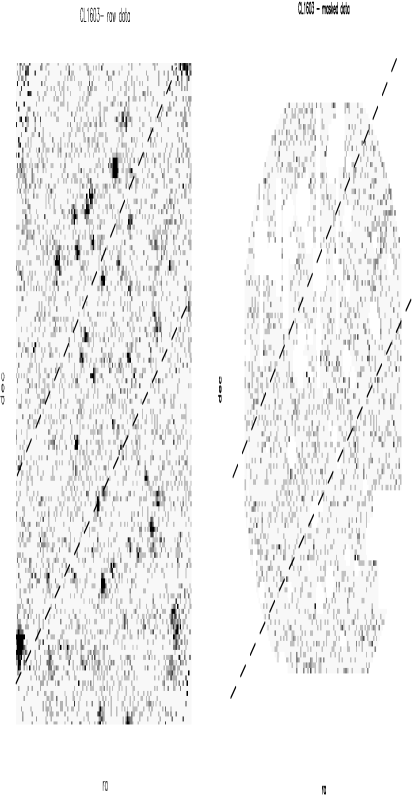
Before computing for each survey field, or performing the analyses presented here, we remove all identifiable discrete X-ray sources and spurious optical features. We clip, or mask, the X-ray data using a wavelet-based source detection algorithm (Rosati et al (1995)) that finds all sources (extended or point-like) down to a signal-to-noise of . The mean surface-brightness is then determined in circular annuli about each source, and the X-ray source photons are masked to a radius defined by a surface brightness limit reflecting the background level. The mean value of this limit is erg s-1 cm-2 arcmin-2 (0.5-2 keV) over all 22 fields. For the CL1603 field it is erg s-1 cm-2 arcmin-2. Our final measurements are not sensitive to the precise specification of this limit. Bright stars and scattered light in our optical fields are removed by clipping out tainted rectangular areas. The optical and X-ray masks are then combined and the total mask is applied to both optical and X-ray datasets. There are no obvious correlations between the spatial masking and the apparent filamentary X-ray structure seen in the CL1603 field, as illustrated in Figure 1.
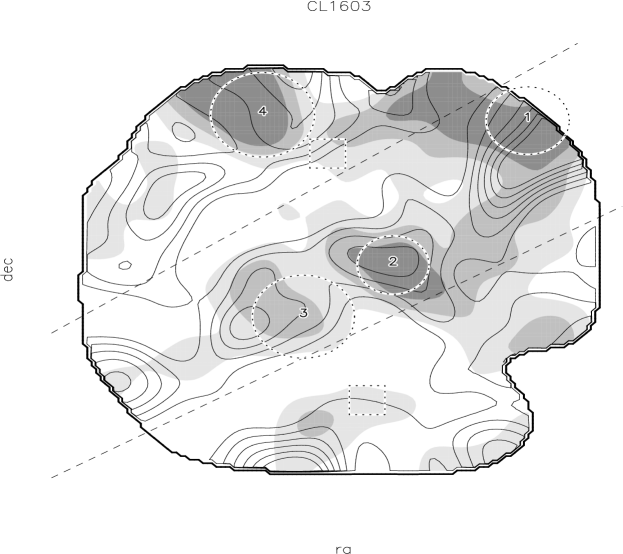
In order to assess the significance and flux of the morphologically complex structure seen in field CL1603 we define its boundary using an aperture encircling those regions with a galaxy density at , as shown in Fig. 2. The structure’s flux was measured only within the part of this aperture which falls between the dashed lines, and the background X-ray level was estimated using all data exterior to the dashed lines.
The background-subtracted flux of this structure is then ct s-1 (90 counts total), corresponding to erg s-1 cm-2 (0.5-2 keV) in an area of 176 arcmin2. The mean excess surface brightness is thus erg s-1 cm-2 arcmin-2 Given the background of ct s-1 arcmin-2 (825 counts total in 176 arcmin2), the apparent filament has signal-to-noise .
3 Statistical significance of faint structure
An alternative way to assess this structure’s significance is to compare the CL1603 field with the others in the ROX survey, by computing the excess X-ray flux within similar optically-defined apertures. This technique takes into account fluctuations due to all sources, including the ‘cosmic’ variance from field to field and correlations of optical galaxy counts with pointlike X-ray sources too faint to be resolved. We define a flux contrast for each field, , which is the fractional excess of X-ray counts relative to the expected background within regions containing . This threshold corresponds to a galaxy density somewhat lower than the mean galaxy density at of gal arcmin-2, as determined from the DEEP sky survey (Postman et al (1998)). Our results are relatively insensitive to this choice but limits outside of the range gal arcmin-2 encompass too little background/source area to compute a sensible contrast in the fields. The mean flux contrast per field is estimated together with its dispersion, which we assume to be normally distributed for this simple analysis.
First, we test the ‘null’ hypothesis that the CL1603 structure is a random coincidence by evaluating the mean over all non-matched optical-X-ray combinations of the 22 fields. This null hypothesis for the CL1603 field is rejected at the level (Table 1).
X-ray emission in the Universe is known to be positively correlated with the large-scale distribution of galaxies (Refregier et al (1997); Almaini et al (1997)), but we do not yet know the relative contributions of discrete X-ray sources (clustered like galaxies) and diffuse, extended sources (gas in groups, clusters, and larger-scale structures). Following previous work (Refregier et al (1997)) we assume that the 15 ROX survey fields without excess plateaus in are more representative of cases where the positively correlated X-ray emission is entirely due to discrete sources which are themselves galaxies, or at least clustered like the observed galaxies. We should therefore expect a systematic (positive) difference between for the 7 ‘excess’ fields and that for the 15 other fields. Furthermore, this difference should indicate the typical fraction of genuinely diffuse X-ray emission which is positively correlated with the galaxy distribution.
Table 1 summarizes our results. As expected, is systematically lower in the 15 fields with no evidence of extended emission from the measurement of . Applying the statistical properties of all 21 other fields to the CL1603 field, we find to be excessive there at the level. However, these fields could themselves contain diffuse filamentary emission. If instead we establish a statistical baseline using the 15 fields with no large-scale excess, the significance of the CL1603 structure rises to . Taking the results for the 15-field mean (averaging rows 5 and 6 of Table 1) as the best estimate of the non-diffuse flux contrast and subtracting it from the flux constrast measured for CL1603 we estimate that % of the flux excess in this field may be due to unresolved diffuse emission. Applying this fraction to our previous, direct, estimate of the structure’s surface brightness, we estimate that the diffuse X-ray component has a surface brightness of erg s-1 cm-2 (0.5-2 keV).
| Dataset | Dispersion () | CL1603 relative significance | |
|---|---|---|---|
| CL1603 | 0.256 | - | - |
| Randomized | 0.002 | 0.066 | +3.9 |
| 21 Fields | 0.081 | 0.071 | +2.5 |
| 20 Fields | 0.086 | 0.069 | +2.5 |
| (minus 4C23.37) | |||
| 15 Fields | 0.058 | 0.045 | +4.4 |
| 14 Fields | 0.063 | 0.040 | +4.8 |
| (minus 4C23.37) |
3.1 Cluster and group flux contributions
Some of the X-ray emission in the CL1603 field could potentially be coming from faint, unmasked X-ray clusters. In order to gauge their effect, we have applied an optical cluster finding algorithm (Postman et al (1996)) to the CL1603 field (Fig. 2 shows detections). None of the candidates are associated with resolved, extended X-ray sources with fluxes erg s-1 cm-2, although 2, 3 and 4 are marginally coincident with sources identified as point-like. However, they appear to be correlated with both the galaxy distribution and enhancements in the unresolved X-ray emission. We have measured the flux in circular apertures defined by the extents of the optical candidates (Fig. 2) and have estimated the background using all data exterior to these regions. The signal-to-noise for each candidate is , and the fluxes are erg s-1 cm-2. Consequently, no significant X-ray emission was detected from these individual objects. We note that excluding the flux within the apertures around objects 1, 2, and 3 reduces the total flux from the putative filament to erg s-1 cm-2, however the mean surface brightness is only reduced to erg s-1 cm-2 arcmin-2. Within the Poisson uncertainties this is therefore unchanged.
We do not know the distance to the structure in the CL1603 field, but we make the following observations. At the galaxy density contrast is low compared to the overall () density field, but it appears to trace the structure similarly. At the density contrast within the structure is significantly higher and the central regions (near cluster candidates 2 and 3) are the highest peaks in the field. For , the typical redshift would be based on the spectrum emitted by a passively evolving elliptical galaxy (Postman et al (1998)). At the overall density fluctuation constrast is reduced, but again, the central regions and the region close to candidate 1 show the largest enhancements. Estimated cluster-candidate redshifts from the cluster-finding algorithm (Postman et al (1996)) are as follows: (1) , (2) , (3) , (4) . Given the expected success rate of % for correctly identifying real clusters with this method (Postman et al (1996)), it seems reasonable that the structure most likely lies at and has a physical extent h Mpc (for km s-1 Mpc-1 and ). Our X-ray wavelet detection limits for extended sources ( erg s-1 cm-2) implies that the optical cluster candidates could have h erg s-1 (). This further suggests that the observed galaxy enhancement, while possibly containing very X-ray poor systems, is a genuinely low density, extended structure.
The original targets of the ROSAT observation, two previously identified high-redshift () cluster candidates (Gunn et al (1986); Castander et al (1994); Oke et al (1998)) are labelled in Fig2. The southern cluster is an unresolved X-ray source (Castander et al (1994)) but not detected optically (). The northern cluster is obscured optically by a nearby bright star and also was not detected in X-rays. Neither exhibits any strong correlation with the structure.
4 Discussion
We have detected an apparent filamentary-like structure at significance in X-ray flux and significance as a joint X-ray/optical overdensity. If real, the structure is likely to be at and hMpc in size. Although optical cluster candidates are detected in the region, if any are indeed X-ray luminous then they must be faint, supporting the notion of an extended, low density system. Our estimate of diffuse large-scale emission ( erg s-1 cm-2 arcmin-2) is rather lower than previous constraints on large-scale filamentary X-ray emission (§1).
Because estimates of the diffuse X-ray background intensity (Pen (1999)) are several times higher than that due to a single filament (Cen & Ostriker (1993, 1999)), we estimate that several such filamentary structures could typically be superposed along any given line of sight, confusing their detection. Given the low measured background surface brightness in the CL1603 data (§2) we therefore suspect that this field may in fact be filament poor, allowing a single structure to dominate.
The interpretation of this structure as being predominantly diffuse gas is clearly not yet secure, albeit theoretically plausible. Obtaining photometric and spectroscopic redshift information in this (and surrounding) fields will be of enormous help in testing the reality of the observed structures. The CL1603 field is clearly an excellent target for future X-ray missions such as XMM, where a factor of more than 10 increase in sensitivity over ROSAT should allow structures such as these to be studied in detail.
References
- Almaini et al (1997) Almaini, O. et al, 1997, MNRAS, 291, 372
- Briel & Henry (1995) Briel, U. G., Henry, J. P., 1995, A&A, 302, L9
- Bryan et al (1994) Bryan, G. L., Cen, R., Norman, M. L., Ostriker, J. P., Stone, J. M., 1994, ApJ, 428, 405
- Castander et al (1994) Castander, F. J., Ellis, R. S., Frenk, C. S., Dressler, A., 1994, ApJ, 424, L79
- Cen & Ostriker (1993) Cen, R., Ostriker, J. P., 1993, ApJ, 417, 404
- Cen et al (1995) Cen, R., Kang, H., Ostriker, J. P., Ryu, D., 1995, ApJ, 451, 436
- Cen & Ostriker (1999) Cen, R., Ostriker, J. P., 1999, ApJ, 514, 1
- Fukugita et al (1998) Fukugita, M., Hogan, C. J., Peebles, P. J. E., 1998, ApJ, 503, 518
- Gunn et al (1986) Gunn, J. E., Hoessel, J. G., Oke, J. B., 1986, ApJ, 306, 30
- Kull & Böhringer (1999) Kull, A., Böhringer, H., 1999, A&A, 341, 23
- Oke et al (1998) Oke, J., Postman, M., Lubin, L., 1998, AJ, 116, 549
- Pen (1999) Pen, U., 1999, ApJ, 510, L1-L5
- Postman et al (1996) Postman, M. et al., 1996, AJ, 111, 615
- Postman et al (1998) Postman, M. et al, 1998, ApJ, 506, 33
- Refregier et al (1997) Refregier, A., Helfand, D. J., McMahon, R. G., 1997, ApJ, 477, 58
- Rosati et al (1995) Rosati, P., Della Ceca, R., Norman, C., Giacconi, R., 1995, ApJ, 445, L11
- Scaramella et al (1993) Scaramella, R., Cen, R., Ostriker, J. P., 1993, ApJ, 416, 399
- Snowden et al (1992) Snowden, S. L., Plucinsky, P. P., Briel, U., Hasinger, G., Pfeffermann, E., 1992, ApJ, 393, 819
- Wang et al (1997) Wang, Q. D., Connolly A., Brunner, R., 1997, ApJ, 487, 13
- Wright et al (1994) Wright, E. et al, 1994, ApJ, 420, 450