The Spectral Appearance of Primeval Galaxies
Abstract
The current and forthcoming observations of large samples of high–redshift galaxies selected according to various photometric and spectroscopic criteria can be interpreted in the context of galaxy formation, by means of models of evolving spectral energy distributions (SEDs). We hereafter present stardust which gives synthetic SEDs from the far UV to the submm wavelength range. These SEDs are designed to be implemented into semi–analytic models of galaxy formation.
Institut d’Astrophysique de Paris, CNRS, 98bis Bld Arago, 75014 Paris
1. The zoo of high–redshift galaxies
The search for primeval galaxies has been one of the long–term programs of observational cosmology, along with the development of sensitive detectors, and is currently receiving an exciting boost with the new generation of 8–metre class telescopes. However, the search itself is somewhat hampered by the fuzziness of the concept of “primeval galaxy”. This is generally understood as being “a galaxy which is captured at the epoch of its formation”. Since there are several competing theories about what a forming galaxy should look like, it is readily possible that we are missing part of the process of galaxy formation because we do not know yet what to search for.
More specifically, two general paradigms have been proposed in the last twenty years or so. In the picture of monolithic collapse, galaxies form at a given epoch , when the physical conditions of the universe are favourable, and evolve at different rates which are fixed by the initial conditions. In the picture of hierarchical collapse, there is nothing like a given redshift of galaxy formation. Larger galaxies form from the merging of smaller ones, which on their turn have formed from the merging of still smaller lumps, and so on. The beginning of the process took place at some early redshift (when the first objects can cool) and is still going on now. As a result, the “epoch of galaxy formation” can be defined e.g. as the epoch when the first stars formed, when 50 % of the stars have formed, or when the morphology was fixed after the last major merging event. This hierarchical galaxy formation is now modelled in the context of hierarchical clustering where dark matter completely rules gravitational collapse.
The models of galaxy formation have to reproduce the wide variety of objects which are now observed at high redshift, probably after strong observational biasses that are not fully understood. These objects are generally selected according to photometric criteria. We now have Luminous Blue Compact Galaxies (LBCGs; and ), Lyman–Break Galaxies (LBGs; or , and ), Extremely Red Objects (EROs; and ), Lyman Alpha Galaxies (LAGs; or , and Å), faint submm sources that are likely to be the high– counterparts of the local “Ultraluminous Infrared Galaxies” discovered by iras (high– ULIRGs; and ), Damped Lyman Absorbers (DLAs; atom cm-2), etc. In order to link the predictions of the models of galaxy formation with these observations, it is necessary to model the spectral energy distributions (SEDs) on the widest wavelength range, from the rest–frame UV to the rest–frame submm.

2. The case for high–redshift dust
As a matter of fact, several pieces of observational evidence are now converging to show that there is a significant amount of extinction in high–redshift galaxies. Consequently, the absorption and emission processes due to dust cannot be neglected in assessing the luminosity budget of forming galaxies. Among these pieces of evidence, we can quote:
(i) The discovery of the Cosmic IR Background at a level 10 times higher than the no–evolution predictions based on the iras luminosity functions, and twice as high as the Cosmic Optical Background (Puget et al. 1996, Guiderdoni et al. 1997, Fixsen et al. 1998, Hauser et al. 1998, Lagache et al. 1999).
(ii) The IR and submm counts that have broken the CIRB into its brightest contributors at 15 m (ISOCAM down to mJy, Aussel et al. 1999, Elbaz et al. 1999), 175 m (ISOPHOT down to mJy, Kawara et al. 1998, Puget et al. 1999), and 850 m (SCUBA down to 2 mJy, Smail et al. 1997, Hughes et al. 1998, Barger et al. 1998, 1999a, Eales et al. 1999). Although the poor spatial resolution of the observations makes the identification of the optical counterparts somewhat difficult, the first results of the spectroscopic follow–ups seem to show that some of the sources are at (Smail et al. 1998, Lilly et al. 1999, Barger et al. 1999b).
(iii) At least some of the EROs (e.g. HR10 at , Cimatti et al. 1998a) are high–redshift dusty objects.

(iv) The extinction in LBCGs at corresponds to a factor 3 extinction on the rest–frame flux at 2800 Å (Flores et al. 1999).
(v) The extinction in LBGs at and 4 is high (), with a trend of a larger extinction for the brightest objects (Steidel et al. 1999, Meurer et al. 1999). This corresponds to a factor 5 extinction on the rest–frame flux at 1600 Å.
(vi) Dust is present in high–redshift radiogalaxies and QSOs, up to (see e.g. Hughes et al. 1997, Cimatti et al. 1998b). The optical spectrum of a gravitationally–lensed galaxy at already shows a reddening factor amounting to (Soifer et al. 1998).
(vii) The correlation of dust with metallicity has still to be understood, since, for instance, the extremely metal–poor galaxy SBS0335-052 (1/30 of solar) has a significant IR emission (Thuan et al. 1999).
3. Spectral energy distributions of young galaxies
We hereafter present a model of synthetic SEDs, called stardust, which contains up–to–date spectrophotometric modelling coupled to chemical evolution and dust absorption. The model allows one to make consistent predictions for the SEDs of galaxies in a very broad wavelength range. Details can be found in Devriendt et al. (1999; hereafter DGS).

The model uses the so–called “isochrone scheme” and includes a compilation of the Geneva tracks (see e.g. Charbonnel et al. 1996, and references therein) for various metallicities , and masses 0.8 120. For stars less massive than , some of the old tracks stop at the Giant Branch tip. More recent grids of models, based on Geneva tracks and covering the evolution of low mass stars (0.8 to 1.7 ) from the Zero–Age Main Sequence up to the end of the Early–AGB, are included for 0.001 and 0.02. For the late stages of other metallicities (Horizontal Branch, Early–AGB), we either interpolate or extrapolate , and versus from the available tracks. The final stages of the stellar evolution (Thermally–Pulsing–AGB and Post–AGB) are not included. We use the grid of theoretical fluxes from Kurucz (1992) which covers all metallicities from to , and 61 temperatures from 3500 K to 50 000 K. Each spectrum spans a wavelength range between 90 and 160 m, with a mean resolution of 20 . For the coldest stars (K and M-type stars) with 3750 K, Kurucz’s models fail to reproduce the observed spectra. Therefore, we prefer to use models coming from different sources (see DGS).
Fig 1 gives the passive evolution of a Simple Stellar Population with Salpeter IMF (slope from to ). Fig 2 compares our stardust model with other models available in the literature (see DGS for details) : gissel 1998 (Bruzual and Charlot, 1993), pégase (Fioc and Rocca–Volmerange, 1997), and our stardust. Though the stellar data are different, the agreement is generally very good in the UV/visible, except when Post—AGB are dominant (that is, in old stellar populations without star formation activity). In particular, the UV to SFR ratio that is used to derive the cosmic SFR from rest–frame 1600 Å or 2800 Å observations is remarkably similar in the three models.

Our model computes chemical evolution and takes into account the effect of metallicity on the stellar tracks and stellar spectra in a consistent way. In addition, the metallicity of the gas is followed. Under simple assumptions on the variation of the extinction curve with metallicity (based on the study of the Milky Way, The Large Magellanic Cloud, and the Small Magellanic Cloud), and on the geometry and relative distributions of dust and stars (homogeneous mix in an oblate spheroid), transfer can be easily solved, and the amount of luminosity absorbed by dust is estimated. The SEDs in the IR/submm are then computed to reproduce the correlation of iras colours with total IR luminosity , following Guiderdoni et al. (1997, 1998). The model reproduces the obscuration curve of Calzetti et al. (1994) observed in a sample of nearby starbursts. It also reproduces the correlation of IR to 2200 Å flux with the UV slope of the SEDs (around 2200 Å) observed by Meurer et al. (1995).

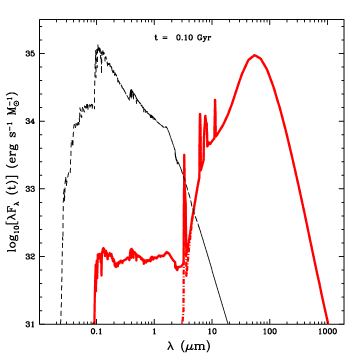
Finally, the optical and IR/submm spectra are connected to give evolving synthetic SEDs from the far UV (90 Å) to the submm ( mm). In the centimetre and metre range, a radio component can be added under assumptions on the slope and on the correlation of radio fluxes with IR fluxes. The SEDs depend on three parameters (in addition to the IMF) : the SFR timescale , the age , and a concentration parameter that describes the size of the gaseous disk ( is for normal spirals, and a radial collapse by a factor 10 corresponds to ). Fig 3 gives typical spectra for a spiral and a forming galaxy, without and with extinction (respectively with and , this latter value being typical of an ULIRG).
4. From local to high–redshift ULIRGs
Fig 4 gives the fits of a sample of local galaxies obtained with our theoretical SEDs and a procedure. The sample gathers Virgo Cluster spirals (Boselli et al. 1998) and ULIRGs (Rigopoulou et al. 1996) that have a sufficient number of photometric points at optical, NIR, MIR, FIR, and submm wavelengths (and, for some of them, in the radio). Nine spectra have been ordered in fig 4 according to their , in a sequence that parallels the compilation of Sanders & Mirabel (1996). There is some degeneracy between the parameters and of the fits, but their combination corresponds to similar SFRs. This is illustrative of the ability of the model to capture the characteristic features of the objects.
This can be used to study the efficiency of the UV and IR fluxes to trace the underlying SFR. As shown in fig 5, the UV fluxes do scale with SFR for optically–thin galaxies (slope ), but the proportionality breaks down for ULIRGs. Without any information on the optical thickness of the high–redshift galaxies, the rest–frame UV fluxes could lead to erroneous estimates. In contrast, the IR fluxes trace SFRs on several orders of magnitudes, with a slope 0.95, and independently of the optical thickness. The origin of this behaviour is not clear yet. It is probably due to the fact that there are basically two regimes : either the galaxy is optically thin, and the IR roughly corresponds to a constant fraction of the UV, or it is optically thick, and all the UV flux is absorbed by dust and released in the IR.

These galaxies can also be used to predict the photometric properties at higher redshift. Fig 6 and 7 give the observer–frame optical magnitudes and IR/submm fluxes versus redshift.

5. Semi–analytic and hybrid models of galaxy formation
These synthetic SEDs can subsequently be implemented into semi–analytic models of galaxy formation. The interest of such an approach is that the distribution of the SFR timescales can be computed from the distribution of dynamical timescales of the host haloes, under the assumption , where is an efficiency parameter which is fixed observationally (see e.g. Kennicutt 1998). The ages of the stellar populations are computed from the formation redshifts and the redshifts at which the galaxies are observed. The distribution of the gas column densities is also computed from the size distribution of disks (obtained from the size distribution of haloes after conservation of angular momentum). The ULIRGs correspond to a further radial collapse by a factor 10 ().
Following Guiderdoni et al. (1997, 1998), Devriendt & Guiderdoni (1999) proposed results of faint galaxy counts that are produced by a simple, semi–analytic prescription using the peaks formalism. The usual recipes are implemented for gas cooling, dissipative collapse, and stellar feedback. It is assumed that dust is heated by starbursts, and that the Star Formation Rate is , with . The spectra are taken from stardust. This paper gives predictions of faint counts at optical, IR, and submm wavelengths, for a variety of cosmologies. It turns out that the ionizing flux escaping from high–redshift galaxies estimated with this model is unable to ionize the intergalactic medium (Devriendt et al. 1998).
6. Conclusions and prospects
These synthetic SEDs and the spectral templates of fig 4 are useful tools to analyse the panchromatic view on high–redshift, young and “primeval” galaxies. The spectral templates are available upon request to the authors. The implementation of such spectra into semi–analytic models is a promising way to predict the statistical properties of a host of objects that are now observed at high redshift, through various spectral windows, and with various selection criteria.
However, the modelling of the SFR history of galaxies in the context of hierarchical galaxy formation is still incomplete. In particular, the ULIRGs appear to be key objects to understand the formation of bulges. A more realistic treatment of such objects requires the monitoring of the merging rates, and involves keeping track of the spatial and dynamical information in models of galaxy formation. This can be done, for instance, with the new generation of the so–called “hybrid” models in which the merging history trees are directly built from the outputs of cosmological N–body simulations. The implementation of stardust into such models is in progress.
References
Aussel, H., Cesarsky, C.J., Elbaz, D., Starck, J.L., 1999, A&A, 342, 313
Barger, A.J., Cowie, L.L., Sanders, D.B., Fulton, E., Taniguchi, Y., Sato, Y., Kawara, K., Okuda, H., 1998, Nature, 394, 248
Barger, A.J., Cowie, L.L., Sanders, D.B., 1999a, ApJ, 518, L5
Barger, A.J., Cowie, L.L., Smail, I., Ivison, R.J., Blain, W., Kneib, J.P., 1999b, AJ, 117, 2656
Boselli, A., Lequeux, J., Sauvage, M., Boulade, O., Boulanger, F., Cesarsky, D., Dupraz, C., Madden, S., Viallefond, F., Vigroux, L., 1998, A&A, 335, 53
Bruzual, A.G., Charlot, S., 1993, ApJ, 405, 538
Calzetti, D., Kinney, A.L., Storchi–Bergmann, T., 1994, ApJ, 429, 582
Charbonnel, C., Meynet, G., Maeder, A., Schaerer, D., 1996, A&AS, 115, 339
Cimatti, A., Andreani, P., Rottgering, H., Tilanus, R., 1998, Nature, 1998a, 392
Cimatti, A., Freudling, W., Rottgering, H., Ivison, R.J., Mazzei, P., 1998b, A&A, 329, 399
Devriendt, J.E.G., Sethi, S., Guiderdoni, B., Nath, B., 1998, MNRAS, 298, 708
Devriendt, J.E.G., Guiderdoni, B., Sadat, R., 1999, A&A, 350, 381
Devriendt, J.E.G., Guiderdoni, B., 1999, submitted
Eales, S., Lilly, S., Gear, W., Dunne, L., Bond, J.R., Hammer, F., Le Fèvre, O., Crampton, D., 1999, ApJ, 515, 518
Elbaz D., Aussel H., Cesarsky C.J., Desert F.X., Fadda D., Franceschini A., Harwit, M., Puget J.L., Starck J.L., 1999, in The Universe as seen by ISO, P. Cox & M.F. Kessler (eds), 1998, UNESCO, Paris, ESA Special Publications series (SP-427)
Fioc, M., Rocca–Volmerange, B., 1997, A&A, 326, 950
Fixsen, D.J., Dwek, E., Mather, J.C., Bennett, C.L., Shafer, R.A., 1998, ApJ, 508, 123
Flores, H., Hammer, F., Thuan, T.X., Cesarsky, C., Désert, F.X., Omont, A., Lilly, S.J., Eales, S., Crampton, D., Le Fèvre., O., 1999, ApJ, 517, 148
Guiderdoni, B., Bouchet, F.R., Puget, J.L., Lagache, G., Hivon, E., 1997, Nature, 390, 257
Guiderdoni, B., Hivon, E., Bouchet, F.R., Maffei, B., 1998, MNRAS, 295, 877
Hauser, M.G., Arendt, R., Kelsall, T., Dwek, E., Odegard, N., Welland, J., Freundenreich, H., Reach, W., Silverberg, R., Modeley, S., Pei, Y., Lubin, P., Mather, J., Shafer, R., Smoot, G., Weiss, R., Wilkinson, D., Wright, E., 1998, ApJ, 508, 25
Hughes, D., Dunlop, J.S., Rawlings, S., 1997, MNRAS, 289, 766
Hughes, D., Serjeant, S., Dunlop, J., Rowan–Robinson, M., Blain, A., Mann, R.G., Ivison, R., Peacock, J., Efstathiou, A., Gear, W., Oliver, S., Lawrence, A., Longair, M., Goldschmidt, P., Jenness, T., 1998, Nature, 394, 241
Kawara, K., Sato, Y., Matsuhara, H., Taniguchi, Y., Okuda, H., Sofue, Y., Matsumoto, T., Wakamatsu, K., Karoji, H., Okamura, S., Chambers, K.C., Cowie, L.L., Joseph, R.D., Sanders, D.B., 1998, A&A, 336, L9
Kennicutt, R.G., 1998, in Starbursts: Triggers, Nature and Evolution, B. Guiderdoni & A. Kembhavi (eds), EDP Sciences/Springer–Verlag
Kurucz, R., 1992, IAU Symposium 149, 225
Lagache, G., Abergel, A., Boulanger, F., Désert, F.X., Puget, J.L., 1999, A&A, 344, 322
Lilly, S.J., Eales, S.A., Gear, W.K.P., Hammer, F., Le Fèvre, O., Crampton, D., Bond, J.R., Dunne, L., 1999, ApJ, 518, 641
Meurer, G.R., Heckman, T.M., Leitherer, C., Kinney, A. Robert, C., Garnett, D.R., 1995, AJ, 110, 2665
Meurer, G.R., Heckman, T.M., Calzetti, D., 1999, ApJ, 521, 64
Puget, J.L., Abergel, A., Bernard, J.P., Boulanger, F., Burton, W.B., Désert, F.X., Hartmann, D., 1996, A&A, 308, L5
Puget, J.L., Lagache, G., Clements, D.L., Reach, W.T., Aussel, H., Bouchet, F.R., Cesarsky, C., Désert, F.X., Dole, H., Elbaz, D., Franceschini, A., Guiderdoni, B., Moorwood, A.F.M., 1999, A&A, 345, 29
Rigopoulou, D., Lawrence, A., Rowan–Robinson, M., 1996, MNRAS, 278, 1049
Smail, I., Ivison, R.J., Blain, A.W., 1997, ApJ, 490, L5
Smail, I., Ivison, R.J., Blain, A.W., Kneib, J.P., 1998, ApJ, 507, L21
Soifer, B.T., Neugebauer, G., Franx, M., Matthews, K., Illingworth, G.D., 1998, ApJ, 501, L171
Steidel, C.C., Adelberger, K.L., Giavalisco, M., Dickinson, M., Pettini, M., 1999, ApJ, 519, 1
Thuan, T.X., Sauvage, M., Madden, S., 1999, ApJ, 516, 783