Peculiar properties of 2 unusually X–ray bright early type galaxies
Abstract
Two X–ray bright early type galaxies, selected for their unusually high X–ray to optical flux ratio, have been observed at high spatial resolution with the ROSAT HRI. Both sources are clearly extended ( kpc in radius), thus excluding a nuclear origin of the high X–ray emission. A small group of galaxies observed around IC 1262 could be the most natural explanation for the high X–ray luminosity observed. NGC 6159 could be similarly explained, although there are to date no spectroscopic confirmations of a group of galaxies associated with it. The X–ray properties of these two sources are discussed in the context of the properties of groups of galaxies. A peculiar very bright feature, in the shape of an arc, is detected at the center of the IC 1262 image. This could be the signature of a recent merger, or of peculiar high velocities in the group.
1 Introduction
The mission has established that normal galaxies are X–ray sources with luminosities in the range from to erg s-1 (see Fabbiano 1989 for an overview). The ROSAT satellite has continued the investigation of the X–ray properties of these objects, and in particular has provided us with an X–ray selected, large sample of galaxies obtained from the ROSAT All Sky Survey (Voges 1992, Voges et al. 1999, RASS). The sample of 600 sources is obtained from the cross-correlation between the RASS source list and most of the major optical catalogs of galaxies, and includes objects to within 100′′ from a RASS source. This sample provides an excellent database for systematic investigations of the X–ray properties of galaxies, and in fact some work is well under way (Zimmermann et al., in preparation).
To study different aspects of the emission from galaxies, the database
has been sub-divided in subsamples. One of these deals with objects
peculiar in their higher than expected X–ray luminosity. It is
composed of very bright X–ray sources, with RASS count rates higher
than 0.1 cts/s. Care was taken to ensure that all reasonable
explanation for the higher than expected luminosity could be dismissed
( known active nuclei, clusters of galaxies, strongly interacting
systems were not included in the sample). This sample was the subject
of follow-up ROSAT observations to better investigate the nature of the
X–ray emission. While in most cases the new data has revealed the
presence of previously unknown nuclear activity (Pietsch et al. 1998),
several sources stand
out for their unexpected X–ray characteristics. In particular, the
two early type galaxies discussed here show extended X–ray emission.
While this is not surprising , since the hot gas in these
systems is at least coextensive with the stellar light and often
extends further out,
the X–ray to optical flux ratio (see
Tab. 1) of these two systems is about one order of
magnitude larger than in most other early-type galaxies studied that
also show very extended X–ray emission. Emission from a group is a
feasible explanation for IC 1262, the dominant object in a small group
of galaxies (Saglia et al. 1997, and references therein), and could
also apply to NGC 6159, around which several galaxies of similar
optical magnitudes have been identified (”Hypercat: The extragalactic
database111the on-line version is available at
http://www-obs.univ-lyon1.fr/hypercat/ and mirror
sites” and NED222The NASA/IPAC Extragalactic Database
(NED) is operated by the Jet Propulsion Laboratory, California
Institute of Technology, under contract with the National Aeronautics
and Space Administration. databases), although no redshift
confirmation is available yet.
| IC 1262 | Ref. | |
|---|---|---|
| Type | cD | 1 |
| Assumed distance | 206 Mpc | 2 |
| (hence 1 kpc) | ||
| Optical | R.A. 17h33m021 | 3 |
| position (2000.0) | Dec. 43°45′332 | |
| Galactic foreground NH | 2.5 cm-2 | 4 |
| Optical mag. (B) | 14.05 | 1 |
| X–ray flux | 8.5 | 5 |
| X–ray Lum. | 4.4 | 5 |
| 32.5 | ||
| RASS HR1; HR2 | 0.40; 0.09 | 5 |
| NGC 6159 | Ref. | |
| Type | S0- | 3 |
| Assumed distance | 188 Mpc | 6 |
| (hence 1 kpc) | ||
| Optical | R.A. 16h27m252 | 3 |
| position (2000.0) | Dec. 42°40′470 | |
| Galactic foreground NH | 1 cm-2 | 4 |
| Optical mag. (B) | 15.2 | 3 |
| X–ray flux | 1.7 | 5 |
| X–ray Lum. | 7.5 | 5 |
| 32.2 | ||
| RASS HR1; HR2 | 0.90; 0.40 | 5 |
References: (1) Saglia et al. 1997 ; (2) from the group distance, Wegner et al. 1996, 1999, assuming = 50 km s-1 Mpc-1 ; (3) from NED ; (4) Dickey & Lockman 1990 ; (5) Unabsorbed X–ray fluxes and luminosities in the 0.1-2 keV band in c.g.s. units; Hardness ratios HR1 and HR2 in two sets of bands, as defined in RASS; see text (6) LEDA database and Bischoff et al. 1999, assuming = 50 km s-1 Mpc-1
In the present paper we present a detailed study of the morphology of the X–ray emission of these sources and speculate on their nature.
2 Results of the ROSAT data analysis
Both sources were first observed in follow-up snap shot ROSAT HRI
observations of and ks for IC 1262 and NGC 6159
respectively. These were used to confirm the identifications and
establish the extended nature of the
sources but could not be used for a detailed study of the morphology of
the emission. Therefore 2 longer observations, of 26 and 56 ks
respectively were obtained in AO7 with the ROSAT HRI. A full
description of the ROSAT satellite and of the instrument can be found
in Trümper (1983), Trümper et al. (1991) and Zombeck et al. (1995).
The data analysis was done mostly with the xray package in
IRAF.
Figure 1 presents the isocontours of a smoothed X–ray image overlayed onto the Digitized Sky Survey plate333The Digitized Sky Survey was produced at the Space Telescope Science Institute (STScI) under U.S. Government grant NAG W-2166. for the two galaxies studied here.
To produce the X–ray map, we have first made a selection in the Pulse Height
Analyzer (PHA) channels. While the HRI does not have a full spectral
calibration, the data retain the information on the incoming PHA
channel, therefore a comparison between the spectral photon distribution of
the background and the source (in PHA space) is useful to eliminate
background-dominated channels and improve on the signal-to-noise.
However, care should be taken when the source is extended, since the
gain is not constant across the detector. This has the effect of
shifting the distribution of the photons, so that an estimate of the
background in a region of significantly different gain could be not
representative of the source region. Therefore the selection in PHA
channels should be such as to maximize the signal-to-noise ratio while
retaining a large enough range in PHA space so that gain changes across
the detector do not significantly affect the data analysis. In most
cases, excluding PHA channels 10 is enough to considerably reduce
the background contribution without introducing significant biases in
the local background estimation (see also the discussion on the HRI
background in “The ROSAT High Resolution Imager (HRI) Calibration
Report”444available on line at http://hea-www.harvard.edu/rosat/
rsdc_www/hricalrep.html). The
data in PHA space 1-10 have then been smoothed with Gaussian functions
for graphical display and for a visual understanding of possible
features in the data.
We have then determined the extension of the emission as a whole, and selected a region free of emission as the background. Since the background in the HRI is relatively flat across the detector, determining it in an annulus around the source and applying the resulting count rate to regions at smaller off-axis angles is a reasonable approximation. The radial distribution of the total emission indicates excess emission within radii r and r for IC 1262 and NGC 6159 respectively. We have therefore assumed a total extent of r=7′ and r=5′ respectively and estimated the background level in the adjacent annuli (7 and ). A more detailed analysis customized for each source was then followed, as described in the next two sections.
2.1 IC 1262

| Name | Net Counts | Error | Area | Sur. Brigh. | Error | Region |
|---|---|---|---|---|---|---|
| (arcsec2) | (cnt/arcsec2) | Description | ||||
| Arc | 644.74 | 28 | 2440 | 0.264 | 0.011 | Polygon surrounding |
| the high surface | ||||||
| brightness structure | ||||||
| N of arc | 40.64 | 8.5 | 384 | 0.106 | 0.022 | Polygon surrounding the |
| low surface brightness region | ||||||
| between the “arms” of the arc | ||||||
| PS | 69.33 | 10 | 312 | 0.222 | 0.03 | 10′′ radius circle |
| Southern tail | 234.4 | 18 | 2076 | 0.1228 | 0.0087 | Narrow 24 |
| box aligned with the | ||||||
| extension to the S | ||||||
| Inner 1′ | 893.37 | 35.6 | 8172 | 0.109 | 0.004 | 1′ radius circle with the |
| exclusion of all previous | ||||||
| regions centered at | ||||||
| 17h33m02.6s 43°45′552 | ||||||
| 1 Annulus | 1013.81 | 43 | 20112 | 0.050 | 0.002 | Adjacent concentric annulus |
| with the exclusion of | ||||||
| all previous regions | ||||||
Notes:
Net counts above the average field background estimated in the 7
annulus around the source (see text).
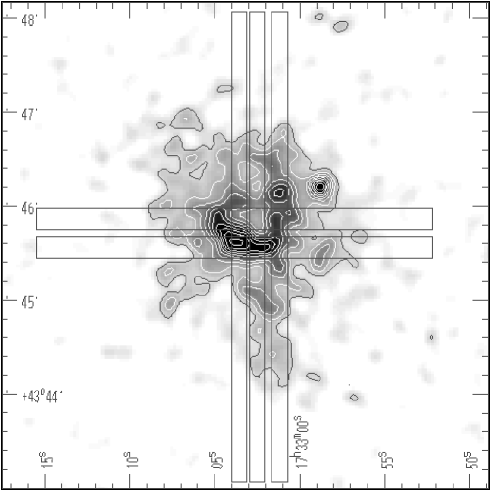
We have looked in more detail at the morphology of the X–ray image of IC 1262 and at how it compares to the optical image. In Fig. 2, the smaller smoothing function applied to the data shows more clearly the complexity of the source. A point-like source is visible to the NW, centered onto a faint optical counterpart, most likely an interloper. A large fraction of the rest of the photons is located in an arc-like structure, peaked to the east of the galaxy, just to the north of another optical source.
We have tried to evaluate the significance of these structures. We have defined regions (like the enhanced emission in the arc-like structure, the point-like source to the NW, the tail to the S) and compared the net counts there to those of the region immediately N of it, and to the surrounding area. Tab. 2 summarizes the results.
As can be seen from the table, the arc-feature has a significantly higher surface brightness than the surrounding emission. The region just north of the arc, and surrounded by it, is consistent with the average residual emission in the inner 1′ radius circle, and higher than the external adjacent annulus. If we assume the average surface brightness in the inner 1′ circle outside the arc as a reasonable estimate of the local background, there are excess counts in the arc. These can further be divided into a higher and a lower surface brightness region, with a factor of in surface brightness contrast (see also Fig. 4 and Fig. 5). The peak of the arc is to the East of the galaxy, just north of a separate optical object visible on the plate. We will discuss the possible relation between this optical source and the arc feature later. The southern extension, also clearly visible in Fig. 1, represents a significant excess over the average surface brightness in the 1 annulus. It can also be further separated in a higher and lower surface brightness regions, with again a factor of contrast, that makes it a significant enhancement over the average emission in the 1′ radius circle.

The reality of the structures are also illustrated by the plots of the photon distributions along different projections in narrow boxes aligned with the different structures (Fig. 4 and Fig. 5). The positions of these boxes are superposed onto the X–ray contours in Fig. 3 for easy reference.
In Fig. 4, projections along the two boxes oriented E-W, and aligned with the high surface brightness in the arc (labeled “on Peak” in the figure) and with the “hole” north of the arc, are compared. In the central from the box center, a significant contrast in surface brightness is evident. The projection along the arc (E to W, filled symbols) shows a fast rise onto a single peak, followed by a somewhat shallower decline. The projection in the box North of it (open symbols) clearly marks the crossing of the two arms of the arc (at and from the box center), and shows significantly lower emission in between. In both profiles a relatively smooth surface brightness profiles is apparent outside of offset.
Figure 5 also indicates a rather complex photon distribution. The Easternmost box shows a pronounced peak and a relatively sharp fall off of the surface brightness steeper to the south than to the north of it, in accordance with the presence of an extension of the arc to the N. The projection in the central panel indicates a relatively flat plateau long, with a very high peak in the middle corresponding to the intersection with the arc. No sharp peak is visible in the projection along the Westernmost box, and a shallow increase in surface brightness visible from roughly (the “tail”) is followed by a flatter distribution to (the western arm of the arc with the secondary peak), and a faster decline outside.
At larger radii, the emission appears smoother and relatively symmetric, although a significant modulation in the azimuthal photon distribution can be clearly seen in the plot of Fig. 6. This points to an extension to the S-SW, and a possible compression of the emission in the NNE sector. Therefore, an azimuthally averaged radial profile, that fails to represent the data at small radii, is a rather poor representation of the true radial distribution even at larger radii.

We have nonetheless produced the azimuthally averaged profile of Fig. 7 for comparison with other groups. The structure at the center (the arc, see Tab. 2) has been either included or taken out from the profile. We therefore expect that the surface brightness of the “unperturbed” component in the innermost bins (of 20′′ radius each) is between the two profiles. We have tried to parameterize the emission with a “King-type” profile generally a good representation of the data, excluding the innermost , where the arc structure confuses matters. Mulchaey & Zabludoff (1998) have parameterized the data for several nearby groups with a combination of 2 “King-type” models. If we assume their best fit , we find that a model with r and r and reproduces the azimuthally averaged data reasonably well (see Fig. 7 ). A =0.8 would require core radii r and r. However, a single “King” model with =0.5 and r gives an equivalently good representation of the azimuthal profile outside (see Fig. 7 ).
2.2 NGC 6159
Figure 1 (right panel) shows the X–ray isointensity contours of the inner part of the NGC 6159 field overlayed onto the Palomar DSS. The figure shows a relatively regular, extended emission centered onto the optical galaxy, and four separate sources to the N and to the W of it. All of these sources are coincident with optical counterparts, one with a bright star and the other three with fainter point-like objects (see appendix). This ensures that the absolute coordinate positions are correct.

With different smoothing functions applied to the data, we have searched for substructures in the morphology, of the same kind as those in IC 1262. Within the present data, no significant substructures at small radii are detected. As shown by Fig. 1, however, the source does not appear azimuthally symmetric. To assess the significance of the visual impression, we have derived the radial profile in 3 angular sectors (see Fig. 8). Outside , the emission is distributed differently at different angles: it appears to be stronger and less extended in the NW region (), and more extended to the SW (). As for IC 1262, the azimuthally averaged profile therefore only approximates the photon radial distribution. Nonetheless, we have compared it with “King-type” model(s). For this galaxy we cannot find a set of core radius and to represent the whole profile, and at least 2 models are required, albeit with very poor constraints on the parameter space: core radii of r and r and plus the field background are used to draw the solid line in Fig. 8. However, a combination of r, , and r and also represent the data equally well (dotted line in Fig. 8).
2.3 Fluxes and Luminosities
Table 1 summarizes the optical and X–ray data for the two galaxies discussed here. No reliable spectral information can be obtained from the HRI data to convert from observed count rates to X–ray fluxes. However, we can use the spectral information contained in the ROSAT PSPC survey data. Two hardness ratios are derived for each RASS source, defined as the ratio of the counts in different energy bands within the ROSAT band: HR1 = (h–s)/(h+s) and HR2 = (h2–h1)/(h2+h1); where “h” is the 0.5–2.0 keV band, “s” =0.1–0.4 keV, “h1”= 0.5–0.9 keV and “h2” = 0.9–2.0 keV. While these ratios cannot distinguish between models, they can be used to estimate crude spectral parameters within a given spectral model. Fig. 1 in Pietsch, Trinchieri and Vogler (1998) shows the distribution of hardness ratios for different models, as temperatures (or power law indexes) and low energy absorptions vary within reasonable values. In the framework of a thin plasma model, that is used for the average spectrum of high X–ray luminosity early type galaxies or small groups, the HR1 and HR2 of either galaxies are consistent with low absorption and a temperature of 1-2 keV. We have therefore adopted a 1 keV temperature, and the line-of-sight column density for the counts to flux conversion. We also note that in the relatively narrow ROSAT band the conversion factors are not very sensitive to the models assumed, provided that the low energy absorption is known and/or small. Large amounts of unaccounted for absorption could cause drastic underestimates of the emitted flux.
Total fluxes and luminosities ( within a radius of and 5′ for IC 1262 and NGC 6159 respectively) are given in Table 1. Luminosities for the single components of IC 1262 can be rescaled from the net counts listed in Tab. 2, using a conversion factor of 100 counts = 1.3 erg cm-2 s-1, appropriate for the 1 keV plasma spectrum and line-of-sight Galactic absorption.
The arc in IC 1262 is also a very bright source of emission. If we consider it as a local enhancement, above the average surface brightness in the 1′ radius inner circle, it has a luminosity L erg s-1, for the same assumption of spectral parameters. If we include the tail, the luminosity of the whole structure is L erg s-1.
3 Discussion
The X–ray luminosities of both galaxies are significantly higher than 1042 erg s-1, indicating intrinsically bright sources, and their ratios are also high (see Table 1), in particular if compared to values for normal galaxies (Fabbiano, Kim and Trinchieri 1992; Beuing et al. 1999). Their X–ray luminosities are instead comparable to those of optically or X-ray selected groups of galaxies (Mulchaey et al. 1996; Ponman et al. 1996; Burns et al. 1996; Mahadavi et al. 1997 and references therein).
The presence of a group of mostly early type galaxies around IC 1262 (Wegner et al. 1996) indeed indicates that the X–ray emission should be associated with the potential of the group rather than with that of the galaxy only. The total extent, kpc in radius, also suggests a much larger potential than usually associated with galaxies. The complex morphology at the center, however, is probably related to the central galaxy (see § 4).
The optical spectrum of NGC 6159 indicates a Sey2/Liner nuclear source (Bischoff et al. 1999). However, the X-ray source is clearly extended, with no indication of a central point source embedded in a more extended component. Therefore, we do not expect an association between the X–ray emission and the galaxy’s nucleus. There is at the present time no confirmation that a group exists around NGC 6159. However, Ramella et al. (1997) have identified several groups in the area (within a few degrees from NGC 6159) in a very large structure at the same average redshift (see data in the Huchra CfA Redshift Catalog available on line at http://heasarc.gsfc.nasa.gov). Although NGC 6159 itself does not have an entry in the catalog, and the only velocities available for galaxies within 1∘ radius are significantly higher, there are 7 galaxies degree south of it with measured velocities in the range 8200-9600 km s-1 and 27 within 2 degrees with v km s-1 (for comparison, NGC 6159 has a velocity of = 9480150, Bischoff et al. 1999; or = 9380.0, Huchra et al. 1983). Since there are several fainter galaxies close to NGC 6159 on the sky, for which no redshift information is available, we cannot exclude that NGC 6159 resides in a rich, though loose, environment.
The extent of the emission ( kpc in radius) suggests the presence of a local condensation of matter, since it is a signature of a larger potential than expected from a single galaxy. Vikhlinin et al. (1999) have recently suggested that a new class of objects exists, namely the Over-Luminous Early type Galaxies (OLEG), large dark mass concentrations associated with a single isolated early-type galaxy, that can be discovered through the high X–ray luminosity and X–ray-to-optical flux ratio. Equivalently, “failed groups” or merger remnants could be discovered from their extended X–ray halos associated with a galaxy with optical properties that would not qualify it as a “group” (NGC 1132 is an example, Mulchaey & Zabludoff 1999). While NGC 6159 shares some of the properties of these systems (high X–ray luminosity relative to the optical luminosity, large extent, apparent isolation), these are not as extreme as those of OLEGs, and NGC 6159’s apparent isolation is not confirmed by a thorough optical study as in the case of NGC 1132. We therefore will assume that the high X–ray luminosity and extent of this system are due to the presence of a poor group of galaxies.
We can distinguish three main components contributing to the emission in IC 1262: an extended component, a point-like source not at the galaxy’s nucleus, and a complex central structure. Only the first component is detected in NGC 6159.
3.1 Emission from a group of galaxies
X–ray observations of several compact and poor groups have already shown the presence of extended emission in these systems, associated with a hot intergalactic medium with typical temperatures of 1-2 keV, luminosities up to erg s-1 and total gas content comparable to or lower than that in the luminous mass (see Mulchaey et al. 1996; Ponman et al. 1996, Burns et al. 1996; Mahadavi et al. 1997 and references therein).
As already discussed, both the X–ray luminosities and the dimensions of these systems are appropriate for groups. The gas density and mass are also consistent with those of similar systems. Assuming a simple spherical geometry to the hot gas distribution, and a temperature of 1 keV (hence a cooling coefficient = , Raymond et al. 1976, see Nulsen et al. 1984), the average gas density for IC 1262 is ne , and the total gas mass M 3 M⊙, calculated from the luminosity of the whole source (within a radius of kpc) with the exclusion of the contributions from the interlopers and the arc feature. For NGC 6159, the average ne , and the total gas mass M 7 M⊙ within a 250 kpc radius.
A recent careful analysis of the morphology of several nearby groups (Mulchaey & Zabludoff 1998) has shown that, in most cases, the extended X–ray sources associated with them can be modeled with two King-type functions, with and different size core radii. Mulchaey & Zabludoff propose that the smaller core radius model is associated with the galaxy that is found at the center of the emission.
As shown in the previous sections, the data for these two sources also indicate that a single King model does not parameterize well the full range of the radial photon distribution, but that a combination of models could be used for this purpose. In spite of the higher resolution of the HRI data and of the good statistics in both observations, however, the parameters are not well constrained, and, moreover, they do not indicate the presence of a component with core radii significantly smaller than those found by Mulchaey & Zabludoff. For NGC 6159, the inner core radius is of 10-20 kpc (depending on the parameter assumed) consistent with the values in Mulchaey & Zabludoff (we have rescaled their values to our choice of ). The linear size of the smaller core radius of IC 1262 is significantly larger than typically found in nearby systems (40-90 kpc, depending on the assumed ). This could be interpreted as the ”larger” of the two Kings, since we could not probe the innermost regions. However, this would imply the presence of an even larger, King model if =1. While we stress that we have not tried to obtain a “best fit model” for these data (therefore a large range of parameter space is still unexplored), Fig. 7 and Fig. 8 show that these are reasonable parameterizations of the data. We therefore are led to conclude that we need a relatively large “central” model, larger than high resolution data of nearby systems suggest ( kpc, Trinchieri et al. 1986, 1997b; Thomas 1986; Dahlem & Stuhrmann 1998). This could be due to the fact that there systems are farther away than most galaxies probed so far (3 kpc would be at the distance of these galaxies). But this also suggests that the group’s potential could itself be composed of two components, neither of which is associated with the central galaxy. The presence of the arc in IC 1262 prevents us from exploring the profile at very small radii, however even a 20 kpc core radius would not fit the data outside , for these choices of .
3.2 The Point Source in IC 1262
The point-like source to the NW of IC 1262 (Fig. 2) is most likely due to an interloper, clearly visible in the optical images. Although no spectral information is available for it, it appears to be point-like also in red-band images, with a magnitude m (Saglia, private communication). We can therefore estimate an X–ray-to-optical flux ratio, that can be compared to that of stars or of AGNs. If this is an AGN, we expect V-R of 0 to 0.8 (Cristiani & Vio 1990), therefore log(fx/fv) - marginally consistent with the AGN population (see nomogram in Maccacaro et al. 1988). However, a star of K - M type could also be the optical counterpart of this X–ray source; with average V-R colors of 0.8-1.1 (Allen 1973), log(fx/fv) , consistent with stellar colors (Maccacaro et al. 1988). Spectral data are needed to properly identify this source.
4 The complex feature in IC 1262
The presence of an additional feature, in the form of an arc and of a tail, at the center of the IC 1262 source, is a peculiarity of the X–ray emission from this galaxy. It represents a significant enhancement over the immediate surrounding and it is most likely evidence of shocked material, linked to the galaxy and/or the group.
The comparison between the X–ray morphology and the optical image (Fig. 2), however, indicates a significant off-set between the peak of the X-ray emission and IC 1262 (), and could further suggest an association with a red magnitude point-like object (Saglia, private communication), located just south () of the X–ray peak. Although no redshift is available, it is unlikely that this object is a group member, and therefore this association provides no immediate explanation of this feature, since its motion should not produce any structure in the hot gas distribution. On the other hand, the object itself could be an X–ray source. In this case, if it is an AGN or a late type star of the same kind as that associated with the point source to the NW of the arc discussed above, we can expect counts (see Table 2) from this source, that would appear superposed on the X–ray feature. This additional but unrelated emission would then modify the morphology of the source associated with the galaxy, which could either be flatter or have a less prominent peak close to the galaxy. Moreover, if the arc is the result of shocked material, inhomogeneities in the ambient medium could cause enhanced emission where densities are higher. We will therefore disregard the offset position of the peak relative to the galaxy, and assume that the whole feature is associated with IC 1262 and/or the group, and discuss the X–ray properties and possible origins of the shock in this context.
An estimate of the density in the arc is in principle straightforward from X–ray data, but is in fact quite uncertain due to a) the unknown temperature and more important b) the unknown volumes of the structures. While the average density in the whole source derived in the previous section can rely on the approximation to spherical symmetry for the volume occupied by the gas, the third dimension in the arc-structure is almost completely arbitrary. For the sake of argument, we have here assumed two possible morphologies: 1) a narrow and long feature, with a 30′′ (30 kpc) cross section diameter and a 100′′ (100 kpc) length, and 2) a thick slab 30′′ height and 100′′ long and deep. We have further assumed that the feature has a plasma-like spectrum, with an average temperature of 1 keV (the density is very weakly dependent on T, and therefore the uncertainty in the temperature is not so crucial to the final values). If this is the result of a shock, this assumption could be wrong, since no equilibrium situation can be expected at the site of the shock. On the other hand, collisional equilibrium could be a reasonable approximation if the timescale is long enough (see later); moreover, with this assumption we can obtain a rough estimate of the quantities involved, like gas mass and density, for a very crude understanding of the feasibility of the scenario. We find that the average gas density in the arc is n (case 1 and 2 respectively), up to a factor of higher than in the surrounding 1′ (60 kpc) radius region (calculated from the average surface brightness derived in Tab. 2 and applied to the area within 1′ radius), and higher than the average density in the whole source. The associated gas mass would be M⊙.
The cooling time of the gas with these average densities is yr, which is long enough for the structure to be reasonably stable, and also consistent with the hypothesis that it is produced by the galaxy’s motion in the medium. The projected half length of the structure is kpc. To travel such a distance in years, the galaxy needs only a velocity of km s-1.
With equivalent reasoning, we can estimate the density and gas mass in the tail extending to the south. The projected size is kpc, and we assume again the third dimension to be either of them. The gas density ranges from n, which again represent a factor of higher densities than in the immediate surrounding (the region between 30 and 100 kpc radii).
If the arc is produced by the galaxy’s motion relative to the ambient medium, velocities to km s-1 are needed in order to produce a shock, since the emission is in the X–ray regime, and the ambient medium is itself hot ( keV, by analogy with other groups’ temperatures). We have no evidence that this galaxy is traveling at such high speed in the group. Wegner et al. (1999) report the spectroscopic data relative to the brighter early-type galaxies in this group. The group is at a mean velocity of 10311 km/s with an estimated dispersion of 300 km/s, based on the early type population of 5 objects. IC 1262 has the lowest velocity measured in the group, with km s-1 from the systemic velocity. This is at odds with its classification as a cD galaxy, since cD galaxies are almost always associated with the systemic velocity in groups (Zabludoff & Mulchaey 1998), although there are exceptions in richer clusters (Zabludoff et al. 1990). Although caution is in order, since the velocity space is very poorly sampled in this group, it is possible that, if the tangential component to the velocity is also large, the motion of IC 1262 could produce a significant ram pressure onto the ambient medium to explain the feature.
We can actually estimate the velocity that IC 1262 needs to produce the density contrast derived above. A shock of arbitrary strength will be produced by
where 1 and 2 indicate the upstream and downstream quantities respectively, and , for a monoatomic gas, and the density contrast is 1/2. As discussed above, this is very high compared to the group’s velocity dispersion, as currently measured, and to the velocity of the galaxy relative to the group’s mean.
The arc could also be interpreted as the signature of a recent merger process, that has produced a shock between the two colliding structures. The formation of groups and clusters is thought to go through subsequent infalls and/or merging of external material onto an initial, dense core (see Peebles 1980). Shock heating should play an important role in the dynamics and evolution of clusters and their intergalactic medium. Numerical simulations have shown a variety of structures, X-ray luminosity enhancements and complex electron-temperature distributions as a result of the collision/merging events (Evrard 1990; Roettiger et al. 1993; Schindler & Müller 1993; Ricker 1998; and references therein). The evidence of a large reservoir of hot gas in this system and its relatively regular morphology suggest that this group has not formed too recently, since the gas has had time to virialize. On the other hand, merger events could be happening at any moment in the group’s evolution. The merger scenario would have the advantage that the velocity of each individual colliding structure does not need to be so extreme; however, there is at the present time no evidence of merging activity in this system. Detailed optical studies of the field, coupled with a better understanding of the hot gas dynamics, would be needed to obtain independent evidence of a recent merger.
4.1 Shocks in groups.
X–ray observations of groups have provided very limited evidence of shocks, although the X–ray morphologies of a few galaxies in them clearly point to some interaction with the surrounding medium. Most of the evidence is in the form of clear tails and/or distorted envelopes (for example M86, Forman et al. 1979, Rangarajan et al. 1995; NGC 7619, Trinchieri et al. 1997a; NGC 4472, Irwin & Sarazin 1996; NGC 5044, David et al. 1994), that have been interpreted as wakes from the ram pressure (partial) stripping as the galaxies move in the dense medium. The emission associated with IC 1262 would instead trace the bow-shock, but unlike NGC 4472 (Irwin & Sarazin 1996), without any visible tail behind the shock.
A feature with a possibly more similar morphology to the arc in IC 1262 was found in Stephan’s Quintet, where a narrow (although unbent) X-ray source is observed between two member galaxies (NGC 7319 and NGC 7318b), coincident with radio continuum and H/[NII] emission (van der Hulst & Rots 1981, Moles et al. 1997), and interpreted as the result of shock-heated material in the complex dynamics of the system (Pietsch et al. 1997, Sulentic 1999).
However, the characteristics of both the two systems and the two shocks are rather different. Stephan’s Quintet is a spiral-rich compact group, displays strong signs of interaction at many wavelengths, and there is no compelling evidence of a significant amount of hot, intergalactic medium, although current limits need to be refined with more sensitive X–ray observations (see Pietsch et al. 1997). The X–ray source is a clearly defined, intragalaxy structure that dominates the emission from the group, although the luminosity associated with it is not as high as in IC 1262 (L erg s-1). IC 1262 is in contrast composed of mostly early type galaxies, has a smaller velocity dispersion, no evidence (up to now!) of recent intruders, but contains a large amount of hot intergalactic medium. The arc has a high X–ray luminosity, but does not dominate the emission from the system, and in fact represents a relatively minor perturbation in the diffuse hot gas emission of the group. However, these examples point to the necessity of a detailed analysis of the morphology of the X-ray emission in groups of galaxies, even in those with a clear, extended hot gas component, in order to fully understand the characteristics of the gas in the gravitational potential and to properly assess its contribution and the presence of perturbations that might otherwise go undetected. A more comprehensive assessment of the information provided by the intergalactic medium is crucial for a proper understanding of the formation and evolution of groups of galaxies.
5 Conclusions
We have presented high spatial resolution X–ray data of two galaxies unusual in their higher than expected X–ray emission relative to the optical brightness. It is likely that the emission detected is due to small groups of galaxies that appear to be associated with the primary optical identification. Redshift information confirms in fact the existence of a small group of early type galaxies around IC 1262. The reality of a group around NGC 6159 is also likely, but needs spectroscopic confirmation.
The emission appears irregular and not azimuthally symmetric at large radii. However, fits to the azimuthally averaged surface brightness profiles are possible, and suggest the presence of two X–ray components. In spite of the high spatial resolution of the X–ray data, we do not find evidence of a small central component similar to those observed in high resolution images of more nearby objects. While failure to detect this could be due to the large distances of these systems, the radial profiles of these objects could suggest a complex shape of the group’s potential.
We found a peculiar feature in the X–ray emission of IC 1262, in the form of an arc, probably the result of shocked material either caused by peculiar motions within the group’s potential, or resulting from a recent merger event. To our knowledge, this is the first such feature observed in a poor group of mostly early-type galaxies. A confirmation of the proposed interpretation for the peculiar structure would come from the study of the temperature distribution of the group’s gas, which should be hotter in the arc than in the surrounding region. Unfortunately, no temperature information can be derived from the HRI data.
Appendix A Other X–ray sources in the IC 1262 and NGC 6159 fields
| ROSAT name | X–ray position | Net | X–ray | Identification | X-O | Notes |
| (RX J) | (2000.0) | counts | flux | (″) | ||
| (1) | (2) | (3) | (4) | (5) | (6) | (7) |
| IC 1262 field | ||||||
| 173222.2+433949 | 17:32:22.2 43:39:49.1 | 24918 | 3.9 | U1275_09527890 | 1 | |
| 173258.7+434613 | 17:32:58.7 43:46:13.5 | 13614 | 2.1 | U1275_09534024 | 1 | |
| 173334.0+434757 | 17:33:34.0 43:47:57.2 | 15415 | 2.4 | U1275_09539872 | 1 | |
| U1275_09539788 | 1 | |||||
| NGC 6159 field | ||||||
| 162658.2+424449 | 16:26:59.2 42:44:49.3 | 4912 | 3.0 | U1275_09047679 | 1 | |
| 162711.3+424111 | 16:27:11.3 42:41:11.5 | 5412 | 3.3 | U1275_09048889 | 1 | |
| U1275_09048880 | 1 | |||||
| GSC 0306901509 | 2 | |||||
| 162713.8+424142 | 16:27:13.8 42:41:42.7 | 6113 | 3.8 | U1275_09049154 | 1 | |
| (162736.4+424455 | 16:27:36.4 42:44:55.2 | 5413 | 3.3 | U1275_09051638 | 1) | |
Notes:
unabsorbed fluxes are in the 0.1–2.0 keV band, and are derived from the HRI count rates,
assuming a 5 keV thermal bremsstrahlung spectrum and line-of-sight
for Galactic absorption
(1) Identified with a source in the ESO/ST-ECF USNO-A1.0
(2) Identified with a source in the Guide Star catalog
Four point-like sources are detected around NGC 6159 and two sources around IC 1262 in these HRI observations. An additional one is clearly visible close to IC 1262 (see Fig. 2). Table 3 shows their characteristics. For each X–ray source in the field, we list the closest optical candidate(s) from either the USNO catalog or the Guide Star Catalog (obtained from searches in the Online USNO-A1.0 Catalogue Server and HST Guide Star Catalogue (GSC) Server at the ESO/ST-ECF Archive). The next optical candidate is away from the X–ray source. As clearly visible, the mean offset of the X–ray and optical positions (listed in col. 6 of Table 3) is very small, which ensures that our absolute coordinate system for the X–ray images are accurate. The closest optical counterpart to source RXJ162736.4+424455 is at 12′′. Since this X-O is significantly larger than all others, the optical source might not be the correct identification for the X–ray source. Most of the sources are very faint and have no other identification in published catalogs.
Acknowledgements.
This work has received partial financial support from the Italian Space Agency. We thank the referee, Dr. J. Bregman, Dr. Piero Rosati for a careful reading of the manuscript and Dr. Dieter Breitschwerdt for his patience in discussing shocks. GT thanks Prof. Trümper and the MPE for hospitality while part of this work was done. Dr. Roberto Saglia kindly provided us with useful information prior and beyond publication. This research has made use of the NASA/IPAC Extragalactic Database (NED) which is operated by the Jet Propulsion Laboratory, California Institute of Technology, under contract with the National Aeronautics and Space Administration.References
- (1) Allen, C.W. 1973 Astrophysical quantities, University of London, Athlone Press
- (2) Beuing, J., Döbereiner, S., Böhringer, H., Bender, R. 1999, MNRAS 209, 221
- (3) Bischoff K., Pietsch, W., Boller, T., Döbereiner, S. Kollatschny, W., Zimmermann, H.-U. 1999 Highlights in X-ray Astronomy, Aschenbach et al. (eds.), in press
- (4) Burns, J.O., Ledlow, M.J., Locken, C., et al. 1996, ApJl 467, L49.
- (5) Cristiani S. & Vio, 1990, AA, 227, 385
- (6) Dahlem, M., Stuhrmann, N. 1998 AA, 332, 449
- (7) David, L. P., Jones, C., Forman, W., Daines, S. 1994, ApJ 428, 544
- (8) Dickey, J.M., & Lockman, F.J. 1990, Ann. Rev. Ast. Astr. 28, 215.
- (9) Evrard, A., 1990, Clusters of Galaxies, Fitchett,M., and Oegerle, P. eds
- (10) Fabbiano, G. 1989, Ann. Rev. Astron. Ap., 27, 87.
- (11) Fabbiano, G., Kim, D-W., Trinchieri, G. 1992 ApJS 80, 645
- (12) Forman, W., Schwarz, J., Jones, C., Liller, W., Fabian, A. 1979 ApJ 234, L27
- (13) Huchra J., Davis M., Tonry J., Latham D. 1983, ApJS 52, 89
- (14) Irwin, J.A., Sarazin, C.L. 1996 ApJ 471, 683
- (15) Maccacaro, T. et al. (1988): ApJ 326, 680
- (16) Mahadavi, A., Böhringer, H., Geller, M.J, Ramella, M. 1997 ApJ 483, 68.
- (17) Moles, M., Sulentic, J.W., Marquez, I. 1997, ApJ, 485, L69
- (18) Mulchaey, J.S., Davis, D. S., Mushotzky, R. F., Burstein, D. 1996, ApJL 457 L19
- (19) Mulchaey, J.S. & Zabludoff, A.I. 1998, ApJ 496, 73
- (20) Mulchaey, J.S. & Zabludoff, A.I. 1999 ApJ 514 133
- (21) Nulsen P.E.J., Stewart G.C., Fabian A.C., 1984, MNRAS 208, 185
- (22) Peebles, P.J.E. 1980, The large scale structure of the Universe, Princeton Univ. Press.
- (23) Pietsch, W., Trinchieri, G., Arp, H., Sulentic, J.W. 1997, AA 322, 89
- (24) Pietsch, W., Bischoff, K., Boller, Th., Döbereiner, S., Kollatschny, W., Zimmermann, H.-U. 1998, AA 333,48
- (25) Pietsch, W., Trinchieri, G., Vogler, A. 1998 AA 340, 351
- (26) Ponman T.J., et al., 1996, MNRAS 283, 690
- (27) Raymond J.C., Cox D.P., Smith B.W., 1976, ApJ 204, 290
- (28) Ramella, M., Pisani, A., Geller, M.J. 1997 AJ 113, 483
- (29) Rangarajan, F.V.N., White, D.A., Ebeling, H., Fabian, A.C. 1995 MNRAS 277 1047
- (30) Ricker, P.M. 1998 ApJ 496, 670
- (31) Roettiger, K., Burns, J., Locken, C. 1993, ApJ 407, L53
- (32) Saglia, R. P., Burstein, D., Baggley, G., et al. 1997 MNRAS 292, 499
- (33) Schindler, S. & Müller 1993, AA 272, 137.
- (34) Sulentic, J. 1999, Small galaxy groups, ASP Conference Series, M. Valtonen and C. Flynn eds. in press
- (35) Thomas, P.A. 1986, MNRAS 220, 949.
- (36) Trinchieri, G., Fabbiano, G., Canizares, C. R. C. 1986, ApJ 310, 637
- (37) Trinchieri, G., Fabbiano, G., Kim, D-W. 1997a, AA 318 361
- (38) Trinchieri, G., Noris, L., Diserego Alighieri, S. 1997b, AA 326 565
- (39) Trümper, J. 1983. Adv. Space Res. Vol. 2 No. 4, 241
- (40) Trümper, J., Hasinger G., Aschenbach B., et al. 1991, Nature 349, 579.
- (41) van der Hulst J.M., Rots A.H., 1981, AJ 86, 1775
- (42) Vikhlinin, A., McNamara, B.R., Hornstrup, A., Quintana, H, Forman, W., Jones, C., Way, M. 1999, 520, L1
- (43) Voges, W. 1992 Proc. European IST Meeting Symposium, p. 9
- (44) Voges, W., Aschenbach, B., Boller, Th., et al. 1999, AA, in press
- (45) Xu, C., Sulentic, J.W., Tuffs, R. 1999, ApJ 512, 178
- (46) Wegner, G., Colless, M., Baggley, G., et al. 1996, ApJS, 106, 1
- (47) Wegner, G., Colless, M., Saglia, R.P., et al. 1999, MNRAS 305 259
- (48) Zabludoff, A.I., Huchra, J.P., Geller, M.J. 1990, ApJS 74 1
- (49) Zabludoff, A.I. & Mulchaey, J.S. 1998, ApJ 496, 39
- (50) Zombeck, M.V., David, L., Harnden, F.R., Kearns, K. 1995 Proc. SPIE 2518, 304.