The ALFA Laser Guide Star: Operation & Results
Abstract
The importance of laser guide stars to the practical usefulness of adaptive optics cannot be understated, and yet there are very few working systems. This contribution discusses the current status of the ALFA laser guide star, with regard to the particular difficulties encountered while observing as well as both the expected performance and that so far achieved from scientific observations. A description is given of a number of experiments involving ALFA which aim to determine the atmospheric turbulence and sodium layer charateristics, and demonstrate the possibility for tilt recovery from laser guide stars.
keywords:
adaptive optics, laser guide star, atmospheric turbulence, sodium profile, Herbig Ae/Be stars, Abell Galaxy Clusters1 Introduction
The resolution and sensitivity that should be achievable with the current generation of 8-m class telescopes which are either on-line or being built, has the potential to revolutionise astrophysics. But in order to reap these benefits it is essential to use adaptive optics techniques, and with the requirement for maximal sky coverage comes the mandatory use of laser guide stars.
Over recent years there has been an increasing effort put into the development of high-order AO instrumentation, as well as observational programmes: the number of refereed papers based on AO has been increasing dramatically (27 in 1997 compared to only 18 in the entire 4 years prior to that, \openciterid98), and recently an entire meeting was devoted to scientific results using adaptive optics systems (Astronomy with Adaptive Optics, ESO 1998). However, this also highlighted the fact that nearly all observations to date have used natural guide stars almost exclusively as the wavefront reference. This has resulted in the majority of results being concerned with stellar systems, while relatively few have been on extragalactic sources. The bias can be explained by the lack of suitable reference stars, since the most commonly observed extragalactic objects lie out of the galactic plane, while most stellar sources lie in the galactic plane where the bright reference stars can be found; and with the exception of a few of the brightest AGN, the nuclei of other galaxies are too faint for wavefront sensing with current technology. Only partial correction, and that under exceptional conditions, can be achieved while correcting on even the brightest starburst hotspots [Knapen (1999)].
Clearly there is a need for further work to develop high quality artifical guide stars, but technical difficulties have slowed progress. ALFA (Adaptive optics with a Laser For Astronomy), is addressing these issues and has made significant progress in this area. It is installed on the 3.5-m telescope at Calar Alto, and is now the first laser guide star (LGS) adaptive optics facility to be available to guest observers. In this contribution, by discussing the operation of and observational results from the ALFA LGS, we attempt to provide the reader with an understanding that will enable him/her to answer the question “How useful are laser guide stars at the present time?”.
Section 2 introduces ALFA with a brief overview of the developmental milestones. The observational practice is then outlined in Section 3, followed by a discussion of the limiting features of the LGS. Section 4 briefly mentions a number of experiments that are being carried out in conjunction with the European Laser Guide Star Network in order to better understand, quantify, and improve the performance of LGS. This must be done before they can be usefully employed on 8-m class telescopes. Lastly in Section 5 we present some observational results that indicate the current performance of the system.
2 Overview
The performance goal of ALFA was to reach 50% Strehl at 2.2 m under typical seeing conditions (0.9′′) with good sky coverage. Due to the technical challenge inherent in building both an adaptive optics bench and a laser system, these were constructed separately and are described below.
The AO system is based on a Shack-Hartmann sensor with several interchangeable lenslet arrays, and is described in detail in \inlinecitehip98, \inlinecitewir98, and Kasper et al. (this issue). It is optimised for partial correction using a LGS, with the aim of typically sampling 18 hexagonal subapertures at a frame rate of 100 Hz. In this configuration, the centroids of the spots in the sensor are used to determine the coefficients for 21 Zernike or 24 Karhunen-Loeve modes, and these are then applied to a 97-actuator mirror. The tip and tilt components must be measured using a separate tracker camera since it is not possible to distinguish the up-link motion of the laser beam from the down-link tipt-tilt motion.
The optical bench for the laser is installed in the coudé lab, where an Ar+ laser pumps a continuous-wave dye ring laser with a single line output power of 3.8 W. The output beam is fed along the coudé path and directed into a launch telescope, resulting in a sodium beacon with a magnitude of about m9–10 at zenith. Further details of the lasers, beam relay, diagnostic tools, and safety issues are given by Rabien et al. (this issue) and Ott et al. (this issue).
Since Sept 1997, when the loop was locked on the laser for the first time, development of the LGS and AO has progressed in tandem and been fairly rapid. In December 1997, the LGS was used to enhance image resolution, sampling 6 subapertures at a frame rate of 60 Hz, and correcting 7 modes (plus tip-tilt). During these observations the binary stars in BD+31∘643 were clearly resolved. In March 1998, the laser guide star was seen on the wavefront sensor using 18 subapertures at a frame rate of 100 Hz. A summary of the status and performance at this time can be found in \inlinecitedav98d. Since then significant improvements to the hardware have enhanced the performance considerably. Although poor weather has hampered testing of the upgraded system, during an August observing run K-band Strehl ratios higher than 60% were measured on bright stars, and even on V-11 mag stars Strehl ratios of 10–15% within a radius of 50′′ were achieved. Also, for the first time we successfully used the laser guide star to improve the image quality of another galaxy, UCG 1347 in the Abell 262 cluster. Our most recent success, in June 1999, is to achieve a Strehl ratio greater than 20% in the K-band.
3 Operation
3.1 Observing with a LGS
The entire operating procedure for running the laser and
observing are described in
‘The ALFA Laser Guide Star System: A User’s Guide’
which is available on-line from the ALFA pages at
http://www.mpe.mpg.de/www_ir/ALFA/ALFAindex.html.
A few of the salient points concerned with observational issues are
discussed below.
There is a set procedure for optimising the LGS at the beginning of every night which is currently semi-automated. The rayleigh cone and LGS show up clearly on the TV finder and this allows correct positioning, a step which must always be executed manually. The aim is to locate the LGS on the wavefront sensor (with a field of view of only a few arcsec) for fine tuning and focussing, a 3-stage process requiring adjustment of laser frequency, launch telescope and WFS. Typically the frequency does not need adjusting and it is sufficient to tune it to the zero velocity component observed in a Na-cell in the lab. An automated algorithm then takes care of the focussing, and has increased the observing efficiency by a alrge margin. The principle of the algorithm is similar to that used on many telescopes: measure the PSF at a number of focus positions which straddle the optimal one, fit a curve through the points, and read off the best position. The only subtle part is how best to measure the PSF: brightest pixel, encircled energy, FWHM, etc. for launch telescope and WFS focussing, the ratio of the flux in small and large apertures should be a good measure of how concentrated the energy is. A single iteration of the algorithm for each focus required appears to be sufficient. Once the LGS is as compact and bright as possible the wavefront sensor can be calibrated using a reference fibre. However, because the height of the Na layer is not known exactly, the focus position at which the reference fibre must be placed is also uncertain. Thus another iteration of the algorithm is used to focus the fibre on the WFS, by moving the fibre along the optical axis while keeping the WFS itself fixed.
The bright Rayleigh cone which extends to a height of 25 km is separated from the LGS by about 17′′ at zenith and is rejected from the wavefront sensor simply by using a 10′′ aperture. Although the separation lessens at large zenith angles, this is more than sufficient since even at 60∘ it is still more than 8′′ so the light pollution in the sensor is low. Recent observations have shown that there is still scattered light in the WFS aperture, although at a relatively faint level, which may be reflected from inside the dome. A smaller field-stop will be used to reduce this as much as possible.
As the telescope tracks, the distance to the sodium layer changes and so periodic tuning, focussing, and calibration must be carried out. At present we have not made long enough exposures to need to do this more frequently than every time we slew to a new object. Currently we do not expect to need to do this more than every 1–2 hours, but once the LGS spot is optimised (see Section 3.2.1) more frequent adjustments may become necessary.
3.2 LGS Properties
In March 1998 the LGS was seen on the wavefront sensor through 18 subapertures at a frame rate of 100 Hz, as reported in \inlinecitedav98d. However, this is still difficult to achieve since the LGS is rather more extended and fainter than a star of similar V-magnitude. Initially, the LGS brightness was measured in magnitudes for easy comparison to stars, and this has stuck even though it is misleading — due to the broad sensitivity range of the wavefront sensor CCD (the quantum efficiency remains above 50% over 0.49–0.84 m) which allows it to detect emission in the V- and R-bands as well as some of the I-band. A more natural unit would be the photon number detection rate, which is appropriate for the narrow line width of the LGS and is also independent of a star’s spectral type. However, this has not been adopted as it is extremely inconvenient when searching (magnitude based) catalogues for possible guide stars. It should therefore be borne in mind that the number of photons detected from a mV=9.5 LGS will be the same as those from a mV=10.9 A0 star. Additionally, more photons are detected from redder stars: the above example could be extended to include a K0 star reddened by 1 mag, which need only have mV=11.5.
The size and brightness are the two observables that must be optimised, and they are considered below before we show some simulations of the performance that we should expect from the LGS.
3.2.1 Size & Shape
The angular size of the LGS needs to be minimised so that it is more intense and the centroid better defined, requiring the projected beam to be focussed on the Na layer from a launch telescope. Two conflicting effects determine the diameter required: 1) in the absence of turbulence, simple diffraction theory says that the theoretical minimum spot size is smaller when a wider exit-beam diameter is used (); 2) but the presence of atmospheric turbulence means that if the exit-beam exceeds 2–3 times the coherence length , the spot will break up into speckles, increasing the effective size to /. In order to cope with variable conditions on different nights there is a pre-expander on the optical bench which increases the beam diameter to 1.5–3.0 cm, controlling the width of the beam exiting the launch telescope within the range 24–49 cm, suitable for seeing of 0.8–1.5′′ (–15 cm at 589 nm). The single (Gaussian) TEM00 mode quality of the beam also helps to concentrate most of the power in a small region.
Up until mid-1999, the LGS had a typical FWHM of 3′′, the cause of which was uncertain. Originally the situation was worse, and considerable turbulence arose between the coudé lab and the telescope. To combat it the entire beam path was enclosed in pipe sections, a scheme that produced a noticeable improvement and additionally acted as a safety precaution. To measure the distortion, a Shack-Hartmann sensor was installed in the diagnostics bench below the launch telescope (\openciterab99, also this issue). Because it does not operate in a photon-starved environment no special equipment is required, and the main components are an old lenslet array from ALFA’s AO bench and a 30 Hz frame-rate camera. The results indicated an rms wavefront error of only 0.1 (at the laser wavelength of 589 nm), which is much less than that required to explain the LGS size. The lack of a calibration fibre meant that this WFS could only measure dynamic aberrations, so a Shearing interferometer was used to study the static aberrations. It suggested that a few optical elements in the beam path (eg the glass plate sealing the end of the pipe from the coudé lab) were to some extent culprits of the poor beam quality. It finally became clear, by imaging stars through the launch telescope, that this was the source of most aberrations. Since installation it had become misaligned, and additionally the primary mirror was being slightly distorted by the clamps holding it in place. A new launch telescope is been constructed which should remove the problem entirely; but by careful correction of the old one we are able to reduce the spot to 1.7′′, even using a launch beam only 10 cm wide and in seeing of 1.2′′.
rou94 gives the phase measurement error (rad2) associated with signal photon noise in a Shack-Hartmann sensor as
where is the number of photons of wavelength (nm) detected in one subaperture of diameter (m) in one sampling time, and (arcsec) is the angular diameter of the LGS. Clearly, if we could reduce the spot size to only 1′′ then the photon noise phase error would be reduced by an order of magnitude. Only then would elongation of the spot due to off-axis projection become an issue, although given the axial separation of 2.9 m between the telescopes, the elongation will be in the range 0.23–0.95′′ (near and far-sides of the telescope primary) for an 8 km thick sodium layer at a mean altitude of 90 km. Thus for a 1′′ LGS, the aspect ratio would be less than 1:1.4. With our current set-up and LGS spot size this is not a problem, but more detailed modelling of the LGS elongation in different subapertures both for ALFA and for the VLT can be found in Viard et al. (this issue).
As an interim measure to help with the problem of LGS size, lenslet arrays with 2 focal lengths have been installed, giving pixel scales of 0.75′′ pixel-1 and 1.25′′ pixel-1. The phase error due to read noise [Rousset (1994)] is
where is the electron read noise per pixel, is the FWHM of the diffraction limit in pixels, and is the number of pixels used in the centroiding. Hence increasing the pixel scale gains us a factor of 3 in the read noise phase error.
Additional errors can arise with a LGS larger than the isoplanatic patch at the wavelength of the science observations, particularly if the size of the apertures on the wavefront sensor is well matched to the coherence length . However, this is not a serious problem for us, since our system is designed to operate in the near-infrared where is relatively large, typically 7′′ at K for 1′′ seeing.
3.2.2 Brightness
The routinely obtainable laser output power is 3.8 W. However, this is reduced to typically 2.1–2.3 W by the time it reaches the telescope due to the multiple reflections from mirrors which very quickly become dirtied with dust blown over from the Sahara. More recently, in mid-1999, we have been achieving output powers of 4.1 W and, with freshly cleaned mirrors, a launch power of 3.2 W
The addition of COT to the Rh6G glycol dye solution increases the laser power by about 10% by further suppressing the triplet states in the dye molecules (see Rabien et al. this issue). However, we have found that this lasts only for short time-scales of tens of minutes. A further effect is that the lifetime of the molecules is extended, although the reason for this is unclear.
If the bandwidth of the laser is very narrow compared to the doppler width of the sodium in the mesospheric layer so that it effectively excites only a single velocity group, the magnitude of the LGS can be calculated from (W m-2), the power observed,
This in turn is derived from the estimate
where (W) is the launch power, the atmospheric transmission, and (m) the distance of the Na layer from the telescope. Since typically only 4% of the laser power is absorbed by the Na at zenith (and 10% at large zenith angles), that fraction is well approximated by , where m2 is the homogenously broadened absorption cross-section of the D2 transition, and (m-2) the column density. The factor of 1.2 is due to the marginal direction dependence of the scattered intensity, due to the interaction of Na atoms with the circularly polarised laser light. A further modifier should be included if the intensity of the laser in the mesosphere is close to the saturation intensity of 6 W m-2 MHz-1. As the laser intensity increases a larger fraction of the fluorescence power is wasted as stimulated emission near the laser axis, approaching half of the total when the laser and saturation intensities are equal. For a 10 MHz bandwidth
where (arcsec) is the diameter of the LGS. For our launch power of 2.3 W this will only be important if the spot size is less than about 1 arcsec.
Away from zenith each of , , and need to be adjusted appropriately, resulting in a strong dependence on zenith angle. Figure 1 shows the prediction of their effect on the LGS magnitude.
During March 1998 the magnitude was measured as m for an estimated launch power of 2.3 W and atmospheric transmission of % each way, from which the Na column density was derived as m-2. Typical values measured by from absorption in the solar spectrum on Kitt Peak and in the stellar spectra of Leo and Aql) on Mt Hopkins at a latitude of 32∘ N (very similar to the 37∘ N of Calar Alto) are 2– m-2 [Ge et al. (1997), Ge et al. (1998)]. However, comparisons are fraught with difficulties due to the seasonal, diurnal and even hourly variations in Na column density (eg. see \openciteage99, and references therein).
3.2.3 PSF simulations
| Distance to | residual FWHM | Strehl | FWHM | energy in | 50% encircled |
|---|---|---|---|---|---|
| tip-tilt star | image motion | ratio | resolution | 0.20′′ radius | energy radius |
| [arcsec] | [arcsec] | [%] | [arcsec] | [%] | [arcsec] |
| 0 | 0.00 | 25.0 | 0.14 | 23 | 0.41 |
| 30 | 0.06 | 21.3 | 0.15 | 24 | 0.41 |
| 60 | 0.10 | 17.2 | 0.17 | 25 | 0.41 |
| 90 | 0.21 | 9.2 | 0.30 | 24 | 0.41 |
| 120 | 0.46 | 4.1 | 0.66 | 16 | 0.43 |
| 0.72 | 2.9 | 0.90 | 16 | 0.47 | |
| — | 2.4 | 1.00 | 10 | 0.50 | |
| — | 100.0 | 0.13a | 66 | 0.09 |
a The commonly used half-width zero intensity is 0.144′′, slightly better than the 0.166′′ for a 3.5 m mirror with no central obscuration.
We have modelled the point-spread functions (PSFs) that might be expected when ALFA is operating under typical conditions (eg K-band, 1.0′′ seeing) and summarise the parameters in Table 1. The atmospheric turbulence parameters give r cm and a Greenwood frequency [Greenwood (1977)] of Hz, both at 2.2m. For the model we have assumed the seeing profile is Gaussian and the diffraction limited profile is an Airy function that has been modified to take into account the 1.37 m central obscuration in the 3.50 m mirror. The partially corrected PSFs assume the usual model of a diffraction limited core, and a halo with FWHM similar to the seeing. When using the lenslet array only 21 modes are corrected, and combined with a sampling rate of 100 Hz (disturbance rejection bandwidth 8 Hz), the residual phase error is about 1 rad2. We have included an extra 0.4 rad2 error to simulate the noise associated with correcting on a mV=9.5 mag LGS. Thus the Strehl ratio for an on-axis natural guide star (NGS) is about 25%. For the LGS we have assumed that the tip-tilt is corrected using an off-axis star, introducing some residual image motion (given in the table as FWHM); but that the star is bright enough that no wavefront aberrations are introduced by detector noise or bandwidth limitations. The table clearly shows that much beyond 60′′ the performance of the AO is severely degraded. At 140′′ the tip-tilt of the star is completely uncorrelated with that on-axis, because the jitter is the same as that for uncorrected one-axis tilt [Fried (1965)]
where (m) is the telescope diameter, (m) the observing wavelength, and (rad2) gives a FWHM jitter of 0.72′′.
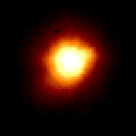
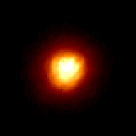
The profiles for a tip-tilt star on-axis and 60′′ off-axis are shown in Figure 2. The dotted lines are the seeing and diffraction limited profiles; the solid lines show the simulated PSFs. When the star is 60′′ off-axis the residual image motion is 0.1′′ and reduces the strehl ratio to 17%. Whether it matters to the observer depends on the quantities required: the 50% encircled energy radius of 0.41′′ is the same in both cases; the fraction of energy within a 0.2′′ radius actually increases marginally with an off-axis tip-tilt star (because some energy from the first Airy ring is shifted into the aperture). Hence, if getting as much energy as possible into a slit or simply trying to detect faint objects is the aim, then the residual tilt is not a problem. The FWHM resolutions are 0.14′′ and 0.17′′, both good but the difference could be important if trying to separate close objects. On the other hand, the stronger Airy ring in the former case might offset any gain from a narrower core. Further analysis of the PSFs obtained with NGS and LGS will be possible with more observations.
4 LGS Experiments
During August 1998 a number of experiments were performed at the Calar Alto observatory in collaboration with the TMR Laser Guide Star Network111the Network for Laser Guide Stars on 8-m class Telescopes operates under the auspices of the Training and Mobility of Researchers programme of the European Union, during which SCIDAR was carried out on the 1.2 m to measure atmospheric turbulence, a MAMA detector on the 2.2 m measured photon return from the LGS and Rayleigh cone, and ALFA was operated on the 3.5 m. Full results from these will be published elsewhere. The experiments attempted to tackle a range of issues, and the rationale for them is outlined briefly below. More detailed discussion of the methods used and results obtained can be found in several papers also in this issue (O’Sullivan et al., Viard et al., and Esposito et al.).
4.1 Tip-Tilt from a Laser Beacon
The tip and tilt modes of a wavefront distortion are responsible for the bulk of the image degradation. Each of these terms contributes a phase error of rad2 to the total rad2 [Noll (1976)], and unless these can be corrected effectively then any image improvement from higher order terms will be negligeable. Although this means that image resolution can often be enhanced significantly simply by use of a fast guider, it also has implications for laser guide stars because the up-link and down-link tip-tilt components cannot be separated. Thus a laser beacon cannot easily be used to measure tip-tilt modes, with the result that sky coverage is limited by the availability of stars for fast guiding. There are two alternative proposals to circumvent this difficulty. One involves the polychromatic LGS concept [Foy et al. (1995)] in which the 4P3/2 level of Na is excited, and the ensuing radiative decay results in a line spectrum from 0.33 nm to 2.207 m. The wavelength dependence of the refractive index of air allows the tip-tilt component to be determined. Another method is to use auxiliary telescopes [Ragazzoni et al. (1995)] from which the up-link and down-link motions of the laser and beacon are uncorrelated. The uncorrelated tip-tilt motions of the beacon and a natural guide star are due to the up-link tip-tilt of the laser alone. The advantage is that there is a much greater chance of finding a natural star in the same isoplanatic patch as the laser, since it now appears highly elongated.
In collaboration with the TMR LGS network we attempted the first measurement of tip-tilt from a laser guide star, using the 2.2-m to view the LGS off-axis. Initial analysis of a small part of the data indicate that sufficiently separated sections of the extended laser plume show uncorrelated motions, but the same differential motion with respect to nearby natural stars, which is the up-link motion of the laser. By removing the jitter measured below the laser launch telescope, it is possible to reconstruct the motion due to atmospheric tip-tilt alone. A second experiment to compare the tip-tilt measured in this way to that observed by ALFA from an on-axis natural star proved to be more complex and further observations will be needed.
4.2 Site Characteristics
It is very important to have some knowledge of the atmospheric characteristics of the site if successful and optimal adaptive optics correction is to be achieved. To this end, a number of experiments have been monitoring the profile of the Na layer, atmospheric turbulence, and the performance of ALFA.
4.2.1 Sodium layer profile
Viewed from the 2.2 m telescope, the LGS plume appears to be about 100 arcsec long, and hence can be used to look at the vertical profile of the sodium layer with a resolution better than 250 m. Previous observations during the autumn of 1997 have shown that over the time-scale of 1 hour the profile of the Na layer can change significantly. It is crucial to know the time-scale on which these structures appear and disappear, and the scale of the differences. Narrow sporadic layers have been observed, and whether they are actually high-altitude noctilucent clouds or real changes in Na abundance can be established by tuning the laser on and off the Na line. The main consequences of such variability are the effect on the brightness and centroid height of the LGS. Simulations suggest that for a well-focussed spot it will be necessary to refocus the wavefront sensor, and perhaps also the launch telescope, if the effective altitude changes by more than 1 km. The height and distribution of the Na at various times during the night have therefore been monitored [O’Sullivan et al. (1999)].
Future possibilities for more permanent measurement of the sodium, in order to gain detailed statistics of the site, include using ALFA as a LIDAR station. The laser will be amplitude-modulated to give micro-second pulses, allowing the time of flight of the photons to be measured, and hence a vertical density profile of the sodium layer to be calcuated. The backscattered light will collected by the telescope will be fed into an APD. A psedo-random sequence of on/off pulses in a non-return to zero format will allow a high signal-to-noise to be reached in a short time. The system has the great advantage that the Na profile can be measured in a few seconds, at almost any time and with little extra effort required.
A different monitoring experiment has begun to determine the effects and seriousness of light pollution from the laser due to Rayleigh and Mie backscattering [Delplancke et al. (1999)]. This is an extremely important issue for crowded observatory sites, and preliminary work at Calar Alto suggests that multiple backscattering may exceed the ambient background out to distances of 1∘ from the laser beam.
4.2.2 Atmospheric turbulence profile
The effectiveness of any given AO configuration (sampling frequency, number of modes corrected, etc.) depends on the prevailing atmospheric conditions at the time. For the example in Section 3.2.3, the 25% Strehl we expect with 1′′ seeing would vary between 19–33% with seeing in the range 0.8–1.2′′. A more practical approach is to measure the average turbulence and velocity profiles at a particular site and time of year to gain an understanding of the isoplanicity and time-scale for temporal variation. The SCIDAR (SCIntillation Detection and Ranging) technique involves autocorrelating the scintillation patterns due to a binary star in the telescope pupil plane in order to recover the spatial correlation and hence refractive index structure constant C(h) as a function of height. The method also allows the wind speed and direction of the dominant layers to be established by correlation of frames with different temporal separations. Data from one night in 1997 suggest cm (at nm), an unexpectedly favourable result given the median seeing; more measurements are needed to determine the typical characteristics. Further results were obtained during August 1998, and will be analysed in conjunction with simultaneous closed loop gradients from ALFA and the resulting PSF images. We can then, for example, check the calibration of SCIDAR and ALFA by comparing the value of derived from each of the above instruments through roughly the same column of atmosphere; from SCIDAR by knowledge of the turbulence layers and from ALFA via the modal power spectral density. Similarly the wind velocities and temporal power spectral density can be compared via the Greenwood frequency.
5 Observational Results
For an AO system to work effectively with a LGS as the wavefront reference, it must first be tested using natural guide stars. During August 1998 this was done extensively. On bright stars (V8) it is now possible, even in relatively poor seeing conditions, to obtain diffraction limited images routinely with Strehl ratios at least 40%. On stars as faint as V=11 mag it is still possible to achieve Strehl ratios of 10–15%, with a resolutions of around 0.25′′. Currently the faintest object on which we have locked is NGC 1068 which has an unresolved core fainter than mV13 mag.
These results indicate that the AO is at a stage where routine correction using a LGS should be possible, and so the system is now open to guest observers at Calar Alto on a shared-risk basis. However, the problems discussed previously mean that LGS observations are still far from routine. In the rest of this Section we discuss 2 sets of observations. The first is of the field around a Herbig Ae/Be star which show that ALFA is effective on relatively faint stars, and that in the partial correction mode the isoplanatic patch is large. The second is of 2 galaxy clusters, and include the first image improvement on another galaxy using the laser guide star. Details of other scientific results, including the first diffraction limited integral field spectroscopy, can be found in \inlinecitedav98e and \inlinecitedav99a.
5.1 The Field around the Herbig Ae/Be star BD +40∘ 4124
During August 1998 the Herbig Ae/Be star BD +40∘ 4124 was observed with ALFA, using the 3D integral field spectrometer as well as Omega-cass; here we discuss issues relevant to the AO performance. For the wide field K-band image with Omega-cass, BD +40∘ 4124 (V=10.6, K=5.6) was centered in the wavefront sensor, allowing correction of 18 modes with a frame rate of 75 Hz. Although this star was saturated the Strehl ratios and FWHMs of 14 others in the field were measured, and these are plotted against their radial distance in Figure 3. The pixel size of 0.08′′ means that the Strehls could be underestimated by as much as 4%, and the scatter may be partly due to this. The FWHMs were estimated using only vertical and horizontal cuts (the ‘errorbars’ are lines joining these points) since models suggest that the pixel size is already limiting the resolution. The figure indicates that out to radii of at least 30′′ there is very little degradation in performance since the wavefront error due to anisoplanaticism is small compared to the total error; and beyond this as far as can be measured, the correction is only marginally worse.
Figure 4 shows that the correction achieved here is useful: a star 20′′ away clearly has a single peak (as do all the single stars in the field), while another has a double peak, identifying it unambiguously as a previously unknown binary system with a separation of 0.32′′. Importantly, examination of the profiles of all the sources indicates that the speckle pattern in the halo appears to be stable over the whole field. This means that deconvolution should work well (yielding an effective resolution rather better than 0.2′′) and that the choice of PSF, at least in this case, is not critical. A further result from this image was that a star in the pair V1318 Cyg (40′′ East of BD +40∘ 4124) was resolved to be . Since JHK colours also indicate that this pair are both very red, we interpret it as a dust shell around the star, with a deconvolved size of AU (assuming a distance to the stellar aggregate of 1 kpc, \opencitehil95).
5.2 Galaxies in the Abell 1367 and 262 Clusters
Between December 1997 and August 1998 we observed 25 galaxies in the Abell 1367 and Abell 262 clusters, including two barred spiral galaxies UGC 1347 and UGC 1344 (full results and analysis will be given in Eckart et al. 1999, in preparation).
For UGC 1344 we used a nearby (27′′ separation) natural guide star with V=11.0 mag, correcting 7 modes at a sampling rate of 150 Hz, achieving a disturbance rejection bandwidth of about 13 Hz. Cuts of the profiles through the star and galaxy, for both open and closed loop as well as deconvolved are shown in Figure 5. The peak intensity of the star increased by a factor of 3, and the FWHM improved from 1.0′′ to 0.4′′. For the galaxy, the peak increased by only 1.4, although the discussion for BD +40∘ 4124 indicates that the galaxy is well within the isoplanatic patch. The deconvolved image begins to indicate the reason: there is a narrow unresolved core and a wider bulge component so the increase in peak intensity will be that due to the core only. The observations can be explained if the flux in the bulge is 3 times that in the core. The presence of a core suggests a recent localised burst of star formation in the galaxy’s nucleus.
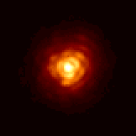
For UGC 1347 we corrected tip-tilt using a V=11.8 mag star 41′′ away, and pointed the laser guide star midway between this and the galaxy. High order corrections were achieved using the LGS, also with 6 subapertures but at a lower frame rate of 50 Hz (rejection bandwidth of only 4 Hz). Figure 6 shows for the star an increase in peak intensity of 2.5, and improvement in resolution from 1.1′′ to 0.4′′. Exactly similar enhancements are seen in the compact H ii region of the galaxy 11′′ from the nucleus, but almost no change is seen in the nucleus itself. All the evidence for recent star formation in this galaxy can be accounted for by the H ii region alone.
Both these galaxies have projected positions close to the centre of the Abell 262 cluster, and both have large velocities with respect to the cluster average. However, only UGC 1344 is Hi deficient [Giovanelli and Haynes (1985)]. Hi deficiency strongly correlates with distance from the cluster centre, the central region being the zone of depletion. The interpretation is that gas is stripped away as the galaxy crosses the crowded central region, giving rise to the hot intracluster gas observed in X-rays. Our results for the whole sample suggest also that star formation is induced as a galaxy crosses the centre of the cluster. In this interpretation, the Hi deficient galaxy UGC 1344 has just passed the centre so that it has lost its gas and undergone a burst of star formation; UGC 1347 is approaching the centre and has not yet been depleted of its Hi nor had nuclear star formation triggered.
5.3 Achieving High Strehls with a LGS
These results show that the potential for laser guide stars is there, but the gains achieved so far have been marginal. Following optimisation of the launched laser beam and also of the wavefront sensing hard- and software, we have reached a Strehl ratio of 23% in the K-band using the LGS to correct high-orders.
For these results, shown in Figure 7, the laser was pointed on-axis and imaged on the WFS through the 5x5 lenslet array at a frame rate of 75 Hz. This allowed 18 high order Karhunen-Loeve modes to be corrected with a bandwidth of around 12 Hz. A natural star (SAO 68075), 10′′ off-axis to avoid any of its light reaching the WFS, was used to correct tip-tilt motion at 65 Hz. A series of 40 consecutive images were taken of the star in the K-band. Each integration was 5 sec, and the only processing performed was sky-subtraction and bad pixel removal. In particular, no shift-and-add or deconvolution techniques were applied. Frames were added together directly to produce long exposure images.
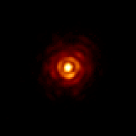


During the observations the K-band seeing was 0.65′′, a remarkably good value. A 50 sec image with the tip-tilt corrected on the star shows the resolution with this alone was improved to 0.49′′. Adding together all 40 images taken while high-orders were corrected with the LGS gave an effective exposure time of 200 sec, during which the FWEHM was reduced to 0.19′′, and a Strehl ratio of 12.8% was reached. During the best 10 sec a Strehl of 23% was achieved and the image is diffraction limited. Probably the performance is variable because of the jitter of the LGS on the WFS, which due to techincal problems has not yet been corrected. This is entirely atmospheric, due to the different up and down tilt components, and means that the centre of the LGS spots must often be determined while close to the boundary of the centroiding box. Additionally, there may be non-linear effects in the modal reconstruction due to the large offsets from the zero-point calibration positions. Nevertheless, the superb performance achieved here shows the exciting future potential of adaptive optics with laser guide stars.
Acknowledgements.
The MPIA/MPE team thanks the Calar Alto staff for their help and hospitality, and N. Wilnhammer for technical support. RID acknowledges the support of the TMR (Training and Mobility of Researchers) programme as part of the European Network for Laser Guide Stars on 8-m Class Telescopes. Thanks are also due to the referee for a number of pertinent comments from which the manuscript has benefited.References
- Ageorges et al. (1999) Ageorges, N., N. Hubin, and M. Redfern: 1999, ‘Atmospheric Sodium Column Density Monitoring’. In: Astronomy with Adaptive Optics.
- Davies et al. (1999) Davies, R., W. Hackenberg, T. Ott, A. Eckart, S. Rabien, S. Anders, S. Hippler, M. Kasper, P. Kalas, A. Quirrenbach, and A. Glindemann: 1999, ‘The Science Potential of ALFA: adaptive optics with Natural and Laser Guide Stars’. A&A 138, 1.
- Davies et al. (1998a) Davies, R., W. Hackenberg, T. Ott, H.-C. Holstenberg, S. Rabien, A. Quirrenbach, and N. Wilnhammer: 1998a, ‘ALFA: First Operational Experience of the MPE/MPIA Laser Guide Star System for Adaptive Optics’. In: D. Bonaccini and R. Tyson (eds.): Adaptive Optical System Technology, Vol. 3353. pp. 116–124.
- Davies et al. (1998b) Davies, R., W. Hackenberg, T. Ott, S. Rabien, A. Eckart, S. Hippler, and M. Kasper: 1998b, ‘Observational Results from ALFA with Natural and Laser Guide Stars’. In: Astronomy with Adaptive Optics.
- Delplancke et al. (1999) Delplancke, F., N. Ageorges, N. Hubin, and C. O’Sullivan: 1999, ‘LGS Light Pollution Investigation at Calar Alto’. In: Astronomy with Adaptive Optics.
- Foy et al. (1995) Foy, R., A. Migus, F. Biraben, G. Grynberg, P. McCullough, and M. Tallon: 1995, ‘The Polychromatic Artificial Sodium Star: A New Concept for Correcting the Atmospheric Tilt’. A&AS 111, 569.
- Fried (1965) Fried, D.: 1965. JOSA 55, 1427.
- Ge et al. (1997) Ge, J., J. Angel, B. Jacobsen, T. Roberts, T. Martinez, W. Livingston, B. McLeod, M. Lloyd-Hart, P. McGuire, and R. Noyes: 1997, ‘Mesosphere Sodium Column Density and Laser Guide Star Brightness’. In: N. Hubin (ed.): Laser Technology for Laser Guide Star Adaptive Optics Astronomy, Vol. 55. pp. 10–15.
- Ge et al. (1998) Ge, J., B. Jacobsen, J. Angel, P. McGuire, T. Roberts, B. McLeod, and M. Lloyd-Hart: 1998, ‘Simultaneous Measurements of Sodium Column Density and Laser Guide Star Brightness’. In: Adaptive Optics System Technologies, Vol. 3353. pp. 242–253.
- Giovanelli and Haynes (1985) Giovanelli, R. and M. Haynes: 1985. ApJ 292, 404.
- Greenwood (1977) Greenwood, D.: 1977. JOSA 67, 390.
- Hillenbrand et al. (1995) Hillenbrand, L., M. Meyer, S. Strom, and M. Skrutskie: 1995. AJ 109, 280.
- Hippler et al. (1998) Hippler, S., A. Glindemann, M. Kasper, P. Kalas, R.-R. Rohloff, K. Wagner, D. Looze, and W. Hackenberg: 1998, ‘ALFA: The MPIA/MPE Adaptive Optics with Lasers for Astronomy Project’. In: D. Bonaccini and R. Tyson (eds.): Adaptive Optics System Technologies, Vol. 3353. pp. 44–55.
- Knapen (1999) Knapen, J.: 1999, ‘Observations of Barred Galaxies’. In: J. Beckmand and T. Mahoney (eds.): The Evolution of Galaxies on Cosmological Timescales.
- Noll (1976) Noll, R.: 1976. JOSA 66, 207.
- O’Sullivan et al. (1999) O’Sullivan, C., M. Redfern, N. Ageorges, H.-C. Holstenberg, W. Hackenberg, S. Rabien, T. Ott, R. Davies, and A. Eckart: 1999, ‘The Mesospheric Sodium Layer At Calar Alto, Spain’. In: Astronomy with Adaptive Optics.
- Rabien et al. (1999) Rabien, S., R. Davies, W. Hackenberg, A. Eckart, and T. Ott: 1999, ‘Analysis Tools and Beam Relay System for the ALFA Laser’. In: Astronomy with Adaptive Optics.
- Ragazzoni et al. (1995) Ragazzoni, R., S. Esposito, and E. Marchetti: 1995, ‘Auxiliary Telescopes for the Absolute Tip-Tilt Determination of a Laser Guide Star’. MNRAS 276, P76.
- Ridgway (1998) Ridgway, S.: 1998, ‘Scientific Porgrams in Adptive Optics – an Overview and Commentary’. In: D. Bonaccini and R. Tyson (eds.): Adaptive Optical System Technology, Vol. 3353. pp. 438–446.
- Rousset (1994) Rousset, G.: 1994, ‘Wavefront Sensing’. In: D. Alloin and J.-M. Mariotti (eds.): Adaptive Optics for Astronomy, Vol. 423 of ASI. pp. 115–137.
- Wirth et al. (1998) Wirth, A., J. Navetta, D. Looze, S. Hippler, A. Glindemann, and D. Hamilton: 1998, ‘Real-Time Modal Control Implementation for Adaptive Optics’. Appl. Optics 37(21), 4586–4597.