EUV EMISSION IN ABELL 1795, ABELL 2199, AND THE COMA CLUSTER
Abstract
We report new EUV data on the cluster of galaxies Abell 1795. These data were taken well away from a detector defect which could have compromised earlier results on this cluster. Our new observations confirm the validity of the original data set. However, we find our results are strongly influenced by the variation of the telescope sensitivity over the field of view and upon the details of the subtraction of the EUV emission from the X-ray plasma. We investigate these effects using our new data and archival data on Abell 1795, Abell 2199 and the Coma cluster. When we use the appropriate correction factors, we find there is no evidence for any excess EUV emission in Abell 1795 or Abell 2199. However, we do find extended EUV emission in the Coma Cluster using our new analysis procedures, confirming that in at least this cluster some as yet unidentified process is operative.
1 Introduction
Extreme ultraviolet (EUV) emission in excess of that produced by the well-studied X-ray emitting gas in clusters of galaxies has been reported in five clusters of galaxies from observations with the Extreme Ultraviolet Explorer (EUVE). The effective bandpass of the EUVE telescope employed in these observations is defined by the intrinsic response of the telescope combined with the absorption of the intervening Galactic interstellar medium (ISM). This bandpass has a peak at 80 Å with 10 percent transmission at 66 and 100 Å. A variety of instrumental effects that might have explained these results have been advanced but a detailed analysis has shown these factors cannot explain the data (Bowyer, Lieu, & Mittaz l998). A number of ISM effects have been suggested which might have produced the EUV excess. An error in the measurement of the total amount of absorbing gas in the Galaxy could have explained these results. However, detailed measurements of the Galactic neutral hydrogen in the direction of these clusters (Lieu et al., 1996a,b) have eliminated this as an explanation. A particular ionization state of the Galactic ISM could have produced this result but a detailed analysis shows that the required ionization is not, in fact, realized (Bowyer, Lampton, & Lieu 1996).
It is interesting to note that the EUV excess is detected in some ROSAT images. However, the effect is sufficiently marginal that the ROSAT results can almost be explained away through the use of particular combinations of intervening Galactic ISM and its ionization state, and different cross sections for absorption by hydrogen and helium (Arabadjis & Bregman 1999). The EUVE results, however, cannot be explained in this manner. It is also interesting to note that the EUV excess has been reported in every cluster investigated with EUVE.
A number of suggestions have been made as to the source of this EUV emission. Initial work focused on additional components of “warm gas” ( K). The problem with this suggestion is that gas at this temperature is near the peak of the cooling curve and substantial energy is needed to supply the energy radiated away. One mechanism that can provide this energy is gravitational condensation. Cen & Ostriker (1999) have suggested that a pervasive warm intergalactic gas constitutes the majority of matter in the Universe; as this gas coalesces onto clusters of galaxies, it could produce the energy needed to sustain the EUV emitting gas.
Several authors (Hwang 1997; Enßlin & Biermann 1998) have suggested the EUV flux in the Coma Cluster is inverse Compton (hereafter: IC) emission produced by the population of electrons producing the radio emission scattering against the 3∘ K Black Body cosmic background. However, Bowyer & Berghöfer (1998) have shown that the existing population of radio emitting cosmic ray electrons cannot be responsible for the EUV emission in the Coma cluster, and some other population of cosmic rays will be required if this mechanism is the source of the EUV emission in this cluster. Lieu et al. (l999a) have suggested that the Coma cluster contains a large population of cosmic rays which are producing the 25 to 80 keV emission seen by BeppoSAX (Fusco-Femiano et al. 1999) and RXTE (Rephaeli, Gruber, & Blanco 1999) via IC emission . They propose this population of cosmic rays extrapolated to lower energies will produce the observed EUV flux by IC emission. However, these authors have not addressed the fact that this population of electrons will produce a spatial distribution of the EUV flux which is inconsistent with observational results (Bowyer & Berghöfer l998).
Enßlin, Lieu, & Biermann (l999) have explored processes that might produce a heretofore undetected population of lower energy cosmic rays which could produce this flux. They demonstrate an evolutionary scenario in which relativistic electrons produced in the last merger event in Coma two Gyrs ago could produce these electrons. However, this model cannot produce the spatial profile of the EUV emission reported by Bowyer & Berghöfer. They also consider IC scattering of starlight photons and show that in some scenarios this could account for the EUV flux and the required spatial distribution.
Sarazin & Lieu (1998) have suggested that all clusters of galaxies may contain a relic population of cosmic ray electrons that are unobservable in the radio and these will produce excess EUV flux by inverse Compton scattering against the 3∘ K cosmic background. Their proposal is based upon, and explains, details of the EUV data obtained on Abell 1795 (Mittaz, Lieu & Lockman 1998).
Because of the key role of the EUV data from Abell 1795, we have obtained new observations of this cluster with EUVE. A new observation is especially important because of peculiarities in the EUVE Deep Survey (hereafter DS) telescope that may have affected the Mittaz et al. (1998) data set. A dead spot exists at the bore sight of this instrument and this dead spot was centered near the cluster core in the observations of Mittaz et al. It is only a few pixels in size and would not be expected to affect the observations of a diffuse source. However, the pulse height of the photons detected in the region surrounding this dead spot may be degraded in a manner that is not known (Vallerga & Roberts 1997). This effect, if present and unaccounted for, could lead to a substantial loss of counts in the central region of the image. We have taken special care to insure that our new observations of Abell 1795 were taken in a manor that was free from any spurious instrumentation effects.
We find that the results obtained are crucially dependent upon the characterization of the DS telescope, and upon details of the estimation of the EUV emission from the X-ray plasma. We have examined these aspects in depth. The results we obtain are quite different from those obtained in previous work, and consequently we expanded our inquiry by examining archival data on Abell 1795, Abell 2199, and the Coma cluster. We report the results of our investigations herein. Throughout this paper we use H0 = 50 km s-1 Mpc-1.
2 Data and Data Analysis
Ninety thousand seconds of data on Abell 1795 were obtained with the DS telescope of EUVE (Bowyer & Malina 1991) in March of 1998. The observations were taken in two segments of 45,000 seconds each. The individual observations were obtained 13′ to the east and to the west of the core of Abell 1795. These locations are well away from the central region in the detector that could potentially have produced spurious results, and are near the point of optimum focus for the DS Telescope.
The data were processed using procedures of the IRAF EUV package provided by the Center for EUV Astrophysics (CEA, Berkeley) which were especially designed for the analysis of EUVE data. As part of this process, we excluded detector events with pulse heights far from Gaussian peak of the photon pulse-height spectrum. Low energy events due to spurious detector noise(15% of the total), and high energy counts due to cosmic rays and charged particles (25% of the total), were screened out. A detailed description of different background contributions to the DS data can be found in Berghöfer et al. (1998). We point out that the location of the Gaussian peak in the pulse-height spectrum is not constant for all EUVE DS observations since the gain of the DS detector was changed periodically in the course of the mission. Consequently, pulse height limits were chosen individually for each DS observation.The resulting filtered event lists were corrected for electronic deadtime and telemetry throughput effects.
The background of the DS telescope consists of a uniform detector background, , and a component that may vary over the field because of a variety of effects including vignetting, variations in the thickness of the filter covering the detector face, variations in the quantum efficiency over the face of the detector, and other causes. Hereafter, we call this second component the vignetted background, . To investigate the possibility of a field variation effect, we chose four 20,000 second observations of blank sky with low and similar backgrounds that were obtained in a search for EUV emission from nearby pulsars (Korpela & Bowyer 1998). We added 90,000 second of data from a blank field at R. A. , Dec. obtained from the EUV archives. We processed the data as described above. We established that once proper pulse height selection of the detector events had been made, the detector backgrounds were all spatially identical.

A contour plot of normalized count rates in these exposures convolved with a 32 pixel wide Gaussian is shown in Figure 1. Each contour represents a 10% change in the measured count rates. 111Investigators interested in using this observationally derived vignetted background may access Fits Files at “http://sag-www.ssl.berkeley.edu/korpela/euve_eff” . It is informative to compare this observationally derived result with the theoretically derived product provided by Sirk et al. (1997), which has been used in previous work on this (and all other) clusters.
All observations contain both and . Because the ratio of these two backgrounds can vary, we must correct for this effect when scaling previously measured backgrounds to the backgrounds of our observations. Our background subtracted image is:
| (1) |
where is the on-source image. The term is derived from measurements of the background in obscured regions of the detector covering about 3.5 % of the detector area. The term represents the vignetted background. The factor is used to fit the vignetted background levels in the blank field with those of the on-source image. This factor is derived by fitting the observed photonic background with that of the blank field images in a region far from the source, in the case of Abell 1795 and Abell 2199, and in the case of the Coma cluster. Because of the long duration of the background exposures, the statistical errors in are less than 1%. When comparing on-source and background in small detector regions, our errors are dominated by the count statistics of the region, rather than errors in the background fitting.
In our observations of Abell 1795, the central source in the two offset exposures were made at regions with similar efficiencies, so these images could have been directly added without affecting the intensities of the central image. However, the backgrounds away from the cluster core will be affected differently so the vignetting correction was applied separately to each image before adding.
We examined two extragalactic sources detected near the cluster center: PGC 94626 about 7′ to the southwest, and 134834.3+262207 about 22′ to the southwest, for use in adding the two images. Each of these sources is a point source and we found each image to be spherically symmetric. We summed the data and fit the resulting profile with a Gaussian. The overall fit was good (reduced = 1.2) but the wings were not well fit far from the centroid. Adding a second Gaussian to reflect the extended nature of the point spread function improved the fit (reduced = 1.05). These sources provide an estimate of the point-spread function of the detector in the off-axis region where our cluster data was obtained; the FWHP of the images are 25″.
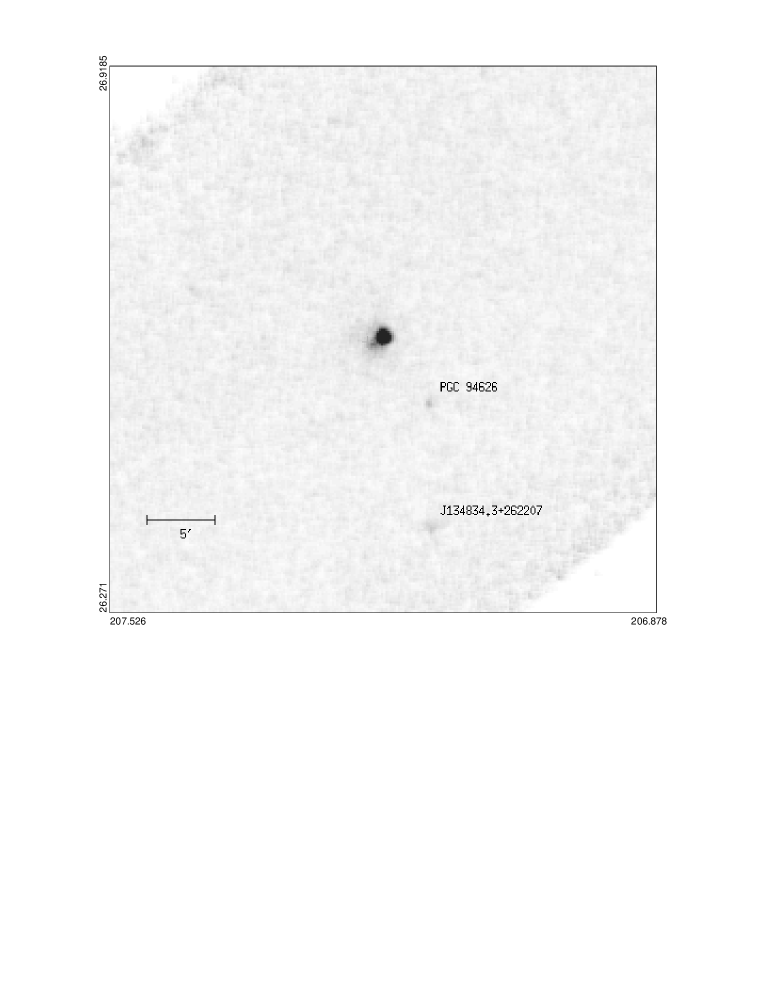
We added our two separate observations of Abell 1795 using the two extragalactic sources as fiducials. The resultant image is shown in Figure 2. A bright source is evident in this image northwest of the center of the cluster. Examination of other unrelated images showed no detector flaws at this location and this source does not appear in the previous observation of this cluster. The radial profile of this emission shows the source to be to the point spread function of the telescope and is consistent with a point source. A time profile of the count rate suggests the emission is the result of a transient source. As improbable as this seems, we conclude a transient EUV source appeared at this location in the sky at the time our observations were carried out.
We have compared our new data on Abell 1795 with the archival data on this cluster and find that our results at (which excludes the effects of the bright point source in our new data set) are identical within the counting errors, confirming the validity of the original data set used by Mittaz et al. (1998). Because the two data sets are identical and the more recent set is contaminated with a point source, we have used the archival data on Abell 1795 for our subsequent analysis.
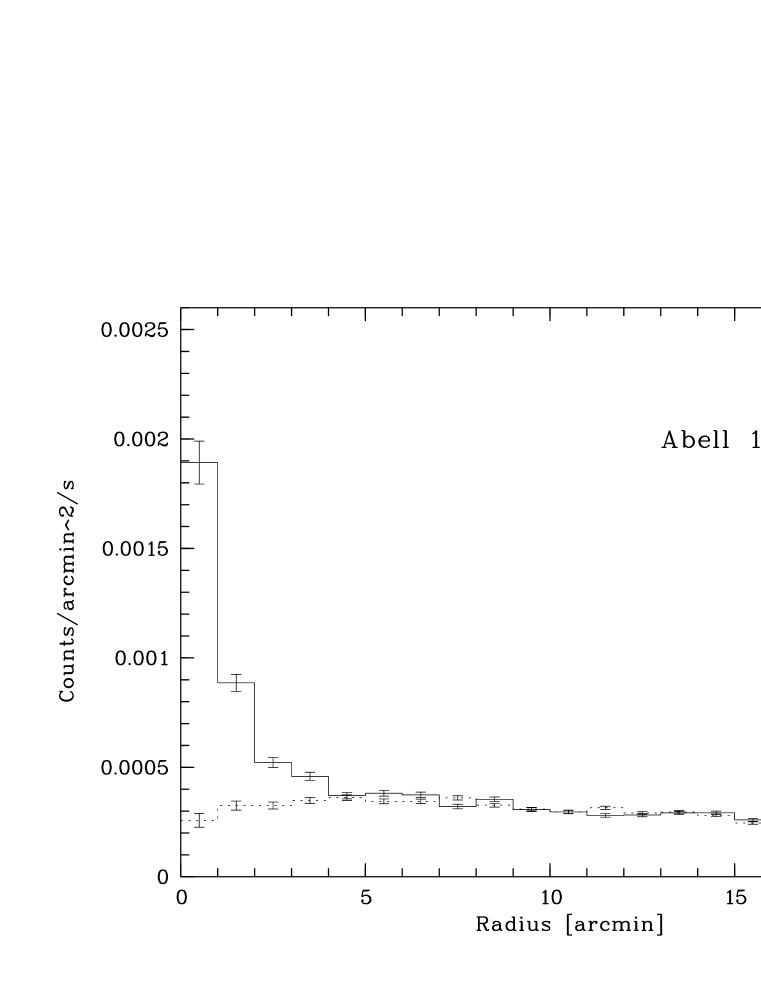
We derived the azimuthally averaged radial intensity profile of the EUV emission of the cluster as a function of projected radius from the central core assuming spherical symmetry. This profile is shown as a solid line in Figure 3. Our vignetted background is shown as a dotted line. It is visually apparent that there is no excess EUV emission at radii larger than 4′. It is also clear that an improperly chosen background chosen at would result in apparent emission at smaller radii simply because of the effects of the vignetted background in the DS telescope.
We next determined the expected intensity and distribution of the EUV emission expected from the X-ray emitting plasma. We used the X-ray radial emission profile provided by Briel & Henry (1996). This profile was derived from ROSAT PSPC observations of the cluster in the energy band between 0.5–2.4 keV. At larger radii this profile is well fit by a King (1972) profile with and describes the large scale cluster X-ray emission with a temperature of 6.7 keV. The ROSAT observations also show a central excess emission within . Briel & Henry (1996) obtained a temperature of 2.9 keV for this excess. We derived conversion factors for counts in the 0.5–2.4 keV band of the ROSAT PSPC to EUVE DS counts using these plasma temperatures. Our derivation employed the MEKAL plasma emission code with abundances of 0.3 solar. For a temperature of 6.7 keV we obtained a conversion factor of 126; the value for 2.9 keV was 111. We found that varying the temperatures by 1 keV or using different abundances only affect these conversion factors by a few percent and thus changes of this nature would not significantly alter our results. We found that a deprojection of the emission components which takes into account the emission measures and sizes of the different components leads to the same result.
The correction for the intervening absorption of the ISM in our Galaxy will have a substantial impact on our results. Many workers simply apply the cross sections of Morrison & McCammon (1983) or Balucińska-Church & McCammon (1992) for this correction, but there are several problems with this approach. The Hei absorption coefficient in this work is incorrect (Arabadjis & Bregman 1999). In addition, the ionization state of the ISM will substantially affect the result. The ISM absorption at EUV energies is primarily due to Hi , Hei , and Heii ; the metals in the list of Balucińska-Church & McCammon (1992) provide less than 30% of the absorption at wavelengths greater than 50 , and less than 10% at wavelengths greater than 100 , and none of the Galactic ISM is in the form of Heiii (see discussion below). Hence in general terms the absorbing material and related factors are given by:
| (2) |
| (3) |
| (4) |
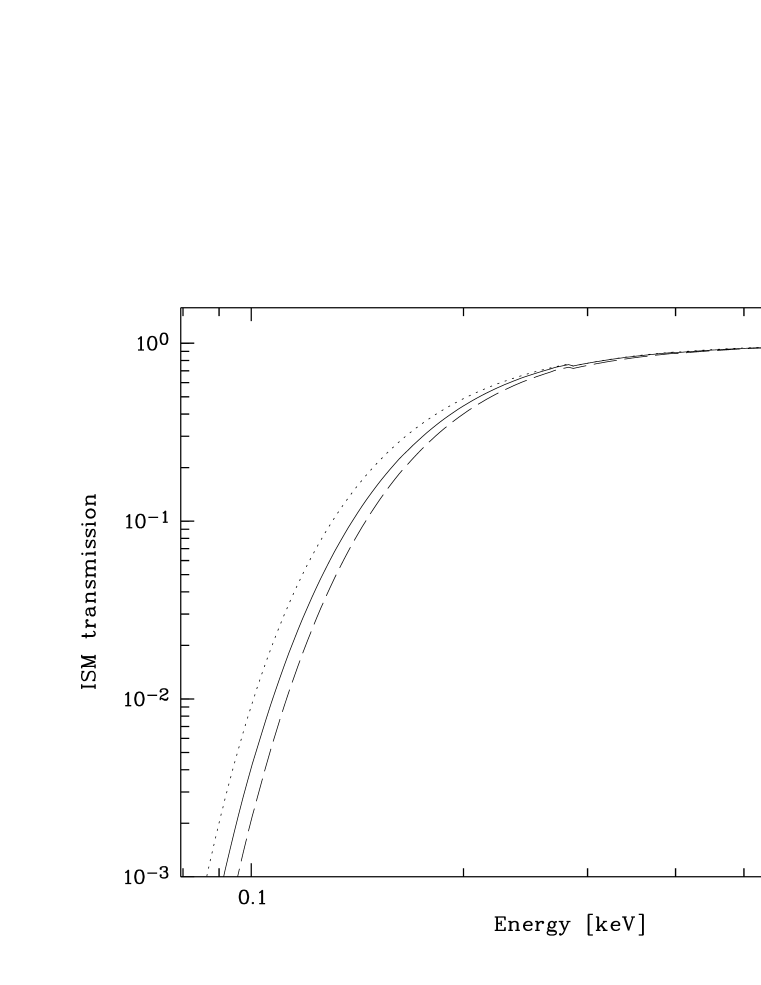
We have calculated the Galactic ISM absorption using these columns with Hi cross sections of Rumph et al. (1994), Hei cross sections from Yan et al. (1998), and Heii cross sections from Rumph et al. In Fig. 4, we compare the nominally applied cross sections of Balucinska-Church & McCammon (1992) and Morrison & McCammon (1983) with the cross section used herein which includes the improved cross section for Hei and the ionization fractions as described. We used these values with an improved estimate of the Galactic neutral hydrogen column density in the direction of Abell 1795 of N(HI) = cm-2 (J. Lockman, private communication) . We assume the total helium is 10% of the total hydrogen column. A direct measurement of the Hii column can be obtained, in principle, from measurements of the flux in this direction (Reynolds et al. , 1998). Unfortunately, only an upper limit to this flux of is currently available (Haffner, private communication). A reasonable estimate for the Hii column, based on all the available data, is that it is close to this upper limit (Reynolds, private communication). Consequently we have used this value for the Hii column. The amount of Heii in this direction can be obtained from Fig. 1 of Bowyer et al. (1996). For A1795, , , and .
The absorption corrected results for A1795 are shown in Figure 5. The observed EUV emission is less than that produced by the x-ray plasma. This appears to be unphysical but is simply understood as discussed below.
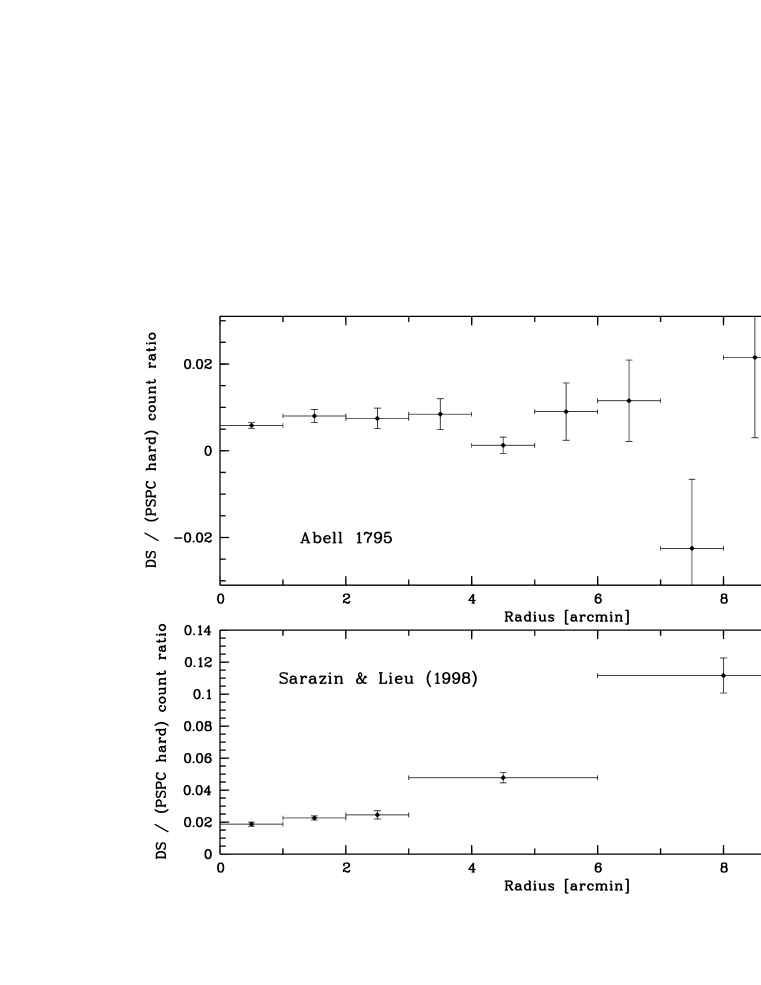
In Figure 6a we show the ratio between our background subtracted EUV radial emission profile and the X-ray profile obtained with the ROSAT PSPC. Within the inner 4′ this ratio is almost constant. At larger radii the ratio is consistent with zero within the errors, confirming the EUV signal is absent leaving only background noise. For comparison, Figure 6b shows the DS to PSPC count rate ratio as a function of radius obtained by Mittaz et al. (1998) and used by Sarazin & Lieu (1998).
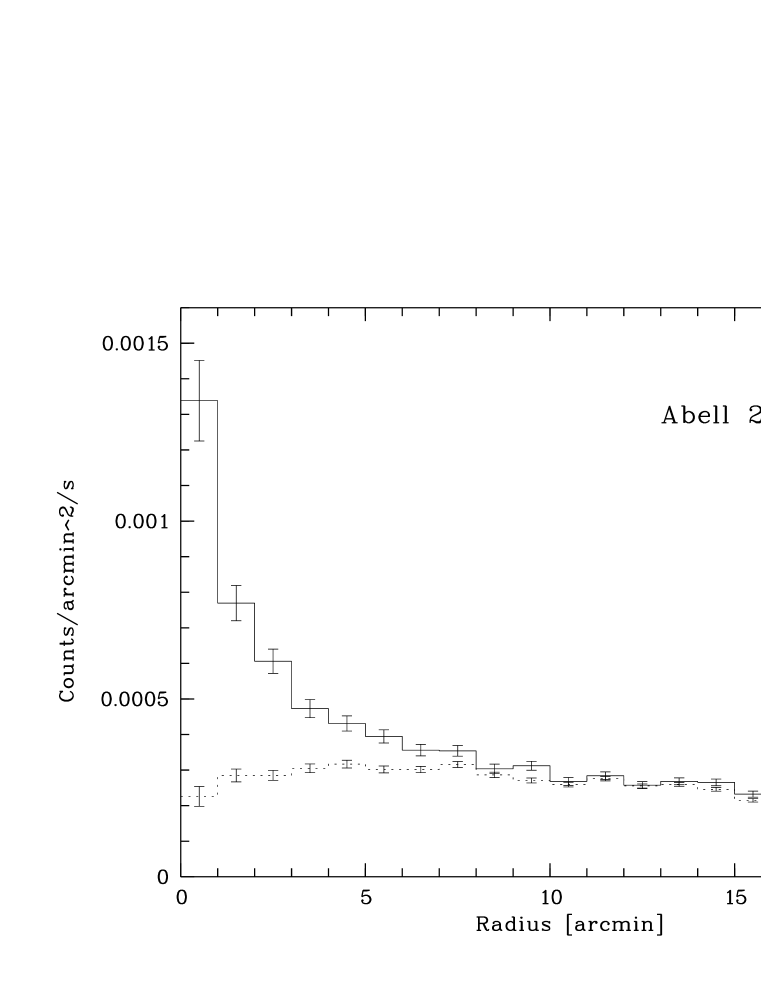
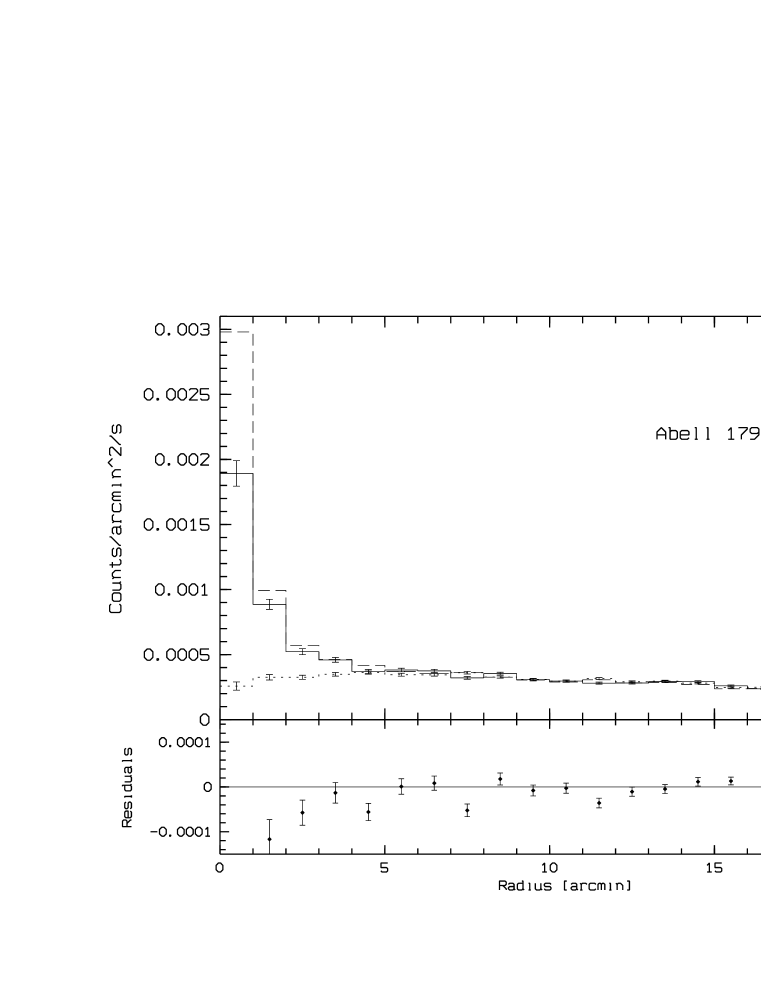
In view of the similarity between the distribution of the EUV emission reported for Abell 1795 and Abell 2199 (Lieu, Bonamente, and Mittaz 1999b), we examined archival data on Abell 2199 to ascertain whether a vignetted background could have produced an artificial extended diffuse EUV halo in this cluster. In Figure 7 we show the radial profile of the raw EUV data and the vignetted background for Abell 2199. It is apparent that there is no excess EUV emission beyond 8 ′. We use the results of Siddiqui, Stewart, and Johnstone (1998) to model the EUV emission from the X-ray gas in the cluster. They found T(core) = 2.9 keV and T(outer) = 4.08 keV. The conversion of the ROSAT X-ray count rates into EUVE DS count rates has been done as described for Abell 1795. For Abell 2199 we found DS to PSPC hard band count rate ratios of 83 for T = 2.9 keV and 89 for T = 4.08 keV. Absorption by the Galactic ISM was accounted for using N(Hi ) of (Lieu, et al. 1999a) with ionization fractions and cross sections as described previously. The results are shown in Fig. 8 as a dashed line. Again, the expected EUV emission from the X-ray gas is larger than the observed flux.
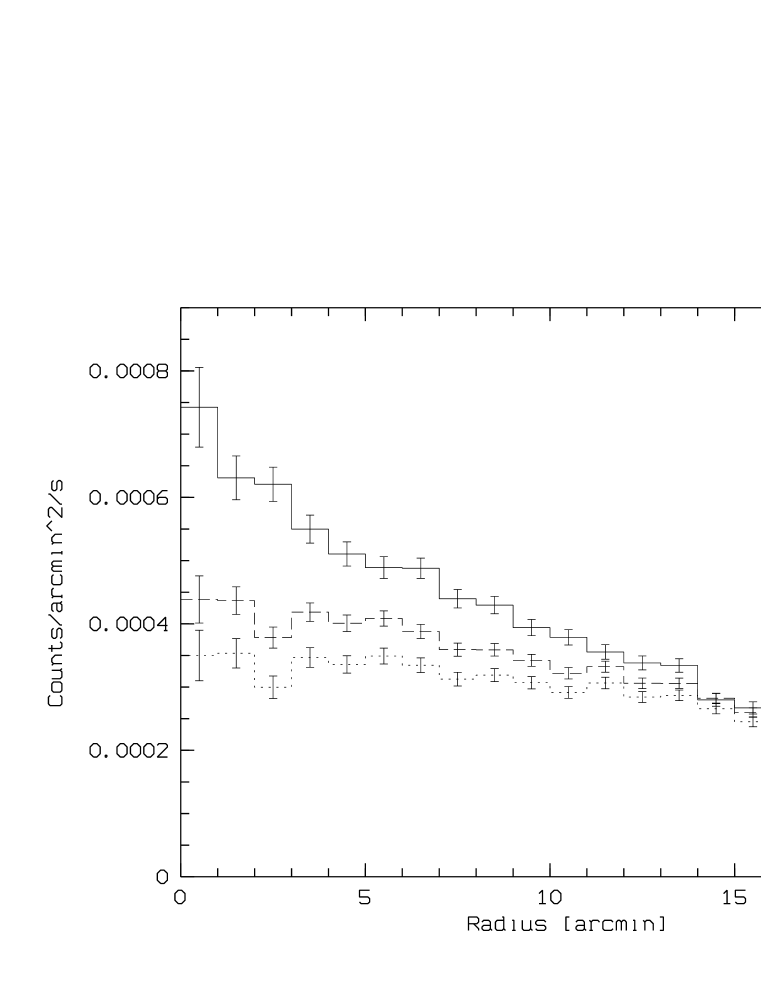
Because of these surprising results, we re-examined the previously reported EUV excess in the Coma cluster. We carried out our analysis using both of the existing DS images of this cluster. Because of the different roll orientation and pointing position in these images, it was necessary to carry out our analysis on each image individually. The results were then summed and the EUV emission and vignetted background are shown in Figure 9 as a solid and dotted line respectively. In this figure, we have fit the vignetted background to the Coma observations beyond 17′; however, because faint emission due to the cluster probably extends past this point, especially in the direction of the NGC 4874 subcluster, this is likely to be a slight overestimate of the background and hence the excess EUV emission we derive may be a slight underestimate. If the X-ray profile of the Coma Cluster is used as a guide, we expect this effect to be small compared to the statistical errors in each radial bin.
The X-ray profile has been constructed using ROSAT PSPC archival data of Coma. We verified that our PSPC hard band cluster profile is consistent with the profile provided by Briel, Henry & Böhringer (1992) but includes the central excess associated with the galaxy group around NGC 4874. We assumed that this X-ray emission is due to a plasma at T = 9 keV (Donnelly et al., 1999) absorbed by a hydrogen column of (Lieu et al., 1996b) with ionization fractions and cross sections for Galactic ISM absorption as described above. Here we obtained a DS to PSPC hard band conversion factor of 112.
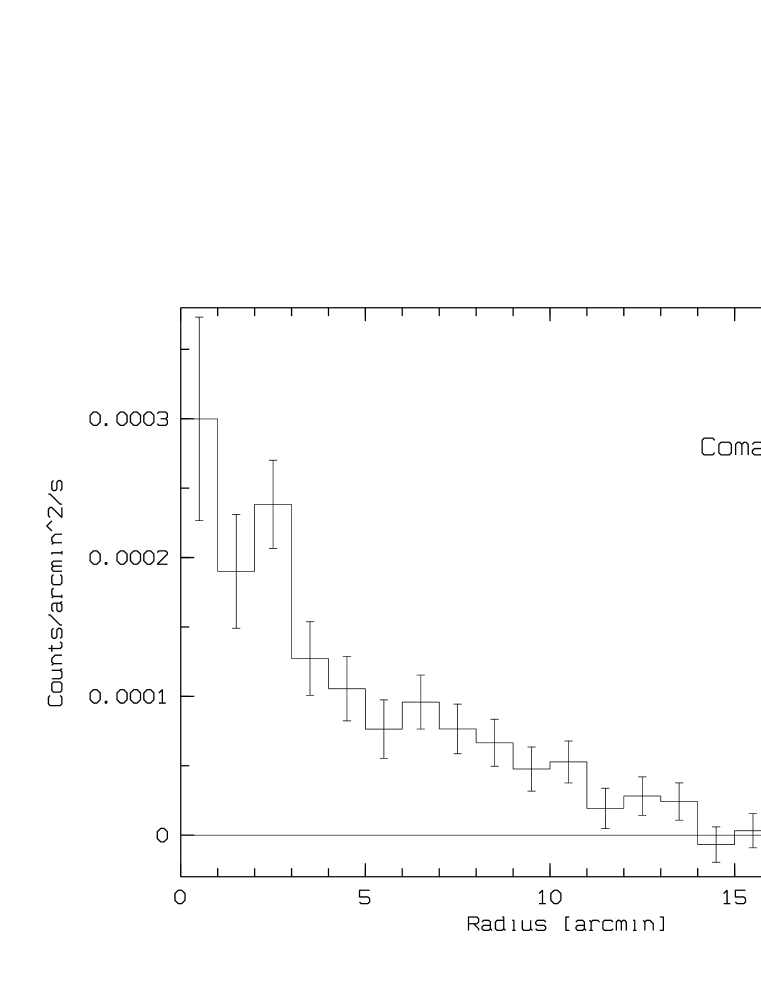
The residual EUV emission in excess of the expected contribution of the X-ray gas, shown in Figure 10, demonstrates that there is, indeed, excess EUV emission in the Coma cluster.
3 Discussion
The results of our new analysis show no excess EUV emission at radii larger than 4′ for Abell 1795 (Figure 4) and 8′ for Abell 2199 (Figure 7) contrary to previous work on these clusters. When we consider the inner regions for these clusters, we find the results are dependent upon a proper evaluation of the EUV emission from the X-ray plasma. When this emission is properly accounted for, the expected EUV emission from the X-ray plasma, shown in Figure 5 for Abell 1795 and in Figure 8 for Abell 2199, is less than is actually produced. This can be understood in terms of excess absorption within the cluster core. This effect has been noted in studies of X-ray cluster emission in cooling flows, where it is often reported that the hydrogen column density is larger in the core of the cluster. There is no observational evidence for more hydrogen in these regions, and neutral hydrogen is not expected in this environment. A reasonable explanation for this effect is that the X-ray reduction codes employed in these analyses require more absorption for a fit, and this is achieved blindly by adding more hydrogen with a standard admixture of non-ionized metals. It is more likely that in the cooler regions of the cooling flow, some metals are not completely ionized and these ions produce the extra absorption of the X-ray flux (Allen et al., 1996). This absorption would be even more substantial for the EUV flux, and would produce the effects seen in Figures 5 and 8. We point out that a study of the differing amount of absorption in the EUV and X-ray bands may provide sufficient information to identify the primary absorbing species.
When we employ our new analysis techniques with the data on the Coma cluster we find there is excess EUV emission in this cluster confirming the results of previous studies. However, the distribution and intensity of this flux differs in detail from that previously reported. The distribution of this radiation is shown in Figure 10, along with the count rate intensity. The intensity in physical units is (slightly) dependent upon the assumed spectral distribution of the flux. A source with a photon spectral index of 1.6 results in an EUV source luminosity of .
It is useful to consider why our results are different from those of Mittaz et al. (1998). While it is difficult to evaluate the details of another researchers’ analysis, it is clear that a key difference is our use of an observationally derived vignetted background. Mittaz et al. and Lieu et al. used the theoretical background function (Richard Lieu, private communication) which is essentially flat. In addition, these authors also carried out their analysis of the EUV flux without first removing the non-photonic background from their data. The extent to which this affects the results is not clear. Their approach to estimating the EUV emission produced by the X-ray plasma is also different than ours. Given these, and perhaps other unidentified differences, it is interesting to ask why both sets of analyses do show excess diffuse EUV emission in the Coma cluster. The primary explanation is that the Coma cluster does, in fact, have excess EUV emission. This emission is sufficiently extended that the effects of the vignetted background, though changing the details of the results, do not dominate as they do in Abell 1795 and Abell 2199.
We note that the Coma EUVE/soft X-ray results are confirmed by ROSAT data despite the claim by Arabadjis & Bregman (1999) that “there is no strong evidence for extremely soft X-ray excess in galaxy clusters.” They reach this conclusion using only ROSAT data and claim that an important issue that changes the previously published ROSAT findings is a new cross section of helium derived by Yan et al. (1998). Arabadjis & Bregman chose to parameterize the Galactic neutral hydrogen column in carrying out their analysis. We note that they require more than a deviation from measured values of this column in order to extinguish the Coma soft X-ray excess in the ROSAT data. The much more statistically robust EUVE results are not affected by the use of the Yan et al. cross sections.
We also note that Arabadjis & Bregman must have “at least 50 % of the He in the form of Heiii .” This is in direct conflict with established observational results. Heiles et al. (1996) obtained upper limits to Heii 268 and 269 lines at GHz, which rule out the possibility that any significant He III is present in the diffuse ISM. There is virtually no escape from this observational constraint (Heiles, private communication).
Our study suggests a possible reason why excess EUV emission has been found in every cluster examined to date with EUVE. Any point in the sky will show extended EUV emission using the analysis techniques employed in previous studies of clusters of galaxies.
4 Conclusions
We obtained new data on the cluster of galaxies Abell 1795 because of concerns that the original data set may have been compromised. We find, however, that these original data are valid. We investigated the effects of the telescope sensitivity variation over the field of view and found this was a key factor in investigating extended emission. We also used a detailed approach to the evaluation of the EUV flux produced by the X-ray gas in the core regions of this cluster. We then expanded our study by analyzing archival data on Abell 1795, Abell 2199, and the Coma cluster.
We find no evidence for excess EUV emission in Abell 1795 or Abell 2199. We do, however, confirm extended EUV emission in the Coma cluster although the distribution of this flux is different in detail from that previously reported. The fact that we do find extended EUV emission in the Coma cluster using our new analysis procedures confirms that an unidentified processes is operative in this cluster.
References
- (1) Allen, S., Fabian, A., Edge, A., Bautz, M., Furuzawa, A., & Tawara, Y. 1996, MNRAS, 283, 263
- (2) Arabadjis, J. S. & Bregman J. N. 1999, ApJ, 514, 607
- (3) Balucińska-Church, M. & McCammon, D. 1992, ApJ, 400, 699
- (4) Berghöfer, T. W., Bowyer, S., Lieu, R., & Knude, J. 1998, ApJ, 500, 838
- (5) Bowyer, S. & Malina, R. F. 1991, in Extreme Ultraviolet Astronomy, ed. R. F. Malina & S. Bowyer (New York: Pergamon), 397
- (6) Bowyer S., Lampton M., & Lieu, R. 1996, Science, 274, 1338
- (7) Bowyer S., Lieu, R., & Mittaz, J. P. 1998, in Proc. IAU Symp. 188, The Hot Universe, ed. K. Koyama et al. (Dordrecht: Kluwer), 185.
- (8) Bowyer,S. & Berghöfer, T. W. 1998, ApJ, 506, 502
- (9) Briel, U. G., Henry, J. P. & Böhringer, H. 1992, A&A, 259L, 31
- (10) Briel, U. & Henry, J. P. 1996, ApJ, 472, 131
- (11) Cen, R. & Ostriker, J. 1999, ApJ, in press
- (12) Donnelly, R. H., Markevitch, M., Forman, W., Jones, C., Churazov, E., & Gilfanov, M. 1999, ApJ, in press
- (13) Enßlin, T. & Biermann, P. 1998, A&A, 330, 96
- (14) Enßlin, T., Lieu, R., & Biermann, P. 1999, A&A, in press
- (15) Fusco-Femiano, R., Dal Fiume, D., Feretti, L., Giovannini, G, Matt, G., Molendi, S., & Santangelo, A. 1999, ApJ, 513, L21
- (16) Heiles, C., Koo, B. C., Levenson, N., & Reach, W. 1996, ApJ, 462, 326
- (17) Hwang, C.-Y. 1997, Science, 278, 1917
- (18) King, I. 1972, ApJ, 174, L123
- (19) Korpela, E.,& Bowyer S. 1998, ApJ, 115, 2551
- (20) Lieu, R., Mittaz, J., Bowyer ,S., Lockman, F., Hwang, C.Y., & Schmitt, Y. 1996a, ApJ, 458, L5
- (21) Lieu, R., Mittaz, J., Bowyer, S., Breen, J., Lockman, F., Murphy, E., & Hwang, C.Y. 1996b, Science, 274, 1335
- (22) Lieu, R., Ip, W-H., Axford, W., & Bonamente, M. l999a, ApJ, 510 , L25
- (23) Lieu, R., Bonamente, M., & Mittaz, J. 1999b, ApJ, 517, L91
- (24) Mittaz, J., Lieu, R., & Lockman, F. l998, ApJ, 498, L17
- (25) Morrison, R. & McCammon, D. 1983, ApJ, 270, 119
- (26) Rees, M. J. 1988, Nature, 333, 523
- (27) Rephaeli, Y., Gruber, D., & Blanco, P. 1999, ApJ, 511, 21
- (28) Reynolds, R. J., Tufte, S. L., Haffner, L. M., Jaehnig, K., & Percival, J. W. 1998, Pub. Astron. Soc. Aus., 15, 14
- (29) Rumph, T., Bowyer, S., & Vennes, S. 1994, AJ, 107, 2108
- (30) Sarazin, C. & Lieu, R. l998, ApJ, 494, L177
- (31) Siddiqui, H., Stewart, G., & Johnstone, R. 1998, A&A, 334, 71
- (32) Sirk, M. M., Vallerga, J. V., Finley, D. S., Jelinsky, P., & Malina, R. 1997, ApJS, 110, 347
- (33) Vallerga, J. & Roberts, B. 1997, CEA memo: EUVE/20/97
- (34) Yan, M., Sadeghpour, H., & Dalgarno, A. 1998, ApJ, 496, 1044