THE NGST AND THE ZODIACAL LIGHT
IN THE SOLAR SYSTEM
Abstract
We develop a physical model of the zodiacal cloud incorporating the real dust sources of asteroidal, cometary, and kuiperoidal origin. Using the inferred distribution of the zodiacal dust, we compute its thermal emission and scattering at several wavelengths (1.25, 5, and 20 m) as a function of NGST location assumed to be at 1 AU or 3 AU. Areas on the sky with a minimum of zodiacal light are determined.
1 Physical model for zodiacal thermal radiation and scattering
Improvements in the zodiacal light emission and scattering to be given by space observations at 3 AU, compared with observations near the Earth, were discussed by Mather and Beichman (1996). Unfortunately, a rather accurate multi-parametric model of the zodiacal brightness derived by Kelsall et al. (1998) from the COBE data cannot be reliably extrapolated to heliocentric distances as large as 3 AU. We have developed a physical model of the zodiacal cloud incorporating the real dust sources of asteroidal and cometary origin, which makes it possible to evaluate quantitatively the zodiacal light emission and scattering throughout the Solar system (Gorkavyi et al. 1997a). This model considerably improves our previous ‘reference model’ based on the use of the continuity equation for distribution function of dust particles (Gorkavyi et al. 1997b,c, 1998) and enables us to obtain more reliable results than a phenomenological modelling of the zodiacal light (e.g. Ebbets 1998). Below, we describe an improved model that represents a 3D-grid containing cells with a step in (heliocentric latitude , longitude , and radius ) to be [AU]). Using a new numerical approach to the dynamics of minor bodies and dust particles, we increase the number of particle positions employed in each model to without using a supercomputer (Ozernoy et al. 2000, Gorkavyi et al. 2000). We compute here the distribution of the zodiacal dust emission and scattering in the Solar system. The processes influencing the dust particle dynamics include gravitational scattering on all planets, except Pluto (inclinations and precession of the planets are neglected), mean motion resonances, and the Poynting-Robertson/solar wind drags.
We employ here 931 sources of dust particles (with eccentricities ), which include 284 asteroids, 451 short-period comets, and 196 Kuiper belt objects. We adopt a two-component approximation for dust particle size distribution, which is characterized by the parameter and 0.057 for (1-2)m and (5-10)m particles, respectively.
The inferred dust density distribution, , of the IPD at heliocentric distances AU enables us to compute the scattered light and the thermal emission of the zodiacal cloud as a function of the observer’s latitude and longitude.
The thermal emission and scattering of the zodiacal cloud are given by:
where is the Planck function at frequency , is albedo, is the dust temperature, with K and (Kelsall et al. 1998), is the solar flux, is the phase function at scattering angle (Kelsall et al. 1998).
Note that although the phase function only weakly depends on , the value of strongly depends on through the solar flux. Besides, the Planck function strongly depends on heliocentric distance, especially in the near IR (1-5 m).
2 The zodiacal light at R=1 and 3 AU
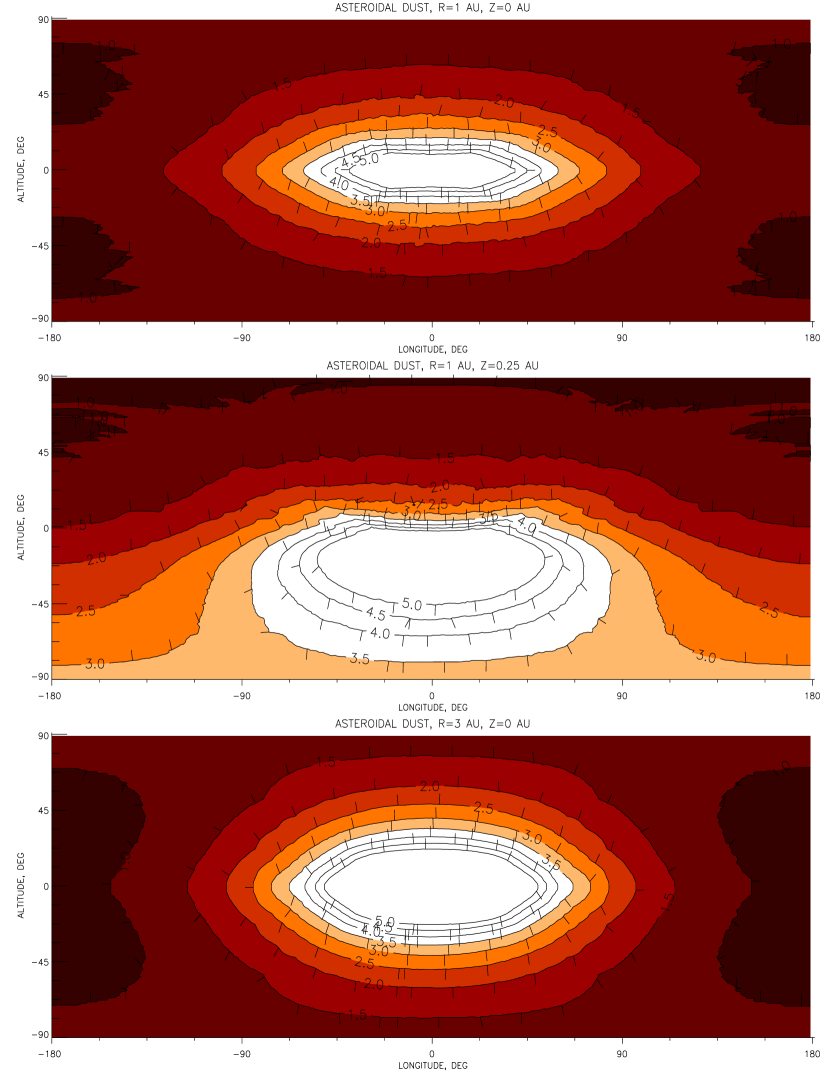
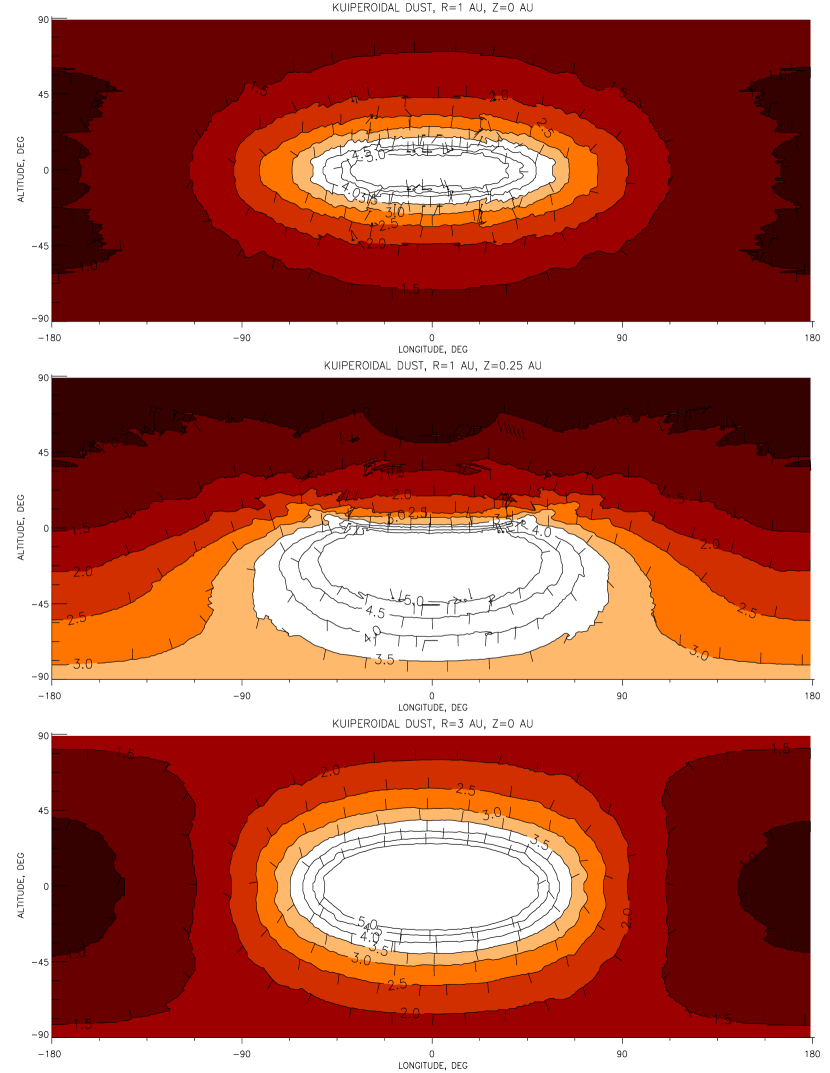
Using the inferred distribution of the zodiacal dust, we have computed a variety of zodiacal light maps, both for thermal emission and scattered components, at different locations of the NGST assumed to be at 1 AU or 3 AU (see Fig. 1 for the m-emission of asteroidal dust and Fig. 2 for that of kuiperoidal dust). The brightness as a function of latitude and longitude (in the telescope’s frame) is given in logarithmic scale (the neighboring contour intensities differ by ). The Sun’s position is (0,0) for and is shifted to a negative for AU.
At each location, there is a minimum in the zodiacal light which can be seen as a ‘dark spot’ (or several spots) in the computed Figures. The positions of those minima are explained by an interplay between dependencies of emissivity upon density and temperature.
Our numerical results concerning the computed zodiacal light at different locations of NGST are summarized in Tables 1 and 2. The data presented in Table 2 for AU, 2nd column can be compared with the COBE data (1.25m band), (5m band), and (20m band). Interestingly, it is the kuiperoidal component (k1) whose shape resembles most closely the profile of the zodiacal cloud, which might imply that the role of kuiperoidal particles has been highly underestimated so far.
| Origin/Size | # of sources\tablenotemarka | # of particles | # of particles | # of positions |
|---|---|---|---|---|
| of dust particles | with at \tablenotemarka | near Earth\tablenotemarka | in our 3D-model | |
| \tableline | ||||
| asteroidal/1m (a1) | 110+110 | 110+110 | 57+85 | |
| cometary/1m (c1) | 2128+112 | 276+112 | 73+78 | |
| kuiperoidal/1m (k1) | 100+100 | 96+100 | 11+12 | |
| asteroidal/5m (a5) | 32+32 | 32+32 | 32+32 | |
| cometary/5m (c5) | 61+3 | 60+3 | 40+2 |
aPericentral start apocentral start
AU, AU AU, AU
AU, AU
0\tablenotemark*
2\tablenotemarkb
3\tablenotemarkc
4\tablenotemarkd
5\tablenotemarke
1\tablenotemarka
2\tablenotemarkb
3\tablenotemarkc
4\tablenotemarkd
5\tablenotemarke
1\tablenotemarka
2\tablenotemarkb
3\tablenotemarkc
4\tablenotemarkd
5\tablenotemarke
\tableline
m band
a1
4.8
3.2
.92
74
.20
1.7
1.3
.20
87
.068
.29
.11
.063
74
c1
1.9
1.2
.91
75
.42
1.9
1.4
.42
89
.058
.13
.083
.052
54
k1
3.9
2.7
.95
73
.17
2.0
1.8
.16
89
.050
.55
.60
.046
87
a5
7.3
5.0
.90
74
.073
1.1
.95
.073
88
.018
.059
.018
.012
45
c5
1.6
1.0
.87
30
.54
1.5
1.0
.55
89
.045
.068
.046
.035
57
m band\tablenotemarkf
a1
2.9
1.0
.79
41
.18
.79
.31
.16
82
.69
1.8
.49
.46
38
c1
1.3
.44
.44
6
.38
1.2
.41
.32
64
.53
.67
.20
.20
8
k1
2.3
.76
.74
39
.16
.80
.29
.15
89
.44
.72
.20
.20
10
a5
4.9
1.8
.87
67
.066
.52
.22
.061
81
.19
.54
.11
.11
45
c5
1.2
.41
.40
14
.49
1.1
.36
.30
14
.42
.49
.13
.13
8
m band
a1
5.2
2.7
.97
74
.22
1.9
1.2
.21
82
.10
.44
.18
.097
74
c1
2.0
1.0
.95
73
.46
2.0
1.1
.45
89
.083
.18
.084
.068
42
k1
3.8
1.9
.95
83
.18
1.9
1.1
.17
89
.069
.35
.23
.064
79
a5
8.7
4.4
.99
83
.086
1.4
.83
.085
88
.029
.095
.023
.018
45
c5
1.7
.81
.77
16
.59
1.6
.77
.59
89
.066
.096
.039
.039
7
*Type of dust listed in Table 1.
\tablenotetextaintensity at the north pole,
\tablenotetextbintensity at the ecliptic plane in the direction of
from the Sun,
\tablenotetextcintensity at the ecliptic plane in anti-sun direction,
\tablenotetextd, where
is the latitude at which the zodiacal light brightness
is minimal in the anti-sun direction ()
\tablenotetexte [∘]
\tablenotetextfAll m-intensities at AU, need to be
multiplied by
3 Conclusions
1. The structure of the zodiacal dust cloud computed in the present work is substantially non-uniform:
(i) near the Earth, the thickness of the dust layer is the largest for cometary particles and the smallest for asteroidal particles, with kuiperoidal particles occupying an intermediate position;
(ii) the larger the size of asteroidal dust particles, the thinner is the layer comprised of such particles; for cometary particles a reverse, although a weaker, dependence takes place;
(iii) the partial contribution of particles of different origin and size changes with heliocentric distance: as the distance increasess, the contribution of asteroidal particles (especially of large size) into the zodiacal light emission sharply decreases, whereas the contribution of the kuiperoidal component increases;
(iv) The latitudinal dependence of the zodiacal emission is different for different components of the dust cloud. In the anti-sun direction (), the maximum of the asteroidal dust emission at m is reached at the ecliptic plane, whereas the brightness of the cometary component has its minimum here.
2. Observations made from AU, AU at all wavelengths would detect the brightness of the zodiacal light in the direction of the pole at level of 20-30% of that seen near the Earth.
3. At AU, the zodiacal light brightness in the direction of the pole decreases to % at m; to % at m, and to % at m compared to that seen near the Earth.
4. At each wavelength, there are certain regions on the sky having a minimal zodiacal light brightness. At short wavelengths (m), these regions are around the poles, and at long wavelengths (such as 5 to 20 m) these regions are shifted toward the ecliptic. This result needs to be taken into consideration while planning observations with NGST.
5. Further improvements in our physical modelling of the zodiacal light are feasible. Using COBE and IRAS data, the contribution of dust components of different origin into the zodiacal cloud could be determined. Those improvements would make far going implications possible for extragalactic astronomy and cosmology.
Acknowledgements.
This work has been supported by NASA grant NAG5-7065 to George Mason University. N.G. acknowledges the NRC-NAS associateship. References Ebbets, D. 1998, “Zodical Light Model for NGST Studies”. (unpublished) Gorkavyi, N.N., Ozernoy, L.M., & Mather, J.C. 1997a, ApJ 474, 496 Gorkavyi, N.N., Ozernoy, L.M., Mather, J.C. & Taidakova, T.A. 1997b, BAAS 29, 1310 ——– 1997c, ApJ 488, 268 ——– 1998, Earth, Planets and Space, 50, 539 ——– 2000, Planetary and Space Science (submitted) Kelsall, T. et al. 1998, ApJ 508, 44 Mather, J.C. & Beichman, C.A. 1996, “Unveiling the Cosmic Infrared Background”, Ed. E. Dwek, p. 271 Ozernoy, L.M., Gorkavyi, N.N. & Taidakova, T.A. 2000, Icarus (submitted)