Discovery of an X-Ray Pulsar in the SMC: AX J00587203
1. Introduction
X-ray binary pulsars (here XBPs) constitute a bright class of X-ray sources in the sky, and have been major objects for X-ray astronomy. Sporadic mass accretion from a companion star onto a spinning neutron star makes this class to be variable X-ray sources. X-ray binaries with a Be star companion (here Be-XBPs) are the most variable subclass; occasional outbursts may be caused by mass-ejection episodes of a companion Be star or by encounters with a dense stellar wind region along with a highly eccentric orbit of a neutron star. The average luminosity is generally lower than ordinal XBPs, and is typically in the range of – erg s-1. This moderate luminosity together with a limited duty ratio of the outbursts has prevented us to perform a complete survey of this class with the conventional non-imaging instruments. The imaging instruments on-board the Einstein and ROSAT satellites greatly improved the detection threshold. Since XBPs (also Be-XBPs) generally exhibit a hard X-ray spectrum, contemporary hard X-ray satellites, ASCA (Advanced Satellite for Cosmology and Astrophysics), RXTE (Rossi X-ray Timing Explorer), and Beppo-SAX, further enhance the detection probability for this class of X-ray sources (XBPs and Be-XBPs).
In fact, multiple observations of the Small Magellanic Cloud (SMC) caused a rush of X-ray pulsar discoveries (Yokogawa et al. 1999). Among the known 16 X-ray pulsars in the SMC at present (Bildsten et al. 1997; Kahabka et al. 1999; Lamb et al. 1999; Macomb et al. 1999), 13 have been discovered within 1.5 years: from the end of 1997 to the middle of 1999. Most are considered to be Be-XBPs based on their transient nature and/or an optical Be counterpart.
We report here on the discovery and analysis of AX J00587203, one of the newly discovered pulsars during the pulsar rush episode (Yokogawa, Koyama 1998). We also examine the flux variability using the archives of ASCA and ROSAT, and propose to classify this source as a Be star binary system in the SMC.
2. Observations
ASCA observed a SMC region centered at R.A., Dec. (equinox 2000) on 1997 November 14 to 15, during the AO-6 cycle. The primary target of this observation was N66, one of SNRs in the SMC region. Details concerning the ASCA satellite as well as its instruments (GIS: Gas Imaging Spectrometer, SIS: Solid-state Imaging Spectrometer) and X-ray telescope (XRT) can be found in Tanaka et al. (1994), Ohashi et al. (1996), Makishima et al. (1996), Burke et al. (1991) and Serlemitsos et al. (1995). As is the nominal case, two GISs (GIS 2, 3) and SISs (SIS 0, 1) were operated in parallel.
AX J00587203 was in the field of view of the GISs and SISs at off-axis positions. We excluded the data taken during the South Atlantic Anomaly or at an elevation angle less than or the passage through a region where cut-off rigidity is lower than 6 GeV. In addition, we employed a rise-time discrimination technique to reduce particle events for the GIS data. After these filterings, the net exposure times were 35 ks for GIS and 31 ks for SIS.
3. Results and Analysis
3.1. X-Ray Image and Source Identification
A combined GIS image (GIS 2 + GIS 3) is shown in figure 1. The accurate position of this source was determined using two SIS images (SIS 0 and 1) to be R.A., Dec. with an error circle of in radius (Gotthelf 1996; ASCA News 4, 31), hence, we designate this source as AX J00587203. Two other X-ray pulsars are serendipitously located in the GIS field: 1SAX J0054.97226 with a pulsation periodof 58.969 s (Santangelo et al. 1998) at the top left and 1SAX J0103.27209 with a pulsation period of 345.2 s (Israel et al. 1998) at the bottom right of figure 1. This demonstrates an extremely high density of X-ray pulsars of the central region of the SMC.
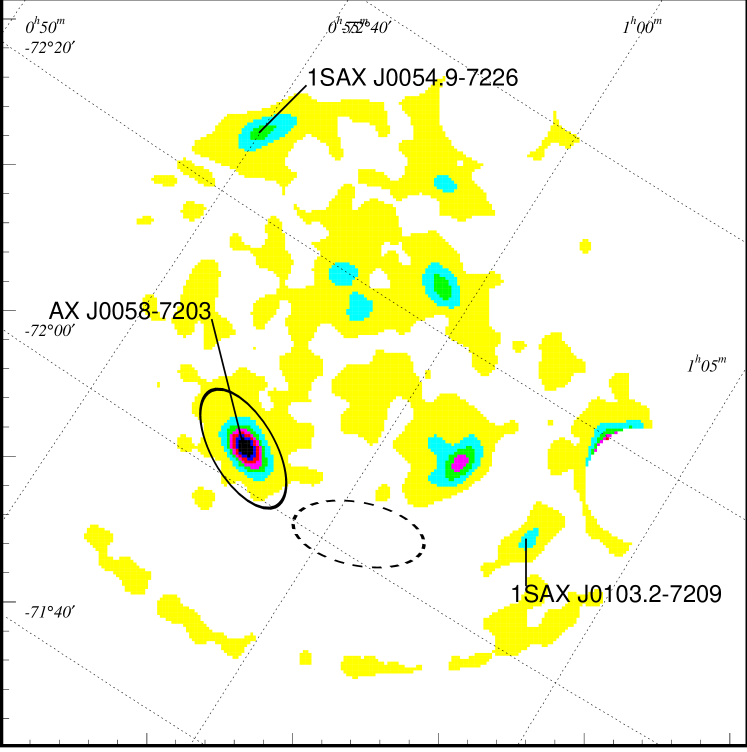
For source identification, we checked two comprehensive SMC source catalogs provided by Wang and Wu (1992) with Einstein observatory, and by Kahabka et al. (1999) with ROSAT observatory. Source No. 41 (SMC 0056.27219) in the former catalog and source No. 124 (RX J0057.87202) in the latter one are found to be located within the error circle of AX J00587203.
3.2. Temporal Analysis
The X-ray photons of AX J00587203 were extracted from the elliptical regions, as is indicated by the solid line in figure 1 for both the GIS and SIS data. We first confirmed that there was no flaring event nor any trend of flux variation during the observation. After a barycentric correction of the photon-arrival times, we conducted a Fast Fourier Transform (FFT), in order to search for any coherent periodicity. Figure 2 shows the power spectrum for the GIS data in the 0.7–7.0 keV band. We found two significant peaks at Hz and Hz. The chance probabilities to obtain these two peaks are estimated to be and , respectively. Since the frequency ratio between the two peaks is exactly double, we infer the lower frequency peak to be the fundamental period of s and the higher to be the second harmonics.

We then employed a folding technique to the GIS and SIS data around a trial period of s, and found the most likely period to be s. The folded pulse profile of 280.4 s period is given in figure 3. In the pulse profile, we can see two peaks, as was already expected from the power spectrum. Since the intensity of the main peak is about twice larger than that of the sub-peak, we conclude that 280.4 s is really the fundamental pulse period. The two-peak pulse profile does not change with the X-ray energy. The pulse fraction, defined as , where and are the maximum and the minimum count rate including background photons, is 61% in the soft band (0.7–2.0 keV) and 48% in the hard band (2.0–7.0 keV). We also divided the full observation data into two data sets, the former half and the latter half, then separately applied the folding technic, but found no significant changes of the pulsation period over the observation period.

3.3. Spectral Analysis
Using the same source data as in the timing analysis (solid line in figure 1) and subtracting the background data in the dotted-line region in figure 1, we constructed the GIS and SIS X-ray spectra separately, showing the result in figure 4 with filled squares and circles, respectively. For our spectral analysis, both the GIS and SIS data in the energy band from 1.0 keV to 8.0 keV were binned so that each bin has at least 40 photons, and were fitted simultaneously.
For the continuum emission, we applied a power-law model with interstellar absorption, which is the “standard” model for X-ray binary pulsars (Nagase 1989), and obtained an acceptable fit. The best-fit parameters are given in table 1.
In figure 4, we can see a hint of excess at the energy of the K line of He-like aluminum. To investigate the existence of this line emission, we fitted the spectrum with the absorbed power law with a Gaussian line centered at 1.59 keV (K line of He-like aluminum). However, the significance level of this emission is less than 1- level. We also fitted the spectrum with the line-center variable, but no significant emission line (more than 1- level) was found.
The X-ray flux in the 0.7–10.0 keV band is calculated to be erg cm-2 s-1 based on the best-fit parameters, which indicates an absorption-corrected luminosity of erg s-1, assuming the distance to the SMC to be 60 kpc (Mathewson 1985).

4. Discussion
A long pulse period and a rather flat spectrum indicate this source to be an accretion-powered binary pulsar with a high-mass companion (Nagase 1989). Among high-mass binary pulsars with various types of optical companion, binary systems of an X-ray pulsar with a Be star share the transient nature which is exclusively found in this subclass (Stella et al. 1986).
Thus, information concerning the long-term flux variability of this source is critical to reveal its nature. We therefore used ROSAT and Einstein archival data which cover the region of AX J00587203 to search for its history of variability. The count rate, or upper limit, from this source are summarized in table 2 together with the ASCA result.
¿From table 2, we find that AX J00587203 shows a variation of more than 10 times in flux, which favors AX J00587203 to be a Be star binary pulsar. Due to limited data from this source the Be star interpretation still remains preliminary; hence, follow-up observations invollving long-term pulsation monitoring and optical identification of a companion star are encouraged.
We thank all members of the ASCA team. This research has made use of data obtained through the High Energy Astrophysics Science Archive Research Center Online Service, provided by the NASA/Goddard Space Flight Center. J.Y. is supported by JSPS Research Fellowship for Young Scientists.
References
Bildsten L., Chakrabarty D., Chiu J., Finger M.H., Koh D.T., Nelson R.W., Prince T.A., Rubin B.C. et al. 1997, ApJS 113, 367
Burke B.E., Mountain R.W., Harrison D.C., Bautz M.W., Doly J.P., Ricker G.R., Danniels P.J. 1991, IEEE Trans. ED-38, 1069
Israel G.L., Stella L., Campana S., Covino S., Ricci D., Oosterbroek T. 1998, IAU Circ. 6999
Kahabka P., Pietsch W., Filipović M.D., Haberl F. 1999, A&AS 136, 81
Lamb R.C., Prince T.A., Macomb D.J., Finger M.H. 1999, IAU Circ. 7081
Macomb D.J., Finger M.H., Harmon B.A., Lamb R.C., Prince T.A. 1999, ApJ 518, L99
Makishima K., Tashiro M., Ebisawa K., Ezawa H., Fukazawa Y., Gunji S., Hirayama M., Idesawa E. 1996, PASJ 48, 171
Mathewson D.S. 1985, Proc. Astron. Soc. Aust. 6, 104
Nagase F. 1989, PASJ 41, 1
Ohashi T., Ebisawa K., Fukazawa Y., Hiyoshi K., Horii M., Ikebe Y., Ikeda, H., Inoue H. et al. 1996, PASJ 48, 157
Santangelo A., Cusumano G., Israel G.L., Fiume D.D., Orlandini M., Frontera F., Parmar A.N., Marshall F.E. et al. 1998, IAU Circ. 6818
Serlemitsos P.J., Jalota L., Soong Y., Kunieda H., Tawara Y., Tsusaka Y., Suzuki H., Sakima Y. et al. 1995, PASJ 47, 105
Stella L., White N.E., Rosner R. 1986, ApJ 308, 669
Tanaka Y., Inoue H., Holt S.S. 1994, PASJ 46, L37
Wang Q., Wu X. 1992, ApJS 78, 391
Yokogawa J., Imanishi K., Tsujimoto M., Nishiuchi M., Koyama K., Nagase F., Corbet R.H.D. 1999, ApJ submitted
Yokogawa J., Koyama K. 1998, IAU Circ. 6853
Table 1. Best-fit parameters of the spectrum.
| Detector | Photon index† | Absorption† | Reduced (d.o.f.) |
|---|---|---|---|
| cm | |||
| GIS | 0.60 (26) | ||
| SIS | 1.08 (14) | ||
| GISSIS | 0.72 (40) |
Errors are for 90% confidence level.
Table 2. Flux history of AX J00587203.
| Satellite | Detector | Date | Count rate† | Predicted X-ray flux† ‡ |
|---|---|---|---|---|
| cnts s-1 | erg cm-2 s-1 | |||
| Einstein | IPC | 1979/11/13 | (1.0 0.1) | (5.4 0.5) |
| 1980/03/15 | 1.9 | 1.0 | ||
| ROSAT | PSPC | 1991/10/08 | (3.3 0.9) | (6.4 1.8) |
| 1992/04/17 | 1.7 | 3.3 | ||
| 1993/03/29 | 1.2 | 2.4 | ||
| 1993/05/12 | (8.4 11.5) | (1.6 2.2) | ||
| 1993/10/01 | (1.9 1.0) | (3.7 2.0) | ||
| 1994/05/05 | (2.8 1.5) | (5.4 2.9) | ||
| HRI | 1994/04/18 | 5.7 | 3.1 | |
| 1994/04/19 | 1.7 | 9.2 | ||
| 1994/10/05 | 4.9 | 2.6 | ||
| 1995/04/12 | (2.6 2.9) | (1.4 1.6) | ||
| 1995/04/13 | 8.5 | 4.6 | ||
| 1995/04/14 | 1.0 | 5.4 | ||
| ASCA | GIS | 1997/11/14 | 1.4 | 3.2 |
Count rate with 1- error in a circle of
radius around the source position, after subtracting
the background count rate taken in a neighboring off-source
region. Upper limits for 1- significance level are given
for observations in which the source was not detected.
X-ray flux 1- error in the 0.7–10.0 keV is
simulated from the count rate by the pimms software,
assuming no change from the ASCA spectrum. For those not detected,
the upper limit is given. The ASCA result, together with the count
rate, is also shown at the last row.