Stellar Populations of the Sagittarius Dwarf Irregular Galaxy
Abstract
We present deep CCD photometry of the stars in the dwarf irregular galaxy SagDIG. The color-magnitude diagrams of the measured stars in SagDIG show a blue plume which consists mostly of young stellar populations, and a well-defined red giant branch (RGB). The foreground reddening of SagDIG is estimated to be . The tip of the RGB is found to be at mag. From this the distance to this galaxy is estimated to be Mpc. This result, combined with its velocity information, shows that it is a member of the Local Group. The mean metallicity of the red giant branch is estimated to be [Fe/H] dex. This shows that SagDIG is one of the most metal-poor galaxies. Total magnitudes of SagDIG ( arcsec)) are derived to be mag, mag, mag, and mag, and the corresponding absolute magnitudes are mag, mag, mag, and mag. Surface brightness profiles of the central part of SagDIG are approximately fit by a King model with a core concentration parameter , and those of the outer part follow an exponential law with a scale length of 37 arcsec. The central surface brightness is measured to be mag arcsec-2 and mag arcsec-2. The magnitudes and colors of the brightest blue and red stars in SagDIG (BSG and RSG) are measured to be, respectively, mag, mag, mag, and mag. The corresponding absolute magnitudes are derived to be mag and mag, which are about one magnitude fainter than those expected from conventional correlations with galaxy luminosity.
[To appear in the Astronomical Journal in 2000]
[Also available from astro-ph/9910481]
1 Introduction
SagDIG (UGCA 438, UKS 1927–177) is a faint dwarf irregular galaxy discovered by Cesarsky et al. (1977) and Longmore et al. (1978). In the discovery papers, Cesarsky et al. (1977) and Longmore et al. (1978) estimated, using the brightest stars seen in the photographic plates, the distance to this galaxy to be 600 kpc and 1.1 Mpc, respectively. Since then SagDIG has been considered to be a member of the Local Group. It is known that SagDIG contains as much as of HI gas (Cesarsky et al., 1977; Longmore et al., 1978; Young & Lo, 1997). In addition, a few H II regions were detected by Strobel, Hodge, & Kennicutt (1991). The metallicity of an extended H II region in SagDIG has been estimated to be very low, 3% of solar (Skillman, Terlevich, & Melnick, 1989). To date there is limited information of stellar populations in SagDIG, which was given briefly by Cook & Aaronson (1988). Cook & Aaronson (1988) discovered about 25 carbon stars scattered beyond the body of the galaxy, and estimated the distance to this galaxy using three methods: using the brightest blue stars, using the -band luminosity of the tip of the red giant branch, and using the mean -band magnitude of the carbon stars.
In this paper we present a study of stellar populations of SagDIG based on deep CCD photometry. This paper is composed as follows. Section 2 describes the observations and data reduction. Section 3 investigates the morphological structure of SagDIG, and Section 4 presents the color-magnitude diagrams of SagDIG. Sections 5, 6 and 7 estimate the reddening, distance, and metallicity of SagDIG, respectively. Section 8 presents the surface photometry of SagDIG and Section 9 discusses the group membership, stellar populations, and the brightest stars of SagDIG. Finally, summary and conclusion are given in §10.
2 OBSERVATIONS AND DATA REDUCTION
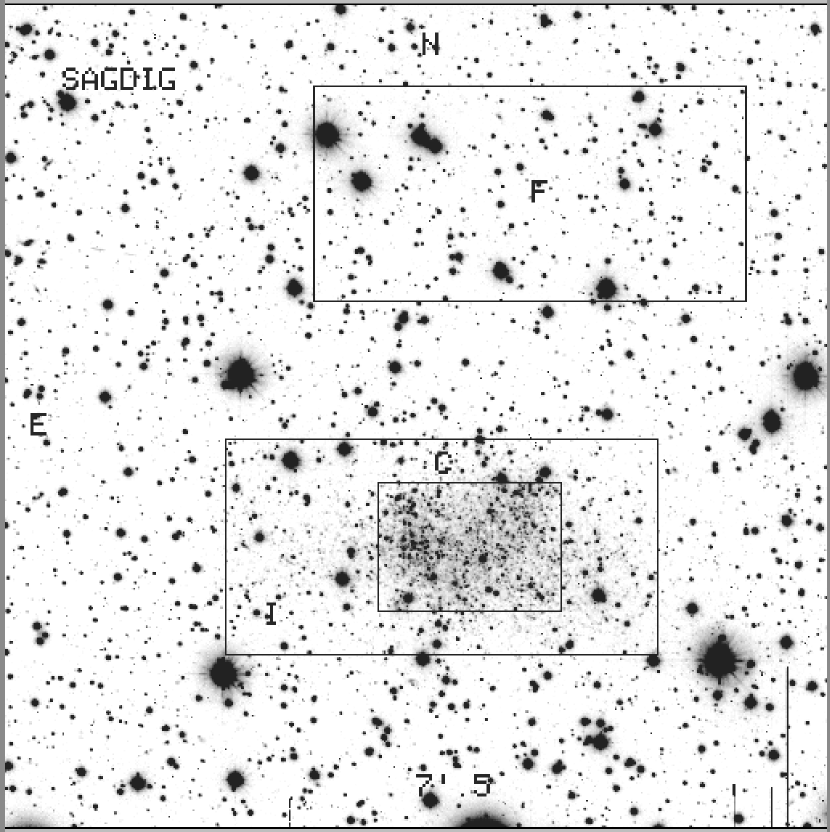
CCD images of SagDIG were obtained on the photometric night of 1994 October 8 (UT) using the University of Hawaii 2.2 m telescope at Mauna Kea. Table 1 lists the journal of the observations of SagDIG. A grey scale map of the -band CCD image of SagDIG is displayed in Fig. 1. The size of the field of view is and the ( binned) pixel scale of the CCD is 0.44 arcsec pixel-1.
For the analysis of the data we have divided the field covered by our CCD images into three regions as shown in Fig. 1: the C region which covers the central region () of SagDIG, the I region which covers the outer region () of the galaxy, and the F region which represents a control field with the same area of the C region plus I region.
Instrumental magnitudes of the stars in the CCD images were derived using DoPHOT (Schechter, Mateo, & Saha, 1993). These magnitudes were transformed onto the standard system using the standard stars observed during two nights including the same night (Landolt, 1992). The transformation equations we derived from the photometry of the standard stars are: , , , and , where upper cases and lower cases represent, respectively, the standard system and instrumental system. represents the air mass. The rms scatter of the solutions are 0.01 – 0.02 mag. The total number of stars which were measured at and at least one other color in the CCD image is 8100. Table 2 lists photometry of the measured bright stars with mag in the C and I regions of SagDIG. The coordinates X and Y in Table 2 are given in units of pixel ( = 0.44 arcsec), and increase to the east and to the south, respectively.
3 MORPHOLOGICAL STRUCTURE
Fig.1 shows that there are many bright foreground stars in the CCD field, which is expected from the galactic position of SagDIG ( deg, and deg). A strong concentration of much fainter stars than most foreground stars are seen in the C region, which represent SagDIG. The main body of the galaxy is mostly seen inside the C region, and is much elongated along the east-west direction. It looks like a crescent in the low contrast image. However, the outer part of the galaxy seen at the faint level extends out to the boundary of the I region. There are few bright stars which appear to be the members of SagDIG in the I region. Instead there are many faint stars seen better in and images of the I region, which are probably old red giant stars as shown later. A color map created by combining images shows that most stars in the C region are impressively blue, while the faint stars in the I region are mostly yellow to red. The mean ellipticity and position angle of the entire structure of SagDIG were roughly estimated to be and P.A. = 90 deg, respectively. Therefore SagDIG is an elongated galaxy, in the central region of which some bright stars are irregularly distributed. This kind of structure that some young stars are irregularly distributed against the smooth background of old stellar populations is common among irregular galaxies (Sandage, 1971; Lee, 1993; Lee et al., 1993; Minniti & Zijlstra, 1996; Lee & Byun, 1999; Lee et al., 1999).
4 COLOR-MAGNITUDE DIAGRAMS
In Figs. 2 and 3 we display – and – diagrams of 1500 measured stars in the C region, 1570 measured stars in the I region, and 710 measured stars in the F region. Note that the area of the (C+I)-region in the field is the same as that of the F region so that we can estimate the contamination due to foreground stars by comparing directly the color-magnitude diagrams (CMDs) of each region.
Several distinguishable features of the stars in SagDIG are seen in Figs. 2 and 3. First, there is a remarkable blue plume of bright stars with and in the C region (filled circles). There are much fewer blue stars in the I region (open circles) than in the C region. Comparison of the C and I regions and the F region in Fig. 2 shows that these bright blue stars are mostly members of SagDIG. There are few stars with and in the F region. The brightest end of the blue plume extends up to mag at . These stars are mostly massive stars which were formed recently. Stars in the I region are mostly fainter than mag, much fainter than those bright stars in the C region. This shows that there was much less star formation in the outer part of SagDIG recently.
Secondly, Fig. 3 shows that there is a strong concentration of red stars fainter than mag in the C and I regions in addition to the blue plume at . Most of these red stars are probably old red giant branch (RGB) stars of SagDIG. This feature is more clearly visible in the I region than in the C region.
5 REDDENING
We have estimated the foreground reddening toward SagDIG using the color-color diagram of measured bright stars. Fig. 4 shows the – diagram of bright stars with mag (open squares) and mag (filled circles) and photometric errors smaller than 0.015 mag. The stars with mag are fainter and farther than the stars with mag, and they have photometric errors larger than the latter. These bright stars are definitely foreground stars, as shown in the color-magnitude diagrams in the previous section. Comparing the colors of these stars with the intrinsic relation of dwarfs (Cousins, 1978) in Fig. 4, we have derived a reddening value of . This value is obviously a underestimate for the total reddening toward the SagDIG, because these foreground stars are relatively nearby. The mean magnitudes of the stars in the two groups shown in Fig. 4 are mag and mag. These magnitudes correspond roughly to the distances of 2.5 kpc and 10 kpc, respectively, if we assume these stars are dwarfs (for which mag and ).
On the other hand, the reddening value for the position of SagDIG derived from the extinction map of our Galaxy (Schlegel, Finkbeiner, & Davis, 1998) is . This value is much larger than that based on the color-color diagram. If this value of is adopted, then most measured stars will deviate significantly more from the intrinsic relation represented by the dashed line in Fig. 4. Further studies of the reddening for SagDIG, for example, using photometry, are needed to resolve this difference. In this study we adopt the mean value of these two estimates: . Extinction laws given by Cardelli, Clayton, & Mathis (1989) are used to calculate the extinctions for other colors for the total-to-selective extinction ratio of : mag and mag.
6 DISTANCE
We estimate the distance to SagDIG using the magnitude of the tip of the RGB (TRGB), as described in Da Costa & Armandroff (1990) and in Lee, Freedman, & Madore (1993). The magnitude of the TRGB is estimated using the diagram in Fig. 3 and the luminosity function of red giant stars. Fig. 5 shows the -band luminosity function of the measured red giant stars in the I region, from which the contribution due to field stars was subtracted.
The I region is more appropriate for measuring the magnitude of the TRGB than the C region, because there are much less young bright stars in the I region and because the crowding is much less severe in the I region than in the C region. In Fig. 5, as the magnitude increases, there is a sudden increase at mag in the luminosity function of the I region, which corresponds to the TRGB seen in the color-magnitude diagram in Fig. 3. We have also used the edge detecting method described in Lee et al. (1993), obtaining the same result as above.
Several stars brighter than the TRGB are mostly asymptotic giant stars of intermediate age, also seen in other dwarf galaxies (Lee & Byun, 1999; Lee et al., 1999). This is also consistent with the presence of carbon stars of intermediate age discovered by Cook & Aaronson (1988).
The mean observed color of the TRGB is estimated to be . The bolometric magnitude of the TRGB is then calculated from . Adopting a value for the metallicity of [Fe/H] dex as estimated below, we obtain a value for the bolometric magnitude of mag. (The mean metallicity of SagDIG is not certain as discussed in the next section. Only an upper limit for the mean metallicity is determined: [Fe/H] dex. However, the result for the distance estimate is not affected much by this because the TRGB method is insensitive to the metallicity.) The bolometric correction at for the TRGB is estimated to be BC mag, adopting a formula for the bolometric correction BCI = 0.881 – 0.243. The intrinsic magnitude of the TRGB is then given by mag. Finally the distance modulus of SagDIG is obtained: mag (corresponding to a distance of Mpc) for an adopted extinction of mag. This result is in excellent agreement with the result obtained using the same method by Cook & Aaronson (1988), .
7 METALLICITY
We have estimated roughly the mean metallicity of the RGB stars in SagDIG using the color of the stars 0.5 mag fainter than the TRGB, . This color is measured from the median value of the observed colors of about 30 red giant branch stars with mag, to be (m.e.) The reddening-corrected color is for the adopted reddening. This value is mag bluer than the mean color of the RGBs in other metal-poor dwarf galaxies such as UKS 2323–326 and DDO 210 (Lee & Byun, 1999; Lee et al., 1999). This value is even bluer than the RGB of the metal-poor Galactic globular cluster M15 with [Fe/H] = –2.17 dex, and is beyond the range of calibrator globular clusters for [Fe/H] – relation of the RGB. This result shows that the mean metallicity of the RGB stars in SagDIG is lower than [Fe/H] dex. The mean color leads to a value for the mean metallicity of [Fe/H] dex, if we use the [Fe/H] – relation as it is. However this estimate is based on the extrapolation of the calibration relation. In Fig. 6 we overlayed the locus of the red giant branch of M15 on the diagram of the measured stars in SagDIG, shifted according to the distance and reddening of SagDIG. If we adopt the zero reddening for SagDIG, the RGB of SagDIG will get closer to that of M15, but still too blue to be in a good agreement (in this case the metallicity of the RGB is derived to be [Fe/H] dex). The broadening of the faint part of the RGB is mostly due to the photometric errors, as shown by the error bars in Fig. 6. The very low metallicity of the RGB obtained in this study is consistent with the result derived from the spectroscopy of an extended H II region in SagDIG by Skillman et al. (1989). Skillman et al. (1989) found that the metallicity of the HII region is 3% solar, which is in the lowest among the HII regions in known dwarf galaxies. Thus the mean metallicity of the RGB stars in SagDIG is very low, and is in the lowest end in the metallicity of known dwarf galaxies (Lee et al., 1993; Lee, 1995a, b; Mateo, 1998; Lee & Byun, 1999; Lee et al., 1999).
8 SURFACE PHOTOMETRY
It is difficult to derive reliably the surface photometry of SagDIG, because of the presence of several bright foreground stars in the direction of SagDIG. We have obtained the surface photometry of SagDIG as follows. First, we removed in the original CCD images the images of several bright stars which were obviously considered to be foreground stars in the area of SagDIG, using IMEDIT in IRAF. Then we performed aperture photometry of SagDIG using the elliptical annular aperture with ellipticity of 0.5 and P.A. = 90 deg derived in this study. The value of the sky background was estimated from the mean intensity of the field region.
The results of surface photometry of SagDIG are listed in Table 3 and are displayed in Fig. 7. In Table 3 presents the mean major radius of an annular aperture, and represents the outer radius of an annular aperture. Fig. 7 shows that the surface brightness profiles are almost flat in the central region of the galaxy ( arcsec), and follow approximately an exponential law in the outer part ( arcsec). We fit the surface brightness profiles of the inner region of SagDIG with single-mass isotropic King models (King, 1966) and those of the outer region with an exponential law in Fig. 8. Fig. 8 shows that the surface brightness profiles of the inner region are roughly fit by a King model with a core concentration parameter , where and represent the core radius and tidal radius, respectively. The core radius of the inner region is measured to be arcsec = pc. Note that this value is much larger than that listed in Mateo (1998), 125 pc, which is based on rough estimate from the old data by Longmore et al. (1978). The core radius of SagDIG is found to be similar to those of other dwarf galaxies (Mateo 1998). The surface brightness profiles of the outer region ( arcsec) are fit roughly by an exponential law with a scale length of arcsec = pc. Fig. 7(b) illustrates the surface color profiles of the galaxy. Fig. 7(b) shows that the mean color of the inner region of SagDIG, , is blue, which is typical for dwarf irregular galaxies. Also the color profiles are bluer in the inner 1 arcmin region than in the outer region, which is due to the presence of blue stars in the inner region of the galaxy. The properties of the surface brightness and color profiles of SagDIG are similar to those of other dwarf galaxies (Kormendy & Djorgovski, 1989; Mateo, 1998; Lee, 1995a, b; Lee & Byun, 1999; Lee et al., 1999).
From the data of the surface photometry we have derived several basic parameters of SagDIG as follows. The standard radius and Holmberg radius of SagDIG are measured to be = arcsec = 330 pc and = arcsec = 610 pc, respectively. The errors in these are measuring errors for which the uncertainty in the photometry was not considered. Therefore these are underestimates of the true errors. These radii correspond roughly to the boundaries of the C and I regions, respectively, shown in Fig. 1. Note that our value for the Holmberg radius is slightly larger than the value Longmore et al.(1978) derived roughly from their photographic plate, = 90 arcsec.
The central surface brightness of SagDIG is measured to be mag arcsec-2, mag arcsec-2, mag arcsec-2, and mag arcsec-2. The total magnitudes of SagDIG within are derived to be mag, mag, mag, and mag, and the corresponding absolute magnitudes are mag, mag, mag, and mag. total magnitude of SagDIG derived in this study, mag, is much brighter than those given by Cesarsky et al.(1977) and Longmore et al.(1978), mag and 14.7 mag, respectively.
9 DISCUSSION
9.1 The Local Group Membership of SagDIG
We have measured the distance to SagDIG to be Mpc from the -band magnitude of the TRGB, which is an accurate distance indicator for resolved galaxies (Lee et al., 1993; Salaris & Cassisi, 1998). From this the distance of SagDIG from the barycenter of the Local Group is derived to be 1.1 Mpc. From the measured heliocentric velocity of this galaxy, km s-1(Longmore et al., 1978; Young & Lo, 1997), the velocity of SagDIG from the barycenter of the Local Group is calculated to be km s-1(Lee, 1995a). This value is much smaller than the upper limit for the boundary of the Local Group, 60 km s-1. These results show that SagDIG is a member of the Local Group.
9.2 Stellar Populations in SagDIG
We have investigated roughly the properties of young stellar populations seen in Fig. 2 using the theoretical isochrones. In Fig. 9, we overlay, in the diagram of SagDIG, two isochrones for the metallicities of ([Fe/H] = – 1.2 dex) and ([Fe/H] = – 1.6 dex) and ages of 40 and 300 Myrs given by the Padova Group (Bertelli et al., 1994). We choose first the isochrone with the lowest metallicity, , among the isochrones given by Bertelli et al. (1994), which are represented by the dashed lines in Fig. 9. However, the red parts of these isochrones do not match well with the observed stars. The red stars in SagDIG appear to match better the isochones with higher metallicty, as shown by the solid lines in Fig. 9. Fig. 9 shows (1) that the brightest blue and red stars in SagDIG match roughly the blue and red loops of the isochrone with an age of about 40 Myrs, and (2) that the brightest main-sequence at mag ( mag, about 1 mag below the brightest blue supergiants) indicates an age of about 10 Myrs. These results show that stars were formed as recently as 10 Myrs ago in SagDIG. On the other hand, a well-developed RGB shown in the diagram of Fig. 3 shows that the bulk of the stars in SagDIG were formed before a few Gyrs ago, and a small number of AGB stars above the TRGB were probably formed a few Gyrs ago.
Fig. 10 displays the luminosity function of the main-sequence stars with in SagDIG. The luminosity function we derived is incomplete for the faint end, but is reasonably complete for mag. The bright part of the luminosity function ( mag, mag) is approximately fit by a line with a logarithmic slope of . This value of the slope is similar to those of other irregular and spiral galaxies (Freedman, 1986; Hoessel, 1986; Lee & Byun, 1999; Lee et al., 1999).
9.3 The Brightest Blue and Red Stars in SagDIG
Longmore et al.(1978) estimated roughly from the survey plate the magnitude of the brightest blue stars in SagDIG to be mag, and used this result to derive the distance to this galaxy, obtaining a value of 1.1 Mpc. With our photometry we can investigate in detail the properties of the brightest stars in this galaxy.
In the diagram of the C and I regions of SagDIG (filled circles and open circles, respectively) shown in Fig. 2, it is obvious which stars are the three brightest blue stars in SagDIG, because there are no foreground stars with mag and in the F region. The three brightest blue stars (called BSG) in SagDIG are IDs 3124, 3039, and 3652, the photometry of which are listed in Table 2. The mean observed magnitudes and colors of these three BSGs in SagDIG are derived to be, respectively, mag and . The corresponding absolute magnitude and color are mag, . However, two of these stars are found to be compact objects showing emission by Strobel et al. (1991): 3124 (the first brightest) and 3652 (the third brightest) are listed as compact H II regions, SHK1 and SHK2, respectively, in Strobel et al. (1991). On the other hand, Skillman et al. (1989) detected H and H emission lines, but no [O III] line from the spectra of SHK1 and SHK2. They suggested “that these objects are probably galactic (e.g. dwarf novae)”. But the magnitude and color of these objects show strongly that these objects are the members of SagDIG. Further spectroscopy is needed to identify the class of these objects. If we omit 3124 and 3652 as the BSGs, then the three BSGs will be 3039, 3897 and 3694, which are adopted as the final BSGs in this study. The mean observed magnitudes and colors of these three BSGs in SagDIG are derived to be, respectively, mag and . The corresponding absolute magnitude and color are mag, .
There are three known H II regions in SagDIG, two of which are compact objects as described above, and the remaining one is an extended H II region, SHK3 (Strobel et al. 1991). We searched for the exciting source of SHK3, finding a bright blue star located in the center of SHK3: ID 6313. The observed magnitude and color of this star are , , and . The absolute magnitude and color of this star are mag and , corresponding to O-type dwarf.
On the other hand, it is not easy to select the three brightest red stars (called RSG) in SagDIG, because the heavy contamination due to foreground stars is severe in the red region of the CMDs. We just select the three brightest red stars with in the C region. They are IDs 4966, 3979 and 3640, which are listed in Table 2. The mean observed magnitudes and colors of these three RSGs are derived to be, respectively, mag and . The corresponding absolute magnitude and color are mag, . It should be noted that these values are very uncertain for the brightest red stars, because of uncertainty in the membership of these stars used.
The luminosity of the brightest stars in galaxies is known to be correlated with the luminosity of the parent galaxies. Lyo & Lee (1997) presented, from the analysis of 17 galaxies (with mag) to which Cepheid distances are available, calibrations for the relation between the magnitudes of the brightest stars and the magnitudes of the parent galaxies: with mag, and with mag. Using these relations, we derive mag and mag for the absolute magnitude of SagDIG as derived in the previous section. Thus the magnitudes of the brightest stars in SagDIG are about one mag fainter than those expected from the relation for the bright galaxies.
10 SUMMARY AND CONCLUSION
We have presented a study of the stellar populations in the dwarf irregular galaxy SagDIG based on deep CCD photometry. The primary results obtained in this study are summarized as follows and the basic information of SagDIG is listed in Table 4.
(1) color-magnitude diagrams of the stars in the area of SagDIG have been presented. These color-magnitude diagrams exhibit a blue plume, a well-defined RGB, and a small number of AGB stars with intermediate age.
(2) The tip of the RGB is found to be at mag and mag. From this value we derive a distance modulus of SagDIG of mag, and a distance of Mpc. From this result and the systemic velocity of SagDIG, we conclude that SagDIG is a member of the Local Group.
(3) The mean observed color of the RGB at mag is mag. From this value we obtain roughly the mean metallicity of the RGB: [Fe/H] dex. The metallicity of the RGB in SagDIG is the lowest among the metallicities of known dwarf irregular galaxies.
(4) The total magnitudes of SagDIG within (=107 arcsec) are derived to be mag, mag, mag, and mag. The central surface brightness is measured to be mag arcsec-2 and mag arcsec-2. Surface brightness profiles of the central part of SagDIG are approximately fit by a King model with a core concentration parameter , and those of the outer part follow an exponential law with a scale length of pc.
(5) The magnitudes of three brightest blue and red stars in SagDIG are derived: mag and mag, which are about one magnitude fainter than those expected from conventional correlations with galaxy luminosity.
References
- Bertelli et al. (1994) Bertelli, G., Bressan, A., Fagotto, F., Chiosi, C., & Nasi, E. 1994, A&AS, 106, 275
- Cardelli, Clayton, & Mathis (1989) Cardelli, J. A., Clayton, G. C., & Mathis, J. S. 1989, ApJ, 345, 235
- Cesarsky et al. (1977) Cesarsky, D., A., Laustsen, S., Lequeux, J., Schuster, H.-E., & West, R. M. 1977, A&A, 61, L31
- Cook & Aaronson (1988) Cook, K. H., & Aaronson, M. 1988, in The Extragalactic Distance Scale, eds. S. van den Bergh & C. J. Pritchet, ASPCS, 4, 75
- Cousins (1978) Cousins, A. W. J. 1978, MNASSA, 37, 62
- Da Costa & Armandroff (1990) Da Costa, G. S., & Armandroff, T. E. 1990, AJ, 100, 162
- de Vaucouleurs et al. (1991) de Vaucouleurs, G., de Vaucouleurs, Paturel, G., and Fouque, P. 1991, Third Reference Catalog of Bright Galaxies (Springer-Verlag, New York) (RC3)
- Freedman (1986) Freedman, W. L. 1986, Luminous Stars and Associations in Galaxies, edited by C. W. H. de Loore, A. J. Willis, & P. Laskarides, IAU Symposium No. 116 (Reidel, Dordrecht), p. 61
- Hoessel (1986) Hoessel, J. 1986, Luminous Stars and Associations in Galaxies, edited by C. W. H. de Loore, A. J. Willis, & P. Laskarides, IAU Symposium No. 116 (Reidel, Dordrecht), p. 439
- King (1966) King, I. 1966, AJ, 71, 276
- Kormendy & Djorgovski (1989) Kormendy, J., & Djorgovski, S. 1989, ARA&A, 27, 235
- Landolt (1992) Landolt, A. U. 1992, AJ, 104, 340
- Lee (1993) Lee, M. G. 1993, ApJ, 408, 409
- Lee et al. (1993) Lee, M. G., Freedman, W. L., & Madore, B. F. 1993, ApJ, 417, 553
- Lee (1995a) Lee, M. G. 1995a, Jour. Korean Astro. Soc., 28, 169
- Lee (1995b) Lee, M. G. 1995b, AJ, 110, 1129
- Lee & Byun (1999) Lee, M. G., & Byun, Y.-I. 1999, AJ, 118, 817
- Lee et al. (1999) Lee, M. G. et al. 1999, AJ, 118, 853
- Longmore et al. (1978) Longmore, A. J., Hawarden, T. G., Webster, B. L., Goss, W. M., & Mebold, U. 1978, MNRAS, 183, 97P
- Lyo & Lee (1997) Lyo, A.-R., & Lee, M. G. 1997, Jour. Korean Astro. Soc., 30, 27
- Mateo (1998) Mateo, M. 1998, ARA&A, 36, 435
- Minniti & Zijlstra (1996) Minniti, D., & Zijlsta, A. A. 1996, ApJ, 467, L13
- Salaris & Cassisi (1998) Salaris, M., & Cassisi, S. 1998, MNRAS, 298, 166
- Sandage (1971) Sandage, A. 1971, in Nuclei of Galaxies, ed. D.J.K. O’Connel (Amsterdam, North-Holland), 601
- Schechter, Mateo, & Saha (1993) Schechter, P., Mateo, M. , & Saha, A. 1993, PASP, 105, 1342
- Schlegel, Finkbeiner, & Davis (1998) Schlegel, D. J., Finkbeiner, D. P., & Davis, M. 1998, ApJ, 500, 525
- Skillman, Terlevich, & Melnick (1989) Skillman, E., D., Terlevich, R., & Melnick, J. 1989, MNRAS, 240, 563
- Strobel, Hodge, & Kennicutt (1991) Strobel, N. V., Hodge, P., & Kennicutt, Jr., R. C. 1991, ApJ, 383, 148
- Young & Lo (1997) Young, L. M., & Lo, K. Y. 1997, ApJ, 490, 710
| Filters | Texp | Air mass | FWHM | U.T.(Start) |
|---|---|---|---|---|
| 900 s | 1.35 | 1′′.1 | 1994 Oct 8 05:54 | |
| s | 1.45 | 0′′.9 | 1994 Oct 8 06:11 | |
| 600 s | 1.61 | 0′′.9 | 1994 Oct 8 07:03 | |
| s | 1.77 | 1′′.0 | 1994 Oct 8 07:15 |
| ID | X(px) | Y(px) | (–) | (–) | (–) | ID | X(px) | Y(px) | (–) | (–) | (–) | ||
|---|---|---|---|---|---|---|---|---|---|---|---|---|---|
| 2991 | 435.7 | 541.9 | 19.75 | 0.54 | 0.40 | 0.51 | 4259 | 386.5 | 640.2 | 20.60 | 0.60 | 0.42 | 0.72 |
| 3003 | 654.2 | 543.4 | 20.62 | 0.87 | 0.55 | 0.97 | 4406 | 365.8 | 647.8 | 20.61 | 0.57 | 0.36 | 0.62 |
| 3024 | 530.4 | 545.4 | 20.10 | 0.44 | 0.31 | 0.51 | 4512 | 340.8 | 653.0 | 19.58 | 0.76 | 0.50 | 0.79 |
| 3030 | 511.1 | 546.0 | 19.25 | 0.59 | 0.40 | 0.56 | 4758 | 548.9 | 663.9 | 20.16 | -0.03 | -0.02 | -0.22 |
| 3039 | 474.3 | 546.9 | 19.71 | 0.02 | 0.01 | -0.03 | 4805 | 528.1 | 666.4 | 20.38 | -0.02 | -0.10 | 0.01 |
| 3054 | 417.5 | 550.2 | 20.48 | 1.02 | 0.71 | 1.06 | 4828 | 499.1 | 667.4 | 20.74 | 1.45 | 0.85 | 1.31 |
| 3116 | 394.8 | 557.7 | 19.56 | 0.61 | 0.38 | 0.63 | 4836 | 286.2 | 667.7 | 20.53 | 0.50 | 0.32 | 0.55 |
| 3124 | 482.0 | 558.7 | 19.31 | 0.15 | 0.26 | 0.34 | 4841 | 319.3 | 667.9 | 20.37 | 1.35 | 0.85 | 1.71 |
| 3126 | 743.6 | 559.1 | 20.38 | 0.35 | 0.22 | 0.41 | 4847 | 516.6 | 668.4 | 20.75 | 0.90 | 0.62 | 0.93 |
| 3159 | 691.1 | 563.3 | 19.03 | 0.80 | 0.55 | 0.83 | 4888 | 512.7 | 670.5 | 20.75 | 1.22 | 0.69 | 1.19 |
| 3168 | 423.7 | 564.5 | 19.79 | 0.81 | 0.54 | 0.86 | 4966 | 559.9 | 674.2 | 20.27 | 1.46 | 0.97 | 2.04 |
| 3192 | 632.8 | 566.7 | 19.02 | 0.65 | 0.43 | 0.67 | 5024 | 526.8 | 677.2 | 20.44 | -0.03 | 0.00 | -0.06 |
| 3287 | 474.1 | 577.5 | 20.78 | 1.20 | 0.84 | 1.34 | 5215 | 592.2 | 686.2 | 19.32 | 0.64 | 0.41 | 0.62 |
| 3326 | 454.2 | 580.4 | 19.96 | 0.73 | 0.46 | 0.77 | 5234 | 664.9 | 687.5 | 20.34 | 0.93 | 0.64 | 1.07 |
| 3332 | 312.6 | 581.2 | 19.98 | 0.72 | 0.51 | 0.77 | 5250 | 402.6 | 688.1 | 20.10 | 0.71 | 0.46 | 0.76 |
| 3363 | 354.9 | 583.8 | 19.45 | 0.81 | 0.47 | 0.80 | 5262 | 493.1 | 688.7 | 20.73 | 0.95 | 0.64 | 1.10 |
| 3427 | 313.5 | 588.8 | 19.79 | 0.66 | 0.42 | 0.62 | 5263 | 567.5 | 688.7 | 20.00 | 1.29 | 0.90 | 1.54 |
| 3449 | 687.7 | 590.1 | 20.12 | 0.79 | 0.49 | 0.79 | 5283 | 282.8 | 690.0 | 19.64 | 0.97 | 0.68 | 1.07 |
| 3456 | 296.7 | 590.8 | 20.32 | 0.53 | 0.37 | 0.59 | 5515 | 282.1 | 702.7 | 19.10 | 1.02 | 0.68 | 1.07 |
| 3543 | 369.8 | 597.3 | 19.96 | 0.79 | 0.49 | 0.72 | 5625 | 241.1 | 708.8 | 20.39 | 0.77 | 0.54 | 0.90 |
| 3616 | 696.2 | 601.5 | 19.34 | 1.09 | 0.77 | 1.26 | 5843 | 463.2 | 720.8 | 19.86 | 0.75 | 0.51 | 0.84 |
| 3640 | 369.6 | 603.2 | 20.52 | 1.23 | 0.86 | 1.54 | 5882 | 369.7 | 723.8 | 19.32 | 0.70 | 0.46 | 0.70 |
| 3652 | 512.2 | 604.2 | 19.79 | 0.17 | 0.79 | 0.50 | 5994 | 645.3 | 732.1 | 20.30 | 1.03 | 0.75 | 1.24 |
| 3655 | 401.9 | 604.3 | 19.18 | 0.96 | 0.72 | 1.16 | 6003 | 411.8 | 732.7 | 19.03 | 0.56 | 0.38 | 0.62 |
| 3694 | 483.0 | 606.0 | 20.00 | 0.18 | 0.13 | 0.25 | 6024 | 359.1 | 734.1 | 19.66 | 0.71 | 0.45 | 0.70 |
| 3701 | 682.2 | 606.5 | 20.66 | 0.50 | 0.35 | 0.62 | 6053 | 221.5 | 736.2 | 19.62 | 0.85 | 0.56 | 0.83 |
| 3712 | 660.6 | 607.2 | 20.40 | 1.22 | 0.84 | 1.29 | 6071 | 722.1 | 737.3 | 20.59 | 1.50 | 0.97 | 2.20 |
| 3716 | 248.9 | 607.7 | 19.59 | 0.66 | 0.41 | 0.66 | 6087 | 355.1 | 738.3 | 19.58 | 0.84 | 0.54 | 0.88 |
| 3718 | 388.0 | 607.9 | 19.31 | 0.67 | 0.45 | 0.72 | 6158 | 320.8 | 743.7 | 19.85 | 0.64 | 0.42 | 0.73 |
| 3738 | 667.3 | 609.0 | 20.75 | 1.03 | 0.75 | 1.21 | 6210 | 224.5 | 747.0 | 20.59 | 0.84 | 0.59 | 0.94 |
| 3740 | 566.1 | 609.1 | 20.28 | 1.06 | 0.77 | 1.16 | 6222 | 260.2 | 747.5 | 19.29 | 0.72 | 0.46 | 0.78 |
| 3779 | 484.1 | 611.3 | 20.33 | 0.47 | 0.37 | 0.63 | 6253 | 731.8 | 749.7 | 20.56 | 0.81 | 0.55 | 0.84 |
| 3897 | 519.8 | 618.1 | 19.96 | 0.04 | 0.03 | -0.11 | 6294 | 388.2 | 752.5 | 20.40 | 0.79 | 0.49 | 0.72 |
| 3906 | 645.9 | 618.8 | 20.57 | 0.81 | 0.52 | 0.86 | 6371 | 667.1 | 757.3 | 20.50 | 0.77 | 0.53 | 0.88 |
| 3966 | 648.2 | 621.9 | 20.36 | 0.94 | 0.59 | 1.05 | 6377 | 454.6 | 757.8 | 20.69 | 1.33 | 0.88 | 2.06 |
| 3974 | 495.5 | 622.4 | 20.53 | 0.02 | -0.01 | -0.13 | 6421 | 697.2 | 762.0 | 19.48 | 0.64 | 0.41 | 0.73 |
| 3979 | 417.9 | 622.5 | 20.37 | 1.20 | 0.86 | 1.52 | 6540 | 618.1 | 771.9 | 20.79 | 1.15 | 0.80 | 1.32 |
| 3990 | 514.7 | 623.2 | 20.53 | 0.04 | 0.00 | -0.02 | 6548 | 555.1 | 772.7 | 20.24 | 0.50 | 0.44 | 0.66 |
| 4040 | 302.7 | 627.2 | 20.13 | 0.73 | 0.44 | 0.68 | 6582 | 654.9 | 775.1 | 20.36 | 0.52 | 0.38 | 0.60 |
| 4042 | 518.2 | 627.2 | 20.22 | 0.86 | 0.58 | 0.83 | 6587 | 738.5 | 775.6 | 20.57 | 1.18 | 0.85 | 1.47 |
| 4093 | 420.0 | 630.7 | 19.12 | 0.83 | 0.54 | 0.82 | 6615 | 339.0 | 778.1 | 19.76 | 1.15 | 0.80 | 1.35 |
| 4101 | 485.1 | 630.9 | 20.62 | -0.03 | -0.01 | -0.09 | 6621 | 505.5 | 778.8 | 19.34 | 0.53 | 0.35 | 0.59 |
| 4112 | 532.2 | 631.9 | 20.75 | 0.01 | -0.03 | -0.05 | 6704 | 651.4 | 788.2 | 19.51 | 0.46 | 0.30 | 0.53 |
| 4121 | 521.9 | 632.1 | 20.30 | 0.03 | 0.01 | 0.00 | 6757 | 319.5 | 793.8 | 19.86 | 0.72 | 0.42 | 0.81 |
| 4130 | 549.0 | 632.5 | 19.57 | 0.76 | 0.49 | 0.78 | 6811 | 433.9 | 799.4 | 20.37 | 1.40 | 0.96 | 1.79 |
| 4168 | 512.6 | 634.9 | 20.17 | 0.05 | 0.03 | 0.04 | 6831 | 329.2 | 803.1 | 20.76 | 0.94 | 0.52 | -0.02 |
| 4197 | 712.6 | 636.5 | 19.56 | 0.65 | 0.37 | 0.65 | 6846 | 251.8 | 805.9 | 20.58 | 0.84 | 0.55 | 0.93 |
| 4230 | 567.7 | 638.4 | 20.60 | 0.65 | 0.42 | 0.73 | 6855 | 644.3 | 806.7 | 19.82 | 1.22 | 0.81 | 1.51 |
| [′′] | [′′] | ||||||||
|---|---|---|---|---|---|---|---|---|---|
| 6.2 | 24.21 | 23.91 | 23.61 | 23.54 | 8.8 | 18.79 | 18.49 | 18.22 | 18.10 |
| 13.9 | 24.21 | 23.91 | 23.65 | 23.50 | 17.6 | 17.26 | 16.95 | 16.67 | 16.46 |
| 22.4 | 24.25 | 24.00 | 23.74 | 23.55 | 26.4 | 16.37 | 16.06 | 15.75 | 15.48 |
| 31.1 | 24.29 | 24.04 | 23.78 | 23.65 | 35.2 | 15.74 | 15.45 | 15.15 | 14.92 |
| 39.8 | 24.37 | 24.13 | 23.88 | 23.77 | 44.0 | 15.24 | 14.95 | 14.65 | 14.44 |
| 48.6 | 24.63 | 24.33 | 24.04 | 23.91 | 52.8 | 14.91 | 14.62 | 14.31 | 14.07 |
| 57.4 | 24.96 | 24.66 | 24.39 | 24.07 | 61.6 | 14.65 | 14.34 | 14.01 | 13.76 |
| 66.1 | 25.22 | 24.92 | 24.57 | 24.26 | 70.4 | 14.43 | 14.09 | 13.74 | 13.49 |
| 74.9 | 25.44 | 25.14 | 24.78 | 24.37 | 79.2 | 14.29 | 13.93 | 13.57 | 13.28 |
| 83.7 | 25.89 | 25.40 | 25.18 | 24.75 | 88.0 | 14.18 | 13.80 | 13.43 | 13.14 |
| 92.5 | 26.08 | 25.77 | 25.39 | 25.12 | 96.8 | 14.09 | 13.70 | 13.32 | 13.01 |
| 101.3 | 26.32 | 26.00 | 25.62 | 25.36 | 105.6 | 14.00 | 13.59 | 13.19 | 12.89 |
| 110.1 | 26.64 | 26.31 | 25.90 | 25.67 | 114.4 | 14.00 | 13.52 | 13.12 | 12.80 |
| Parameter | Information | Reference |
|---|---|---|
| , | , | 1 |
| 21.06 deg, –16.28 deg | 1 | |
| HI heliocentric radial velocity, | km s-1 | 1 |
| Foreground reddening | mag | 2, 3 |
| Distance | , Mpc | 3 |
| Central surface brightness | , mag arcsec-2 | 3 |
| Core radius | arcsec = 300 pc | 3 |
| Standard radius | arcsec = 330 pc | 3 |
| Holmberg radius | arcsec = 610 pc | 3 |
| Scale length | arcsec = 210 pc | 3 |
| Apparent total magnitude () | mag, mag | 3 |
| Absolute total magnitude | mag, mag | 3 |
| RGB metallicity, [Fe/H] | dex | 3 |
| HI Flux | Jy km s-1 | 4 |
| HI mass | 3, 4 |
References. — (1) de Vaucouleurs et al. (1991) (RC3); (2) Schlegel, Finkbeiner & Davis (1998); (3) This study; (4) Young & Lo 1997 .