ASCA Discovery of a Be X-Ray Pulsar in the SMC:
AX J0051733
1. Introduction
Systematic X-ray source surveys in the Small Magellanic Cloud (SMC) started with the Einstein Imaging Proportional Counter (IPC: see e.g. Wang, Wu 1992), followed by the ROSAT Position Sensitive Proportional Counter (PSPC: Kahabka, Pietsch 1996; Kahabka et al. 1999). Optical identifications, however, require more accurate determinations of the X-ray source positions, and have been made by Cowley et al. (1997) and Schmidtke et al. (1999) with the ROSAT High-Resolution Imager (HRI). They conducted optical photometry and spectroscopy studies with the Cerro Tololo Interamerican Observatory (CTIO) and identified X-ray sources with optical counterparts. Most of these were proven to be supernova remnants (SNRs) in the SMC, or foreground bright stars in our Galaxy, while four were found to have Be star counterparts within their error regions. Hughes and Smith (1994) also made an optical counterpart search for selected X-ray sources, and found two Be star candidates at the X-ray positions.
X-ray binary pulsars with a Be star companion (here Be-XBPs) are thought to comprise the majority of X-ray binary pulsars (XBPs). However, possibly due to their transient nature, most of the Be-XBPs have not yet been discovered in the past X-ray observations. The SMC region would not be an exception. Since a pulsation search from X-ray sources with a Be star companion is a direct approach to discover Be-XBPs, we have performed timing studies for X-ray sources with a Be star companion reported by Cowley et al. (1997), Schmidtke et al. (1999) and Hughes, Smith (1994). The studies were made using archival data of the Japanese X-ray satellite ASCA.
In this Letter, we report on the discovery of X-ray pulsations from AX J0051733 = RX J0050.87316, which was the brightest X-ray source among the optically identified Be stars. We also report on the long-term flux variability from Einstein, ROSAT and ASCA observations.
2. Observation
AX J0051733 was included in the ASCA observation of the radio supernova remnant N19, on 1997 November 13–14, pointing at the direction of (00h47m16s, 73∘08′30′′) (here and after, we use J2000 coordinates).
ASCA (Tanaka et al. 1994) is equipped with four identical X-ray telescopes (XRTs: Serlemitsos et al. 1995) sensitive to photons with energies 0.4–10 keV. Four independent detectors, the two Solid-state Imaging Spectrometers (SISs: Burke et al. 1991) and the two Gas Imaging Spectrometers (GISs: Ohashi et al. 1996; Makishima et al. 1996), are placed at the foci of XRTs and are operated in parallel; hence, four independent data sets can be provided. However, we analyzed only the GIS data, because AX J0051733 was outside of the SIS field of view.
Each of the GIS detectors was operated in the PH mode with the standard bit-assignment that provides a time resolution of 62.5 ms and 0.5 s in high and medium bit-rate, respectively. Data taken at a geomagnetic cutoff rigidity lower than 4 GV, at an elevation angle less than 5∘ from the Earth and during passage through the South Atlantic Anomaly were rejected. The particle events were also removed by a rise-time discrimination method. After these filterings, the total available exposure time of each GIS was ks.
3. Analysis and Results
3.1. X-Ray Images and Source Identification
We made GIS2 and 3 images of the N19 region, and found a bright point source at an off-axis angle of 16′ in the GIS fields. The position was determined to be (00h50m50s, 73∘16′04′′), with a possible error of . The larger position error than the nominal value of (Makishima et al. 1996) is due to its large off-axis angle. Within this error region of AX J0051733, we found a ROSAT source, RX J0050.87316, with coordinates of (00h50m453, 73∘15′54′′), which was optically identified to be a Be star of 15.4 mag, and = 0.04 mag (Cowley et al. 1997).
3.2. Timing Analysis
Since the shape of the point-spread function is elongated at an off-axis position, like AX J0051733, we extracted photon events for GIS 2 and 3, each from an elliptical region with major and minor axes of 5′ and 2′, respectively.
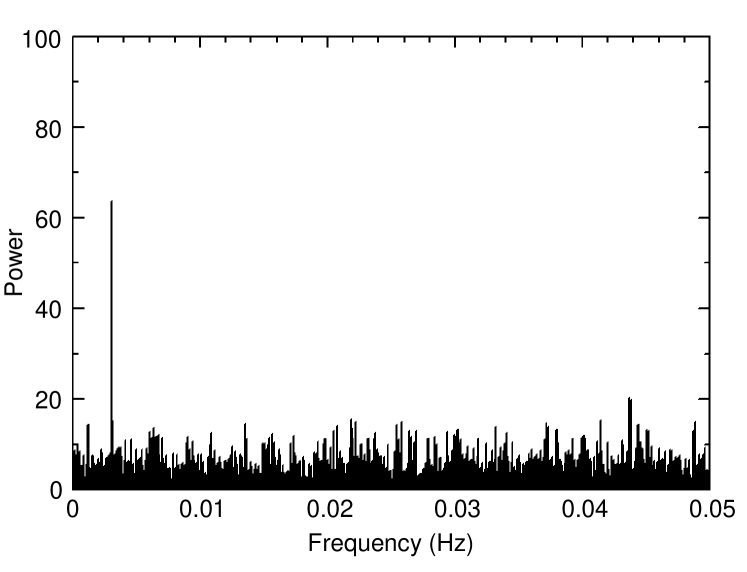
After a barycentric photon arrival time correction, we performed FFT (Fast Fourier Transformation) analyses; we found a peak in the power spectrum. To maximize the signal-to-noise ratio of this peak, we tried FFT analyses with many trial energy bands. Figure 1 shows the best power spectrum using the 1.5–6.0 keV energy band. A total of 541 (GIS 2) and 488 (GIS 3) photons were used for this FFT analysis.
A clear peak is noted at a frequency of 3.09510-3 Hz, corresponding to a pulsation period of 323 s. The chance probability to detect such a strong power signal at any frequency given in figure 1 is only 10-10; hence, we can safely conclude that the peak is not due to Poisson fluctuations, but is a real signature.
To estimate the pulsation period more precisely, the epoch-folding technique was applied, assuming that no period change occurred during the observation. The most likely period was determined to be = 323.1 0.3 s. Figure 2 shows the folded light curves in the soft (0.7–2.0 keV: upper panel) and hard (2.0–7.0 keV: lower panel) X-ray bands. The pulse profiles are different between these two bands; we can see three or four sub-peaks in the soft band, while a quasi-sinusoidal curve can bee seen in the hard band. The pulse fractions, defined as (Pulsed intensity)/(Total intensity), are 56% and 80% in the soft and hard bands, respectively.

3.3. Spectral Analysis
Unfortunately, AX J0051733 is located only away from the calibration isotope of GIS 3. We therefore did not use the GIS 3 data for the spectral study in order to avoid possible contamination from the isotope. We extracted a source spectrum of GIS 2 from the same region as that used for the timing analysis and selected a section of nearby sky as a background region. Figure 3 shows a phase-averaged source spectrum. Since the spectrum showed neither an emission line nor any other prominent structure, we applied a simple power-law model with interstellar absorption for the fitting. The best-fit model and parameters are given in figure 3 and table 1, respectively.
To determine any possible spectral changes during the pulse, we divided the data into two phases, phase 0.0–0.5 (high state) and 0.5–1.0 (low state), and fitted two separate spectra. Since the statistics of these spectra were limited, we fitted them to a power-law model fixing the absorption column density to the best-fit value of the phase-averaged spectrum. The best-fit parameters are summarized in table 1. The large errors make it unclear whether or not the photon index changed with the pulse phase.

4. Long-Term Flux History
To investigate any long-term flux variability, we accessed the HEASARC archive system for the Einstein and ROSAT observations, and found that AX J0051733 was included in 1 Einstein IPC, 9 ROSAT HRI and 6 ROSAT PSPC observations. For each observation, we extracted the source and background events from a circular region of 1′ radius and an outer region of 1′–1.′4 radius, respectively. After background subtraction, we estimated the source flux using PIMMS software, assuming that the spectral shapes were the same as that obtained with ASCA.
In figure 4, we summarize the X-ray fluxes from AX J0051733. The ASCA flux at MJD = 50765.2–50766.3 was higher than those of Einstein obtained at MJD = 44189.1–44189.9 and those of ROSAT at 49082.2–49104.0 by a factor 10. Therefore, we conclude that AX J0051733 has been highly variable, although a possibility that low flux periods are due to eclipses is not ruled out.

5. Discussion
5.1. Is AX J0051733 a Be Star Pulsar ?
We have discovered coherent X-ray pulsations from a Be star binary AX J0051733 = RX J0050.87316. The long pulsation period ( 323 s), large flux variation in the long time span, flat power-law spectrum (photon index 1) and existence of a Be star companion strongly support that AX J0051733 is a Be-XBP (Nagase 1989).
In the long-term history, we found 7 X-ray outbursts with flux 2 10-12 erg s-1 cm-2 . Most of the known Be-XBPs exhibit highly eccentric orbits, and flaring activities are often taken place when a neutron star passes near the peri-astron or across the equatorial plane, where the circumstellar gas density is expected to be high. We suspect that the occasional flares from AX J0051733 are related to a possible eccentric orbital period. However, no clear periodicity is noted in these flare intervals. We, nevertheless, folded the long-term light curve with a period of 185 days, which is near the expected orbital period based on Corbet’s empirical relation between the orbital and pulse periods in a Be-XBP (Corbet 1984). Although a hint of clustering of the outburst around an interval of about 185 d was found, as is given in figure 5, no definite argument for an orbital period was obtained. To establish the Be-star pulsar binary scenario and its structure, an orbital period determination is essential. We encourage further monitoring observations of AX J0051733.
5.2. Pulsation Search from the Other Be Star Binary Candidates
The discovery of coherent pulsations from AX J0051733, which was optically identified to be a Be star binary in the SMC, leads us to suspect that the other Be star binary candidates (RX J0051.97311, RX J0052.97158, and RX J0058.27231: see Schmidtke et al. 1999; RX J0103.27209 and RX J0106.27205: see Hughes, Smith 1994) also exhibit coherent pulsations (Be-XBPs). We thus extended our pulsation search to these sources.
RX J0051.97311 and RX J0058.27231 were found in the ASCA archive; both are found to have hard X-ray spectra (Yokogawa et al. 1999). Since the hard X-ray spectra are one of the signatures of XBPs, we extensively searched for pulsations, but found none, mainly due to their limited statistics. In fact, the total photon numbers for RX J0051.97311 and RX J0058.27231 in the 1.5–6.0 keV band are respectively 361 and 273 (including background counts), which are only and of that of AX J0051733.
RX J0103.27209 = 1SAX J0103.27209 is located in the radio source SNR 0101724 and has been found to exhibit coherent pulsations of 345.2 s with BeppoSAX (Israel et al. 1998). This source was seen in the three ASCA archival data sets. Coherent pulsations of 348.9 s were found in the data set obtained on 1996 May 21, the highest statistics from this source among the three observations (Yokogawa, Koyama 1998).
RX J0106.27205 showed no detectable X-ray emission in two ASCA observations, while RX J0052.97158 has not been observed with ASCA.
In summary, the brightest two X-ray sources exhibit X-ray pulsations, while three weaker sources show no detectable pulsations. This latter fact is most probably due to their limited statistics. The remaining source was not observed with ASCA. Since Be-XBPs often exhibit X-ray outbursts, we may have a chance to detect X-ray pulsations even from the three weaker sources during their outburst episodes. Thus, long-term monitoring over a wide area of the SMC would be very fruitful in establishing the statistics of the Be-XBP population in a neighboring galaxy.
We are very grateful to an anonymous referee for critical reading and useful comments. We would like to thank all members of the ASCA team. The Einstein and ROSAT data were obtained through the High Energy Astrophysics Science Archive Research Center Online Service, provided by the NASA/Goddard Space Flight Center. J.Y. is supported by JSPS Research Fellowship for Young Scientists.

References
Burke B.E., Mountain R.W., Harrison D.C., Bautz M.W., Doty J.P., Ricker G.R., Daniels P.J. 1991, IEEE Trans. ED-38, 1069
Corbet R.H.D. 1984, A&A 141, 91
Cowley A.P., Schmidtke P.C., McGrath T.K., Ponder A.L., Fertig M.R., Hutchings J.B., Crampton D. 1997, PASP 109, 21
Hughes J.P., Smith R.C. 1994, AJ 107, 1363
Israel G.L., Stella L., Campana S., Covino S., Ricci D., Oosterbroek T. 1998, IAU Circ. 6999
Kahabka P., Pietsch W. 1996, A&A 312, 919
Kahabka P., Pietsch W., Filipović M.D., Haberl F. 1999, A&AS 136, 81
Makishima K., Tashiro M., Ebisawa K., Ezawa H., Fukazawa Y., Gunji S., Hirayama M., Idesawa E. et al. 1996, PASJ 48, 171
Mathewson D.S., Ford V.L., Visvanathan N. 1988, ApJ 333, 617
Nagase F. 1989, PASJ 41, 1
Ohashi T., Ebisawa K., Fukazawa Y., Hiyoshi K., Horii M., Ikebe Y., Ikeda H., Inoue H. et al. 1996, PASJ 48, 157
Schmidtke P.C., Cowley A.P., Crane J.D., Taylor V.A., McGrath T.K., Hutchings J.B., Crampton D. 1999, AJ 117, 927
Serlemitsos P.J., Jalota L., Soong Y., Kunieda H., Tawara Y., Tsusaka Y., Suzuki H., Sakima Y. et al. 1995, PASJ 47, 105
Tanaka Y., Inoue H., Holt S.S. 1994, PASJ 46, L37
Wang Q., Wu X. 1992, ApJS 78, 391
Yokogawa J., Koyama K. 1998, IAU Circ. 7009
Yokogawa J., Imanishi K., Tsujimoto M., Nishiuchi M., Koyama K., Nagase F., Corbet R.H.D. 1999, ApJ submitted
Table 1. Best-fit parameters to the spectra of AX J0051733.
| Phase | Photon index⋆ | Column density⋆ | Flux† | Luminosity†‡ | / |
|---|---|---|---|---|---|
| (H cm-2) | (erg s-1 cm-2) | (erg s-1) | |||
| Average | 1.0 | 4.4 1021 | 3.410-12 | 1.61036 | 36.04/33 |
| (0.0–1.0) | |||||
| High | 1.1 | 4.4 1021 (fix) | 4.310-12 | 2.01036 | 31.37/19 |
| (0.0–0.5) | |||||
| Low | 0.8 | 4.4 1021 (fix) | 2.510-12 | 1.21036 | 12.52/12 |
| (0.5–1.0) |
: Errors are at 90 % confidence level.
: In the 0.7–10.0 keV band.
: Absorption-corrected value at the source distance of 60 kpc (Mathewson et al. 1988).