Confirming EIS Clusters
Optical and Infrared Imaging
Abstract
Clusters of galaxies are important targets in observationally cosmology, as they can be used both to study the evolution of the galaxies themselves and to constrain cosmological parameters. Here we report on the first results of a major effort to build up a sample of distant galaxy clusters to form the basis for further studies within those fields. We search for simultaneous overdensities in color and space to obtain supporting evidence for the reality of the clusters. We find a confirmation rate for EIS clusters of , suggesting that a total of about 80 clusters with are within reach using the EIS cluster candidates.
Astronomical Observatory, Juliane Maries Vej 30, DK-2100 Copenhagen, Denmark
ESO, Karl-Schwarzschild-Str. 2, D-85748 Garching b. München, Germany
Osservatorio Astronomico di Trieste, Via G.B. Tiepolo 11, I-31444 Trieste, Italy
1. Introduction
Distant massive clusters of galaxies are very important targets in observational cosmology, as they can be used both for the study of galaxy populations and to derive strong constraints on the parameters of the cosmological models still debated. It is generally recognized that the most straightforward method to identify high-redshift clusters is based on the detection of their diffuse X-ray emission, but this method becomes prohibitively expensive as the cluster redshift increases above to be applied to extensive searches of such objects (ROSAT PSPC exposures of ksec are needed to detect clusters at On the contrary, with the advent of large-field CCD cameras, it is now possible to carry out large-area optical imaging surveys to the depth required to identify rich clusters at these high redshifts using relatively limited amounts of telescope time. Preliminary efforts towards this goal, although still limited to relatively small areas, include the Palomar Distant Cluster Survey (Postman et al. 1996) and the ESO Imaging Survey (EIS, Nonino et al. 1999).
Distant cluster candidate samples identified from imaging data could however suffer from severe contamination effects, most likely caused by projections along the line of sight, or large-scale fluctuations in the galaxy distribution, that could make the final spectroscopic confirmation process very expensive in terms of telescope time requirements. In this paper and the related paper by Biviano et al. (this volume) we report on a major effort towards quantifying the efficiency of optical searches as well as improving the efficiency of the spectroscopic follow up. Our starting point is the sample of high-redshift cluster candidates identified from the -band EIS data over deg2 (Olsen et al. 1999a,b; Scodeggio et al. 1999). This sample is composed of 302 cluster candidates, with estimated redshifts in the interval (median estimated redshift 0.5), that were identified using the matched-filter algorithm described by Postman et al. (1996).
To effectively address the question of how one efficiently produces a sample of confirmed clusters from the cluster candidates we are pursuing two different follow-up strategies. One is to carry out further deep optical or near-infrared imaging observations, aimed at the detection of the red sequence of cluster early-type galaxies in color-magnitude diagrams. In this case the final spectroscopic observations will be carried out only for those candidates where such a sequence has been detected, targeting preferentially the galaxies in the sequence. The second strategy eliminates this intermediate observations, and is based on multi-object “blind” spectroscopic observations of the cluster candidates (see Biviano et al, this volume). In this paper we report on the results of the first set of deep pointed imaging observations, carried out at various telescopes to obtain , and photometry for the distant clusters. We have obtained data for 27 EIS candidates and investigate the , and color-magnitude diagrams.
2. Observations and Data Reduction
The data considered in this work consist primarily of pointed infrared and optical observations obtained at different telescopes, combined with the EIS -band data. The pointed observations include 1) 15 candidates observed in and using SOFI at the ESO 3.5m New Technology Telescope (NTT) at La Silla; 2) 4 candidates observed at the Danish 1.5m telesope at La Silla; and 3) 13 candidates observed at the 2.5m Nordic Optical Telescope at La Palma. Table 1 summarizes the available data; giving 1) the instrument; 2) the detector type; 3) the pixel scale in arcsec/pixel; 4) the field of view in arcmin; 5) the typical limiting magnitude for the object catalogs; and 6) the number of candidates observed with that instrument.
| Instrument | CCD | pix.scale | field-of-view | cand. | |
|---|---|---|---|---|---|
| SOFI | Rockwell, Hawaii | 0.29 | 4.9’4.9’ | 15 | |
| @NTT | 10241024 | 15 | |||
| DFOSC | Loral/Lesser | 0.39 | 13.7’13.7’ | 4 | |
| @D1.5m | 20522052 | ||||
| ALFOSC | Loral/Lesser | 0.19 | 6.4’ 6.4’ | 13 | |
| @NOT | 20522052 |
All the data were reduced using the pipeline software developed for the EIS project (Nonino et al., 1999; da Costa et al., 1998). Optical images were reduced using standard IRAF tasks, while the astrometric and photometric calibrations were performed using specially developed pipeline programs. The infrared images were reduced using the Eclipse software package (Devillard, 1998) and the calibrations were based on the same programs as for the optical data.
Color catalogs are derived from the single band galaxy catalogs obtained using SExtractor (Bertin & Arnouts, 1996). A procedure in the EIS pipeline combines the separate object detections into a color catalog, based on positional match between the single band detections. Colors are computed from total magnitudes (SExtractor mag_auto, see also Prandoni et al, 1999). Only objects with SExtractor stellarity index and extraction flags are included in the single band catalogs.
3. Color confirmation
The EIS cluster search was based on -band data only, using the characteristic luminosity function and spatial distribution of the cluster galaxies as the basis for the adopted filter (see Olsen et al., 1999a). The confirmation process is based on two well known properties of the cluster early-type galaxy population, namely its preferential location in the core of rich clusters, and the small scatter shown by its colors. Therefore our confirmation procedure is constructed to detect simultaneous color and space overdensities.
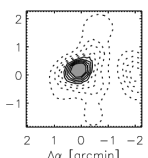
To explore in detail such three-dimensional space we split the galaxy color catalogs in slices of color 0.3mag wide (the width is dictated by the estimated error of the faintest galaxies). We make two such sets of slices shifted by half a bin width to assure an equally good coverage at all colors. For each color slice we smooth the galaxy distribution to obtain the density in a pixel grid with a typical scale of 0.25arcmin. To assess the significance of the detected overdensities we use 500 simulations for each color slice and thereby compute the density distribution expected from a uniform galaxy distribution. We consider a cluster confirmed when a density peak with a confidence level is detected within 1arcmin from the original catalog position. In figure 1 we show an example of the galaxy distribution and corresponding density maps for a confirmed cluster, the shaded area corresponding to the region where a confidence level above 95% is reached.
The method was applied to all candidates for which deep pointed observations were available and in figure 2 we show the redshift dependence of the confirmation rate. It is seen that the confirmation rate is about in the entire redshift interval, suggesting that a sample of 80 clusters at is within reach, based on the EIS cluster catalog. As discussed by Biviano et al. (this volume) the confirmation rate derived from spectroscopic observations supports this result.

4. Conclusions
Using color information we obtain strong evidence that 18 out of 27 () of the EIS cluster candidates analyzed in this work are physical associations. Their estimated redshifts extend to about . If the color confirmed clusters are spectroscopically confirmed this method opens the possibility of obtaining a sample of 80 clusters of galaxies at within very short timescales. This cluster sample will be invaluable to any study of high redshift clusters and of the cluster galaxy populations.
References
Bertin, E., & Arnouts, S., 1996, A&AS, 117, 393
da Costa, L., Nonino, M., Rengelink, R., et al. 1999, submitted to A&A, (see also astro-ph/9812105)
Devillard, N., 1998, Eclipse data analysis software package, ESO
Nonino, M., Bertin, E., da Costa, L., et al. 1999, A&AS, 137, 51
Olsen, L.F., Scodeggio, M., da Costa, L., et al. 1999a, A&A, 345, 681
Olsen, L.F., Scodeggio, M., da Costa, L., et al. 1999b, A&A, 345, 363
Postman, M., Lubin, L., Gunn, J.E. , et al. 1996, AJ, 111, 615
Scodeggio, M., Olsen, L.F., da Costa, L., et al. 1999, A&AS, 137, 83