The hyperluminous infrared quasar 3C 318 and its implications for interpreting sub-mm detections of high–redshift radio galaxies
Abstract
We present near-infrared spectroscopy and imaging of the compact steep-spectrum radio source 3C 318 which shows it to be a quasar at redshift (the value previously reported is incorrect). 3C 318 is an IRAS, ISO and SCUBA source so its new redshift makes it the most intrinsically luminous far-infrared (FIR) source in the 3C catalogue (there is no evidence of strong gravitational lensing effects). Its bolometric luminosity greatly exceeds the level above which an object is said to be hyperluminous. Its spectral energy distribution (SED) requires that the quasar heats the dust responsible for the FIR flux, as is believed to be the case in other hyperluminous galaxies, and contributes (at the % level) to the heating of the dust responsible for the sub-mm emission. We cannot determine whether a starburst makes an important contribution to the heating of the coolest dust, so evidence for a high star-formation rate is circumstantial being based on the high dust, and hence gas, mass required by its sub-mm detection. We show that the current sub-mm and FIR data available for the highest-redshift radio galaxies are consistent with SEDs similar to that of 3C 318. This indicates that at least some of this population may be detected in the sub-mm because of dust heated by the quasar nucleus, and that interpreting sub-mm detection as evidence for very high () star–formation rates may not always be valid. We show that the 3C318 quasar is slightly reddened (), the most likely cause of which is SMC-type dust in the host galaxy. If very distant radio galaxies are reddened in a similar way then we show that only slightly greater amounts of dust could obscure the quasars in these sources. We speculate that the low fraction of quasars amongst the very high redshift () objects in low–frequency radio–selected samples is the result of such obscuration. The highest-z objects might be preferentially obscured because like 3C318 they are inevitably observed very shortly after the jet-triggering event, or because their host galaxies are richer in dust and gas at earlier cosmic epochs, or because of some combination of these two effects.
keywords:
galaxies: active – galaxies: nuclei – quasars: general – galaxies: evolution1 Introduction
The compact radio source 3C 318 was identified with a faint “galaxy” on Palomar sky survey plates by Véron (1966) and Wyndham (1966). A spectrum of this object was obtained at the Lick Observatory by Spinrad & Smith (1976; hereafter SS76), which showed a faint, red continuum and two weak emission features which they identified as MgII and [OII] at a redshift of . Their MgII line appeared to be broad and they classified the object as an N galaxy. At this time it was the galaxy with the highest known redshift in the 3CR sample (Smith, Smith & Spinrad 1976). Willott et al. (1998) classified 3C 318 as a broad-line radio galaxy on the basis of its calculated absolute blue magnitude falling just fainter than the quasar threshold of .
3C 318 is a member of the class of radio sources known as compact steep-spectrum (CSS) sources. These sources are usually defined as having projected linear sizes kpc and high-frequency radio spectral indices 222We assume throughout that and , unless stated otherwise. The convention for all spectral indices, , is that , where is the flux density at frequency .. There is still some debate over whether these sources are small because they are young, or whether they are confined by anomalously dense environments (e.g. Fanti et al. 1995). Recent evidence strongly supports the former hypothesis (e.g. Murgia et al. 1999), although selection effects (e.g. Blundell & Rawlings 1999) may also favour unusually dense environments for the CSS population. Taylor, Inoue & Tabara (1992) found a high Faraday rotation measure in 3C 318. This, together with a radio spectrum flattening at low frequency (perhaps due to thermal absorption), is suggestive of a dense environment.

| Line | FWHM | Flux | Wλ | Notes | |||
|---|---|---|---|---|---|---|---|
| (Å) | (Å) | (Å) | ( W m-2) | (Å) | |||
| CIII] | 1909 | 4906 | 1.570 | — | 1.1 | 30 | SS76 |
| H | 4340 | 11186 | 1.577 | 110 | 1.0 0.3 | 20 7 | |
| H | 4861 | 12524 | 1.576 | — | 4.2 1.4 | 110 60 | low snr - uncertain centre |
| H | 6563 | 16899 | 1.575 | 220 | 16.0 3.0 | 700 200 | blended with [NII] |
| 4959 | 12755 | 1.572 | 60 | 3.5 0.5 | 80 20 | ||
| 5007 | 12886 | 1.574 | 65 | 9.5 1.0 | 200 50 | ||
| 6716/6731 | 17304 | 1.574 | 95 | 1.1 0.4 | 60 20 | blend |
Another peculiarity of 3C 318 is its high IRAS far-infrared (FIR) flux. Hes, Barthel & Hoekstra (1995) report a flux of mJy. Very few other 3CR sources at were detected by IRAS and those that were are all quasars, mostly with strong radio cores, where the FIR flux is likely to be dominated by a non-thermal beamed component (Hoekstra, Barthel & Hes 1997). Assuming that the FIR radiation from 3C 318 is not beamed (the probable radio core is very weak, Lüdke et al. 1998), it implies an enormous infrared luminosity, due to dust heated by either the active nucleus or a starburst.
Due to the fact that, despite the clearly broadened emission line in the spectrum of SS76, 3C 318 is still considered by many authors as a narrow-line radio galaxy, we obtained near-infrared spectra to search for evidence of other broad emission lines, such as H. In Section 2 we present our observations, clearly showing that 3C 318 actually lies at a much higher redshift than previously believed and is lightly reddened in the observed-frame optical. In Section 3 we consider the infrared and sub-mm properties of 3C 318 given its new redshift. In Section 4 we consider the implications of our findings for the population of high–redshift radio sources detected at sub-mm wavelengths.
2 Observations
2.1 Near-infrared spectroscopy
3C 318 was observed under photometric conditions with the CGS4 spectrometer at UKIRT on 1999 January 12. We used the 40 lines mm-1 grating and the long (300 mm focal-length) camera. Exposures were made in both first and second orders to give wavelength coverage of most of the region from 1–2 m. The first order spectrum was centred at 1.71 m and has a resolution of 0.008 m. The second order spectrum was centred at 1.20 m and gives a resolution of 0.003 m. A 2-pixel (1.2 arcsec) slit was centred on the position of the radio core [RA , DEC (B1950.0)] oriented at a position angle of 90∘. Total exposure times were 800s in first order and 1600s in second order. The standard stars HD18881 and HD44612 were observed to enable flux-calibration. In addition an F star was observed at the same airmass as the second order observation to enable removal of atmospheric absorption features. Unfortunately, there was insufficient time left to observe this star in first order, so we use one from earlier in the night at a similar airmass of 1.1.
The observations were reduced in a standard way. Briefly, the steps involved were; combine flat-fielded observations taken at different positions along the slit, wavelength calibrate using sky OH emission lines, subtract residual background, extract 2 pixel (1.2 arcsec) and 6 pixel (3.6 arcsec) wide aperture spectra from the 2-D images, combine ‘positive’ and ‘negative’ spectra, flux-calibrate using standard stars and finally removal of atmospheric absorption by dividing by normalised F stars.
The resulting 2 pixel wide aperture spectra are shown in Figure 1. These spectra have been boxcar-smoothed by 3 pixels (36Å) in first order and 5 pixels (30Å) in second order. 6 emission lines are clearly detected with good signal-to-noise. The emission line data are presented in Table 1. Note that these lines clearly indicate a much higher redshift than that of deduced by SS76. The redshift adopted here is , determined from a gaussian fit to the narrow [OIII] line. This redshift is consistent with the broad feature at 4906 Å identified by SS76 as MgII , actually being CIII] .
The narrow emission feature at 6528 Å in the spectrum of SS76, which they identified as [OII], is either spurious or from another object along the line of sight. It corresponds to a rest-frame wavelength of Å with our new redshift determination, which does not correspond to any known, bright emission line. Gelderman & Whittle (1994) looked for [OIII] emission in 3C 318 at the redshift of SS76. They did not detect any line emission down to a limit of Wm-2, but detected the continuum at a comparable strength to SS76. This would imply a ratio of [OIII]/[OII] flux less than one (which although highly unusual for a powerful radio source does not rule out emission from a foreground object). Furthermore, no H at (m) is detected in our NIR spectrum to a limit of Wm-2. Therefore we conclude that this feature is probably spurious.
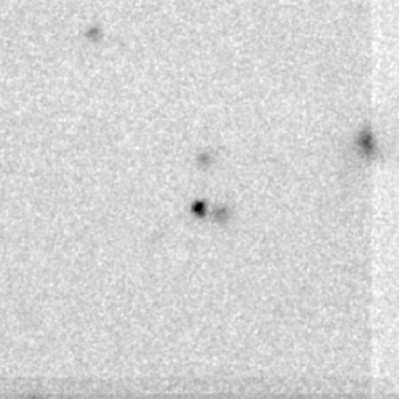
Fig. 1 shows all the characteristics of a quasar; a blue continuum slope () and broad permitted lines. The H line suffers from noisy features in its wings, so no estimate of its width can be made. However the H line clearly has a broad base, although there is some evidence for a strong narrow central component. Unfortunately the resolution of this spectrum is insufficient to fully deblend the various components. A single Lorentzian line profile with Å (4000 km s-1) provides a good fit to the line (reduced ), but the best-fit single Gaussian profile is significantly worse (reduced ). Note that the broad H is blended on the red side with narrow [NII] emission which is just visible as a shoulder on the line profile in Fig. 1, but this makes a negligible difference to the line fitting given above. Based on these broad emission lines (H and CIII] from SS76) we clearly identify 3C 318 as a quasar. Due to the increase in its redshift, its absolute magnitude is now much more luminous than the division between quasars and BLRGs of . Using the magnitudes reported in Section 2.2 we determine an absolute magnitude in the rest-frame of .
2.2 Optical and near-IR imaging
The field of 3C 318 was imaged with the IAC-80 telescope of the Observatorio del Teide, Tenerife on 1999 January 30. Exposures were made in Johnson (2400 seconds), (2400s), (1200s) and (1200s) filters, using a 10242 pixel CCD, with a pixel scale of 0.435 arcsec pix-1. Conditions were photometric and the seeing was arcsec. The Landolt photometric standard 106-700 was observed for calibration. The images were reduced using standard procedures. The quasar 3C 318 was detected in all filters. We have corrected the measured magnitudes for galactic extinction using from the IRAS 100 m cirrus map. We deduce 4 arcsec aperture magnitudes of , , and . These and colours are consistent with those measured by SS76 and indicate a very red optical continuum.
Near-infrared imaging of 3C 318 was performed at UKIRT, using the UFTI camera. UFTI is a HgCdTe array with a pixel scale of 0.091 arcsec pix-1. 540 second exposures in the and bands were obtained on the photometric nights of 1999 March 6 and 1999 March 12, respectively. These images were reduced using standard procedures. The seeing was approximately 1.0 arcsec, but due to guiding problems the images have a slightly non circularly–symmetric PSF. In Figure 2 3C 318 appears unresolved at -band. A faint galaxy () lies 2 arcsec west of the quasar. 3 arcsec aperture photometry was performed on these images to be consistent with the optical photometry at FWHM(seeing). We measure magnitudes of and for 3C 318. The magnitude is then adjusted for a 30% contribution from emission lines as measured on the NIR spectrum giving . The magnitude is adjusted for a 10% contribution from the nearby galaxy giving . The nearby galaxy does not make a significant contribution in -band. An estimate of the line-less -band magnitude was obtained by assuming a colour of 0.4, as observed in the NIR spectra.
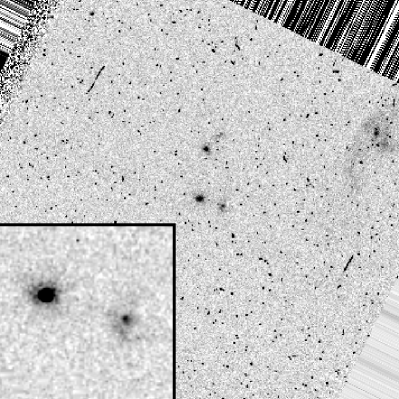
We have retrieved a Hubble Space Telescope WFPC2 image of 3C 318 from the HST archive (PID 5476, P.I. Sparks). This image is a 300 second integration with the F702W filter (Figure 3). 3C 318 has a very strong point-source component at 0.1 arcsec resolution, with possible very faint extended emission ( arcsec). Unfortunately the lack of a bright star in the field to give a reliable point-spread function prevents us from doing a PSF-subtraction analysis. However, we note that the flux, size and apparent symmetry of the faint, extended emission are consistent with the expected properties of a radio source host galaxy at . The close companion seen in the -band image has a peculiar structure in the HST image, with an apparent bright nucleus and a possible spiral arm to the south (but it is impossible to be certain that the bright unresolved nucleus is not actually due to a cosmic ray impact). The optical-NIR photometry of the nearby galaxy () is fitted by a power-law with . The magnitude was measured from the HST image in a 1 arcsec aperture and the and magnitudes in 1.5 arcsec apertures to avoid significant flux from the quasar. Since the power-law spectrum of this object cannot constrain its redshift, we instead consider its luminosity. If this galaxy is at the same redshift as 3C 318, then it would have a luminosity of . If it is an galaxy then it would be at . Given the strong nuclear component in this object, we conclude it is possible that it is a very luminous galaxy at the same redshift as the quasar, possibly interacting with the quasar on the evidence of the HST morphology. However, it is also possible that it is at a significantly lower redshift. Future optical spectroscopy in good seeing is required to determine its redshift and whether it too hosts an AGN.
Photometry of the HST image is consistent with that of our ground-based image. We find that the nearby galaxy contributes 0.16 magnitudes to the IAC-80 magnitude at -band. Making the assumption that this fractional contribution is the same in the bands (an assumption consistent with the observed optical-NIR photometry), all the IAC-80 magnitudes of 3C 318 have been corrected for this contamination.

In Fig. 4 we show the rest-frame UV to optical photometry of 3C 318. The shape of the spectrum is rather unusual with a steep spectral index in the UV, which flattens at Å and then increases again at Å. This sharp change between and may be due to a photometric error at -band since this has been calculated assuming a colour from the NIR spectroscopy. Alternatively, it may be a real effect due to strong emission from hot dust dominating at -band. Note that we have corrected for the strong emission lines in the and bands and line contributions in other bands are expected to be negligible. Making the assumption that the quasar continuum dominates at all wavelengths, we have attempted to fit these data with a reddened quasar. We find that there is no way that reddening by galactic-type dust can fit the photometry. SMC-type dust (which has a much higher ratio of absorption in the UV to in the optical than that of our galaxy) provides a reasonable fit as shown in Fig. 4 with . Note that reddening by intervening material at a lower redshift than the quasar (i.e. in our galaxy or in an object along the line-of-sight) would give a much worse fit and is extremely unlikely.
Other estimates of quasar reddening may be derived from relative emission line strengths. We find that the Balmer decrement (the ratio of the fluxes of H and H) is , a typical value for unreddened quasars. This is consistent with the lack of severe reddening seen in the observed-frame NIR. For small values of reddening it is necessary to move to the rest-frame UV lines to get a clearer indication of BLR reddening (although ionisation and metallicity uncertainties introduce scatter here). The ratio of observed H to CIII] fluxes is 1. This compares with a ratio of 2 for optically-selected quasars (Francis et al. 1991). If the broad lines in 3C 318 undergo the same reddening as the continuum shown in Fig. 4, then one would expect the ratio of H to CIII] to increase by a factor of 2 from its intrinsic value. Thus the observed ratios are perfectly consistent with this amount of reddening. Therefore we conclude that there is extinction towards the nucleus of 3C 318. Whether this occurs in the host galaxy or due to the edge of a dusty torus (e.g. Baker 1997) is not clear from these observations.
3 3C 318: A hyperluminous infrared quasar
Given the new redshift of 3C 318 presented in this paper, the high infrared flux of this source is even more interesting. It is the most luminous 60 m source in the 3CR sample with W (assuming as in Hes et al. 1995). Recent ISOPHOT observations detect the quasar at 60 and 90 m, however it was undetected at the longer wavelengths of 174 and 200 m (C. Fanti et al. in prep.). We note that the ISO 90 m flux is inconsistent with the IRAS 100 m flux given by Heckman et al. (1992) – see Figure 5. Given the much smaller error of the ISO data, we assume here that the IRAS 100 m measurement (which is 3 times greater than the ISO 90 m flux) is erroneous. The 60 m fluxes from IRAS and ISO are consistent within the errors. 3C 318 has also recently been reliably detected in the sub-mm at 850 m with SCUBA at the JCMT with a marginal detection () at 450 m (E. Archibald; priv. comm.). A useful upper limit at 1300 m has been obtained with IRAM (Murgia et al. 1999).
In Fig. 5 we plot the rest-frame radio to X-ray spectral energy distribution (SED) of 3C 318 using data from this paper, the literature and unpublished data reported to us by E. Archibald and C. Fanti. The high-frequency radio spectrum is steep () up to the highest frequencies measured ( GHz). The sub-mm and IR data show a clear excess above the extrapolation of the radio SED. Thus we can be confident that the high FIR luminosity is not due to beamed synchrotron radiation as in the other most extreme FIR-luminous 3CR quasars (Hoekstra et al. 1997). Indeed, the shape of the spectrum from the sub-mm to the mid-infrared (MIR) is characteristic of a thermal dust spectrum, peaking at Hz.

There is now a consensus view concerning the interpretation of the thermal dust spectra of quasars at (rest-frame) mid-IR (3-30 m) wavelengths. This emission is thought to be heated primarily by the quasar nucleus, and this is strongly supported by the remarkably tight correlation between the optical and mid-IR luminosities of quasars (e.g. Rowan-Robinson 1995; Andreani, Franceschini & Granato 1999). The shape of the thermal-IR SEDs of quasars, specifically its flatness followed by a gradual roll-over at m, favours dust in a torus which extends from pc (inner edge controlled by distance at which the temperature falls below the dust sublimation value) to of at least 100 pc. The more compact tori postulated by Pier and Krolik (1992) are ruled out because these would peak at m and cut-off sharply at longer wavelengths.
It is therefore natural to interpret the ISO detections of 3C318 in this context. Using the dereddened optical-UV flux of 3C 318 as shown in Fig. 5 and assuming a power-law for the far-UV up to a cut-off at Hz, we calculate an integrated optical-UV luminosity of W (). The mid-IR luminosity is a factor of 3-6 greater than this depending upon the form of the SED at rest wavelengths m, where there are only upper limits from IRAS. This high ratio of MIR to UV luminosity is reminiscent of the Cloverleaf quasar (Granato, Danese & Franceschini 1996) and suggests a very high covering factor for the dust.
There is, however, controversy concerning the interpretation of the far-IR (30-1000 m) dust spectra of quasars. On the one hand it is possible that it is just an extrapolation of the quasar-heated mid-IR spectrum (e.g. Granato et al. 1996; Andreani et al. 1999). These models are attractive because of the similar ratios of far-IR to mid-IR fluxes in quasars of widely different luminosities (Haas et al. 1998; Wilkes et al. 1999). However, they require a large amount of relatively cool dust at large radii (up to kpc) from the quasar. On the other hand, Rowan-Robinson (1995) argues that dust tori cannot provide sufficient far-IR luminosity and the FIR radiation is due to a massive starburst. Support for this idea comes from the observation that in NGC 1068 the bulk of the FIR emission is resolved into a starburst ring approximately 3 kpc from the nucleus (Telesco et al. 1984). Another example is IRAS F10214 where gravitational lensing magnifies the inner regions and the CO emission is observed to come from a region of intrinsic size pc (Downes, Solomon & Radford 1995). This would appear to be at odds with the kpc disk required by the models of Granato et al. (1996), subject to uncertainties due to the lensing. Detailed studies of IRAS F10214 (e.g. Lacy, Rawlings & Serjeant 1998) conclude that there is substantial star-formation going on on 100 pc scales that, provided it is shielded from the nuclear radiation field, could heat up cool dust on the requisite scales.
To investigate whether the observed sub-mm emission from 3C 318 could be due to dust in an extended torus heated by the quasar, we use the models of Granato & Danese (1994) and compare them to the observed SED in Fig. 5. The models used here have a covering factor of 0.8 and a constant dust density in the disk with an optical depth at 0.3 m of 50. A covering factor as large as this is suggested by the ratio of MIR to UV luminosities discussed previously. There is a strong viewing angle dependence for m, but this is not important for comparing the ISO and sub-mm fluxes. The extent of the disk is determined by the ratio of the maximum to minimum radii . For 3C 318, pc from the optical-UV luminosity calculated previously. The ratio of FIR to MIR luminosity increases as increases. To simultaneously fit the mid-IR and far-IR data, a large maximum radius of kpc is required. If one reduces to pc, then the model accounts for only 10% of the sub-mm emission observed at 850 m. In this case, the bulk of the sub-mm emission would have to be due to star-formation. Note that the optical flux of 3C 318 falls between the pole-on and edge-on models plotted in Fig. 5, possibly indicating an intermediate orientation (as well as the high dust covering factor discussed earlier).
Deriving the temperature of the coolest dust from observations such as these is a difficult problem, due to uncertainty in several parameters such as the dust optical depth and emissivity (e.g. Hughes et al. 1993). Here we attempt to model the dust spectrum as an isothermal greybody and derive limits on the dust temperature allowed by the data. We find that isothermal models cannot provide an acceptable fit (reduced ). This is because the ISO measurements at 90 and 60m are almost certainly due to emission from hot dust in the torus as explained above, whereas the sub-mm emission is from a cooler dust component. Excluding the 60 m data point from the fit leads to models providing acceptable fits with temperatures in the range 45 K K. However even this determination is probably not valid due to the inclusion of the 90 m point and we conclude that the temperature of the cool dust component is undetermined from these observations. In Fig. 5 we plot a dust model with K, which is consistent with the sub-mm and 90 m data. Assuming a temperature of 50 K for the cool dust, we calculate the mass of dust responsible for the optically thin sub-mm/FIR luminosity as in Hughes, Dunlop & Rawlings (1997). We find that there is approximately of dust, a value similar to those of the radio galaxies 4C 41.17 and 8C 1435+635 (Hughes & Dunlop 1999).
From the SED as shown in Fig. 5 we have attempted to calculate the total sub-mm/IR luminosity of 3C 318. Fitting a T=100 K isothermal dust model through the sub-mm and ISO data gives a reasonable estimate of the FIR luminosity of ( for ). In fact, the total IR luminosity is likely to be greater than twice this value, due to significant emission at wavelengths below 25 m which is not well-determined from current observations. Thus 3C 318 meets the criteria of to be classified as a hyperluminous infrared galaxy (HyLIG). As noted by Rowan-Robinson (1996) and Hines et al. (1995), the first HyLIGs to be discovered all contained obscured AGN and this trend appears to be continuing as more are discovered (e.g. van der Werf et al. 1999). Genzel et al. (1998) and Lutz et al. (1998) have found that in low-redshift ultraluminous infrared galaxies (ULIRGS, ), it is starbursts and not AGN which are the predominant source of heating for the mid-IR, but that the fraction of AGN increases with luminosity. Thus it would appear that for the most luminous infrared galaxies, an active nucleus is a requirement and that there is an upper limit to the infrared luminosity due to star-formation. This idea will be developed further in the following section. Note that 3C 318 would not have been selected as a HyLIG by the selection criteria of van der Werf et al. (1999) because, despite the reddening of the UV continuum, its ratio of 60 m to -band luminosity, is below their adopted limit of 100. Thus HyLIGs with a strong quasar component which is not heavily obscured, or heavily scattered, will be missed using such criteria.
We should however sound a note of caution here. The three HyLIGs discovered with the highest FIR luminosities of (APM08279+5255, H1413+117 and IRAS F10214+4724) are gravitationally lensed and their FIR luminosities are magnified by an order of magnitude or more (see Ibata et al. 1999 and references therein). Is it possible that 3C 318 is also being lensed? The HST image shows no evidence of possible lensing galaxies, or distortion of the quasar continuum. The nearby galaxy south-west of the quasar is 2 arcsec away, which is significantly more than the arcsec Einstein radius of an isolated massive galaxy (e.g. Peacock 1999). For an Einstein radius of 2 arcsec, a group or cluster would be necessary, of which there is no sign in our images. In addition, there are no obvious distortions of the compact radio structure over a variety of scales from 30 milliarcsec to 1 arcsec (Spencer et al. 1991; Taylor et al. 1992), suggesting it is not strongly lensed.
4 The relationship of 3C 318 to the distant radio galaxy population
4.1 Implications for star-formation rates
Blank field surveys at 850 m with SCUBA are now revealing a population of objects with very high FIR luminosities which are likely to be at high redshifts (Hughes et al. 1998; Smail et al. 1998; Eales et al. 1999). Optical follow-up has shown that at least 20% of these sources are associated with AGN (e.g. Barger et al. 1999), although the fraction of the integrated observed sub-mm luminosity heated by AGN is extremely uncertain. It could be higher than this value if the other 80% of sources contain obscured AGN or it could be lower if even in sources with identified AGN, the far-IR radiation is due to starbursts. Recently, models of the sub-mm contribution from the AGN responsible for the X-ray background have shown that it is indeed expected to be at approximately the 20% level but there are still large uncertainties with respect to the fraction of obscured AGN and their evolution (Almaini, Lawrence & Boyle 1999; Gunn & Shanks 1999). The other population of known high- sources targeted (and often detected) with SCUBA are powerful AGN – radio galaxies and radio-quiet quasars. In these cases it is normally assumed that the huge FIR luminosities are due to a massive starburst (SFR ), however it is possible that it is actually the AGN that heats the dust. In this section we investigate the relationship of 3C 318 to the population of high-redshift () radio galaxies detected in the sub-mm and the cause of dust-heating in these objects.
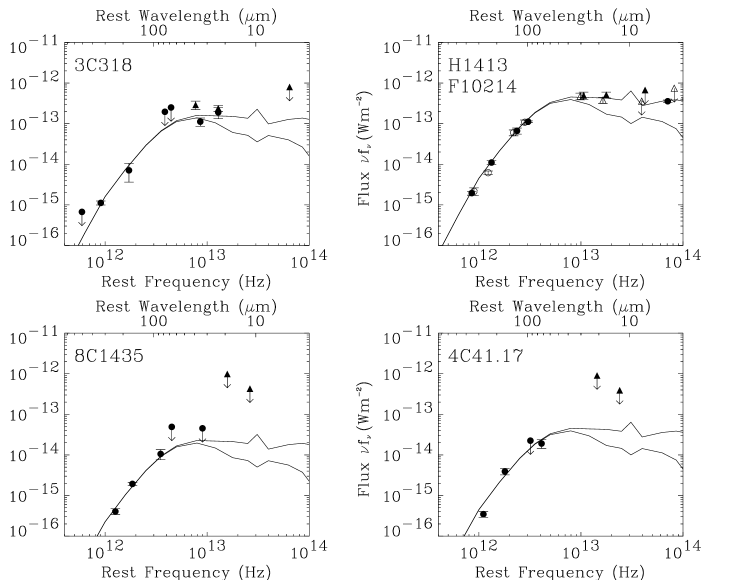
In Section 3, we showed that models of AGN dust tori can account for both the ISO and SCUBA fluxes of 3C 318 if the dust is distributed in an extended torus/disk out to kpc from the quasar. If a large amount of dust on these scales is not present then the sub-mm flux must be accounted for by a starburst. In Fig. 6 we plot the sub-mm – IR SEDs of 3C 318, the Cloverleaf quasar H1413+117, IRAS F10214+4724 and two radio galaxies 8C1435+635 and 4C41.17. The SED of 3C 318 is strikingly similar to that of H1413 and F10214, with a similar ratio of FIR to MIR fluxes. A similar correlation between the luminosities of hot and cool dust components for PG quasars was found by Rowan-Robinson (1995). This correlation can be interpreted in two ways. The correlation is a natural consequence if the cool dust is in the outer regions of a dusty torus/disk and the hot dust in the inner regions and they are both heated by the quasar. Alternatively, if the cool dust is heated by a massive starburst, this must be connected to the AGN in terms of triggering and fueling. Rowan-Robinson (1995) argued that the larger scatter in the correlation between FIR and optical fluxes than that of MIR and optical fluxes showed evidence for the latter view.
In Fig. 6 we plot the same model SED from Granato & Danese (1994) which we used for 3C 318 in Section 3. The same model (with ) is used in all cases with only the normalisation differing. The upper curves show a direct view of the quasar and the lower curves an edge-on view to the nucleus. This model fits the observations of 3C 318, H1413 and F10214 well. Similarly these SEDs could be fit by two-component models involving an AGN + starburst (e.g. Rowan-Robinson & Crawford 1989)
The radio galaxies 8C1435+635 and 4C41.17 have both been detected at 850 and 1300 m. The sub-mm – FIR SEDs of these galaxies have previously been fitted by K isothermal dust and hence very high star–formation rates of inferred (e.g. Hughes et al. 1997). Fig. 6 shows that the same model as applied to the quasars above is also consistent with the SEDs of these two radio galaxies. But since the only detections are at mm and sub-mm wavelengths, the data are equally consistent with low temperature ( K) starbursts. We point out here that the current data at IR wavelengths is not sensitive enough to distinguish between these possibilities. The lack of a bright quasar nucleus in either of these objects implies that the edge-on view SED would be more appropriate to compare with the data. These two objects (and indeed all the other SCUBA-detected radio galaxies at ) are extremely powerful radio sources and are expected to harbour quasars at least as luminous as those of 3C 318, H1413 and F10214 (e.g. Rawlings & Saunders 1991). Thus there is sufficient energy from the AGN available to heat the cool dust and cause the sub-mm emission.
A basic consideration for determining the heating mechanism in AGN is whether the sub-mm emission is co-incident with the optical/radio AGN. This is required for the AGN-heated torus/disk model, but not necessarily for the starburst model, since the starburst could be centred on a different physical region, e.g. in the case of a merger. Unfortunately, SCUBA does not have the resolution required for this type of study, but observations in the mm regime with interferometric arrays are now approaching the required resolution and sensitivity. Guilloteau et al. (1999) show that of 6 high-redshift quasars detected at 1.35mm with IRAM (resolution arcsec2), only one shows extended emission – the quasar BR1202-0725 which has two peaks offset by 4 arcsec (Omont et al. 1996). Similar resolution IRAM observations show that 4C 60.07 () has 1.25mm emission offset from the probable radio core by 4 arcsec (Papadopoulos et al. 1999). In these cases it is hard to reconcile the observations with mm/sub-mm heating by an AGN and a starburst seems the most likely candidate. A systematic study of the morphology of mm continuum and CO emission in high- AGN with the planned large millimetre arrays should provide a conclusive answer to this question.
Note that independent of whether AGN or starbursts provide the dominant source of dust-heating in high–redshift radio galaxies, the very existence of such huge quantities of dust () indicate that substantial star–formation has already taken place at these high redshifts (e.g. Hughes et al. 1997) giving a consequently high redshift for the epoch of formation of these massive elliptical galaxies. The high dust masses (and CO masses where detected) imply high gas masses, and by analogy with ULIRGS, and ideas about star-formation efficiency, these are expected to be undergoing a minimum amount of star-formation () given by the edge of the scatter in the dust mass – correlation (e.g. Fig. 9 of Hughes et al. 1997). This is powerful circumstantial evidence for star-formation at at least a high, if not extreme, level in these objects.
4.2 Radio properties and the quasar fraction at high-
3C 318 was detected by the Einstein X-ray satellite and assuming the new redshift of we calculate a luminosity of W. This is consistent with the correlation between X-ray luminosity and optical luminosity for 3CR quasars observed by Einstein (Tananbaum et al. 1983). Therefore we conclude that this X-ray emission most likely comes from the quasar nucleus, although it is possible that there is a significant contribution from hot cluster gas. In the ROSAT study of Crawford & Fabian (1996) 3C 318 was observed with the shortest exposure time in their sample and was not detected. The upper limit obtained does not allow us to constrain the hardness of the X-ray spectrum and any absorption present.
The radio source 3C 318 has an angular size of 0.8 arcsec (Spencer et al. 1991). This gives a projected linear size of 7 kpc for (10 kpc for ). VLBI observations at 1.67 GHz with 30 milliarcsec resolution show a co-linear structure with one compact component contributing % of the total flux (Spencer et al. 1991). Polarization observations at a range of frequencies reveal high polarization in this component (although due to their lower resolution they also include significant flux from other components), with the polarization decreasing from 17% at 15 GHz (van Breugel et al. 1992) to 3.6% at 5 GHz (Lüdke et al. 1998). The SW lobe has very low polarization at all frequencies. Lüdke et al. speculate that the core is a weak source SW of the bright component in the map of Spencer et al. The bright, highly polarized component is then a jet, which appears to undergo significant Faraday depolarization. This depolarization most likely occurs as the radiation passes through hot dense gas in the central regions of the galaxy. The dusty, extended disk model for the sub-mm emission of Granato & Danese (1994) could explain why the southern lobe has no measurable radio polarization at all. If the ionized component of the ISM is also over-dense in the plane of the dusty disk, then it might completely depolarize the southern radio component, while the polarization of the northern jet pointing towards us would be much less affected. Shocks from the radio jets may have destroyed much of the dust towards our line-of-sight, thus presenting a relatively clear view towards the nucleus (as proposed for 8C1435+635 by Lacy 1999).

A small linear size and high Faraday depolarization, implying youth and a dense environment as we have just discussed for 3C 318, are also common features of the most distant known radio galaxies (Carilli et al. 1997). These are almost certainly selection effects as discussed by Blundell, Rawlings & Willott (1999) in that the highest redshift members of a sample must have extreme radio luminosities which require high jet powers, low ages and possibly high density environments. It is interesting then that these factors are commonly associated with hyperluminous infrared emission. It would seem that to get a hyperluminous infrared object, the requirements are a very luminous quasar (since jet power is well correlated with ionising continuum luminosity; Rawlings & Saunders 1991; Willott et al. 1999b) and a very large dust mass. The large dust masses in these objects may be a consequence of their relatively recent onset of AGN activity (Blundell & Rawlings 1999), presumably synchronised with a merger in which gas and dust get delivered to the central regions. The high covering factors required for hyperluminous IR emission could indicate a transient phase as copious quantities of fuel are first delivered to a supermassive black hole, or even as the black hole first forms (e.g. Granato et al. 1996). The high luminosity quasar may be the feedback process that necessarily results from the massive star-formation induced by particular phases of the major merger, and which regulates the timescale of the triggered starburst. As Sanders et al. (1989) proposed, once all the dust and gas has been blown away, the quasar could pass through a naked, IR-quiet period until it uses up all its fuel and dies.
One of the surprising results from low–frequency radio selected samples of high–redshift sources is that there appear to be very few quasars at , although this may at least partly be due to selection effects (Jarvis et al. in prep.). At lower redshifts, such samples (which are selected on orientation–independent, extended radio emission) have a quasar fraction of (Willott et al. 1999a). Our observations of 3C 318 and its similarity to 8C1435+635 and 4C41.17 may provide a clue. At , optical spectroscopy probes only up to Å in the rest-frame. A significant amount of SMC-type dust (which has a factor of 3 times higher absorption at 2000 Å than at 5500 Å) could completely extinguish the quasar broad line and continuum flux. Assuming the narrow line region is largely unaffected by this dust (i.e. the dust is within the radius of the bulk of the narrow line emission kpc) then these sources would appear as radio galaxies. Figure 7 shows how this could be achieved with just of quasar reddening with SMC-type dust.
Note however that most high–redshift sources are faint in -band (, Jarvis et al. in prep) and luminous quasars would require higher reddening () to reduce their -magnitudes to these values. A particularly interesting case is that of the radio galaxy B2 0902+34 which has a non-thermal detection at 2.9 mm (Downes et al. 1996) and has radio properties resembling a quasar (Carilli et al. 1995), however no quasar point-source is seen in the optical or near-infrared. These observations imply a large obscuring optical depth near to the jet axis and a more isotropic dust distribution than in the standard torus model. Ongoing SCUBA observations of high–redshift radio sources will be required to see if large dust masses are frequent in these objects. Thermal-infrared (3.5 m) imaging with 8-10 m telescopes will show if a substantial fraction of them do indeed contain lightly–reddened quasars (e.g. Simpson, Rawlings & Lacy 1999) and -band spectroscopy with 10 m telescopes may find direct evidence for broad lines in at least the brightest cases.
Assuming that this apparent evolution of the quasar fraction with redshift is not due to selection effects, what is its cause? Are we seeing real cosmic evolution in the nature of radio-loud AGN? Higher dust and gas masses in the host galaxies at high- would give greater chances of obscuration of the nucleus along our line-of-sight. Alternatively, the low quasar fraction may be a consequence of the youth–redshift degeneracy (Blundell & Rawlings 1999). Young radio sources will not have had time for the dust in the host galaxies to be cleared away by shocks from the jets (e.g. De Young 1998) and their central regions remain obscured. We suspect both selection effects like the youth–redshift degeneracy and genuine cosmic evolution may play some role in changing the optical/near-IR properties of the highest- radio galaxies.
Acknowledgements
Many thanks to Pablo Rodríguez Gil for making the IAC-80 observations and Chris Simpson and Katherine Blundell for assistance with the near-IR imaging. Thanks to Carla Fanti, Elese Archibald, Jim Dunlop, David Hughes and Steve Eales for communicating results prior to publication. We are grateful to G.L. Granato for providing the model SEDs and Greg Taylor for useful conversation. Special thanks to the staff of the United Kingdom Infrared Telescope, particularly Tim Carroll, Thor Wold, John Davies and Andy Adamson. UKIRT is operated by the Joint Astronomy Centre on behalf of the U.K. Particle Physics and Astronomy Research Council. The IAC-80 is operated by the Instituto de Astrofísica de Canarias. This research has made use of the NASA/IPAC Extra-galactic Database, which is operated by the Jet Propulsion Laboratory, Caltech, under contract with the National Aeronautics and Space Administration. This work uses observations with the NASA/ESA Hubble Space Telescope, obtained from the data archive at the Space Telescope Science Institute, which is operated by AURA, Inc. under NASA contract NAS5-26555. This research has made use of data obtained from the Leicester Database and Archive Service at the Department of Physics and Astronomy, Leicester University, UK. This research was supported in part by the EC TMR Network programme FMRX-CT96-0068.
References
- [1] Andreani P., Franceschini A., Granato G.L., 1999, MNRAS, 306, 161
- [2] Almaini O., Lawrence A, Boyle B.J., 1999, MNRAS, 305, L59
- [3] Aussel H., Gerin M., Boulanger F., Désert F.X., Casoli F., Cutri R.M., Signore M., 1998, A&A, 334, L73
- [4] Baker J.C., 1997, MNRAS, 286, 23
- [5] Barger A.J., Cowie L.L., Smail I., Ivison R.J., Blain A.W., Kneib J.P., 1999, AJ, 117, 2656
- [6] Barvainis R., Antonucci R., Hurt T., Coleman P., Reuter H.-P., 1995, ApJ, 451, L9
- [7] Benford D.J., Cox P., Omont A., Phillips T.G., McMahon R.G., 1999, ApJ, 518, L65
- [8] Blundell K.M., Rawlings S., 1999, Nature, 339, 330
- [9] Blundell K.M., Rawlings S., Willott C.J., 1999, AJ, 117, 677
- [10] Carilli C.L., 1995, A&A, 298, 77
- [11] Carilli C.L., Röttgering H.J.A., Van Ojik R., Miley G.K., van Breugel W.J.M., 1997, ApJS, 109, 1
- [12] Crawford C.S., Fabian A.C., 1996, MNRAS, 282, 1483
- [13] De Young D.S., 1998, ApJ, 507, 161
- [14] Downes D., Solomon P.M., Radford, S.J.E., 1995, ApJ, 453, L65
- [15] Downes D., Solomon P.M., Sanders D.B., Evans A.S., 1996, A&A, 313, 91
- [16] Dunlop J.S., Hughes D.H., Rawlings S., Eales S.A., Ward M.J., 1994, Nature, 370, 347
- [17] Eales S.A., Lilly S., Gear W., Dunne L., Bond J.R., Hammer F., Le Fèvre O., Crampton D., 1999, ApJ, 515, 518
- [18] Fanti C., Fanti R., Dallacasa D., Schilizzi R.T., Spencer R.E., Stanghellini C., 1995, A&A, 302, 317
- [19] Francis P.J., Hewett P.C., Foltz C.B., Chaffee F., Weymann R.J., Morris S.L., 1991, ApJ, 373, 465
- [20] Gelderman R., Whittle M., 1994, ApJS, 91, 491
- [21] Genzel R., Lutz D., Sturm E., Egami E., Kunze D., Moorwood A.F.M., Rigopoulou D., Spoon H.W.W., Sternberg A., Tacconi-Garman L.E., Tacconi L., Thatte N., 1998, ApJ, 498, 579
- [22] Granato G.L., Danese L., 1994, MNRAS, 268, 235
- [23] Granato G.L., Danese L., Franceschini A., 1996, ApJL, 460, 11
- [24] Guilloteau S., Omont A., Cox P., McMahon R.G., Petitjean P., 1999, A&A, 349, 363
- [25] Gunn K.F, Shanks T., 1999, MNRAS, submitted, astro-ph/9909089
- [26] Haas M., Chini R., Meisenheimer K., Stickel M., Lemke D., Klaas U., Kreysa E., 1998, ApJ, L109
- [27] Heckman T.M., Chambers K.C., Postman M., 1992, ApJ, 391, 39
- [28] Hes R., Barthel P.D., Hoekstra H., 1995, A&A, 303, 8
- [29] Hines D.C., Schmidt G.D., Smith P.S., Cutri, R.M., Low F.J., 1995, ApJL, 450, 1
- [30] Hoekstra H., Barthel P.D., Hes R., 1997, A&A, 319, 757
- [31] Hughes D.H., Dunlop J.S., 1999, in Highly Redshifted Radio Lines, eds. C.Carilli et al., ASP Conf Series, 99
- [32] Hughes D.H., Robson E.I., Dunlop J.S., Gear W.K., 1993, MNRAS, 263, 607
- [33] Hughes D.H., Dunlop J.S., Rawlings S., 1997, 289, 766
- [34] Hughes D.H. et al., 1998, Nature, 394, 241
- [35] Ibata R.A., Lewis G.F., Irwin M.J., Lehár J., Totten E.J., 1999, AJ, submitted, astro-ph/9908052
- [36] Ivison R.J., Dunlop J.S., Hughes D.H., Archibald E.N., Stevens J.A., Holland W.S., Robson E.I., Eales S.A., Rawlings S., Dey A., Gear W.K., 1998, ApJ, 494, 211
- [37] Lacy M., Rawlings S., Serjeant S., 1998, MNRAS, 299, 1220
- [38] Lacy M., 1999, in the Hy-Redshift Universe, Bunker A.J., Stern D., eds., in press, astro-ph/9909161
- [39] Lüdke E., Garrington S.T., Spencer R.E., Akujor C.E., Muxlow T.W.B., Sanghera H.S., Fanti C., 1998, MNRAS, 299, 467
- [40] Lutz D., Spoon H.W.W., Rigopoulou D., Moorwood A.F.M., Genzel R., 1998, ApJL, 505, 103
- [41] Murgia M., Fanti C., Fanti R., Gregorini L., Klein U., Mack K.-H., Vigotti M., 1999, A&A, in press, astro-ph/9904141
- [42] Omont A., Petitjean P., Guilloteau S., McMahon R.G., Solomon P.M., Pecontal E., 1996, Nature, 382, 428
- [43] Papadopoulos P.P., Röttgering H.J.A., van der Werf P.P., Guilloteau S., Omont A., van Breugel W.J.M., Tilanus R.P.J., 1999, ApJ, in press, astro-ph/9908286
- [44] Peacock J.A., 1999, Cosmological Physics, Cambridge University Press, 106
- [45] Pier E.A., Krolik J.H., 1992, ApJ, 401, 99
- [46] Rawlings S., Saunders R., 1991, Nature, 349, 138
- [47] Rowan-Robinson M., 1995, MNRAS, 272, 737
- [48] Rowan-Robinson M., 1996, in Bremer M.N., van der Werf P.P., Röttgering H.J.A., Carilli C., (eds.), Cold Gas at high redshift, Kluwer, Dordrecht, 61
- [49] Rowan-Robinson M., Crawford J., 1989, MNRAS, 238, 523
- [50] Rowan-Robinson M., Efstathiou A., Lawrence A., Oliver S.J., Taylor A., Broadhurst T.J., McMahon R.G., Benn C.R., Condon J.J., Lonsdale C.J., Hacking P., Conrow T., Saunders W.S., Clements D.L., Ellis R.S., Robson I., 1993, MNRAS, 261, 513
- [51] Sanders D.B., Phinney E.S., Neugebauer G., Soifer B.T., Matthews K., 1989, ApJ, 347, 29
- [52] Simpson C., Rawlings S., Lacy M., 1999, MNRAS, 306, 828
- [53] Smail I., Ivison R., Blain A.W., Kneib J.-P., 1998, ApJ, 507, L21
- [54] Smith H.E., Smith E.O., Spinrad H., 1976, PASP, 88, 621
- [55] Spencer R.E., Schilizzi R.T., Fanti C., Fanti R., Parma P., van Breugel W.J.M., Venturi T., Muxlow T.W.B., Rendong N., 1991, MNRAS, 250, 225
- [56] Spinrad H., Smith H.E., 1976, ApJ, 206, 355
- [57] Tananbaum H., Wardle J.F.C., Zamorani G., Avni Y., 1983, ApJ, 268, 60
- [58] Taylor G.B., Inoue M., Tabara H., 1992, A&A, 264, 421
- [59] Telesco C.M., Becklin E.E., Wynn-Williams C.G., Harper D.A., 1984, ApJ, 282, 427
- [60] van Breugel W.J.M., Fanti C., Fanti R., Stanghellini C., Schilizzi R.T., Spencer R.E., 1992, A&A, 256, 56
- [61] van der Werf P.P., Clements D.L., Shaver P.A., Hawkins M.R.S., 1999, A&A, 342, 665
- [62] Véron P., 1966, ApJ, 144, 459
- [63] Waldram E.M., Yates J.A., Riley J.M., Warner P.J., 1996, MNRAS, 282, 779
- [64] Wilkes B.J., Hooper E.J., McLeod K.K., Elvis M.S., Impey C.D., Lonsdale C.J., Malkan M.A., McDowell J., 1999, to be published in the proceedings of ”The Universe as Seen by ISO,” ed. M. Kessler, astro-ph/9902084
- [65] Willott C.J., Rawlings S., Blundell K.M., Lacy M., 1998, MNRAS, 300, 625
- [66] Willott C.J., Rawlings S., Blundell K.M., Lacy M., 1999a, MNRAS, submitted
- [67] Willott C.J., Rawlings S., Blundell K.M., Lacy M., 1999b, MNRAS, in press, astro-ph/9905388
- [68] Wyndham J., 1966, ApJ, 144, 861