Imaging of the Merging Galaxy NGC 3597 and its Population of Proto–Globular Clusters
Abstract
We present wide field-of-view near–infrared imaging from the NTT and very deep optical imaging from the HST of the young merging galaxy NGC 3597. The morphology of the galaxy and the properties of the newly formed proto–globular clusters (PGCs) are examined. Our K band data reveals the presence of a second nucleus, which provides further evidence that NGC 3597 is the result of a recent merger. Combining new K band photometry with optical photometry, we are able for the first time to derive a unique age for the newly formed PGCs of a few Myrs. This is consistent with the galaxy starburst age of 10 Myrs. From deep HST imaging, we are able to probe the luminosity function 8 magnitudes fainter than normal, old globular clusters, and confirm that the PGCs have a power–law distribution with a slope of –2.
keywords:
galaxies: interactions - galaxies: elliptical - globular clusters: general - galaxies: photometry - galaxies: evolution1 Introduction
In the 1970’s, the rich globular cluster (GC) populations seen around elliptical galaxies were used to argue against the idea that ellipticals formed from the simple merger of two spirals (van den Bergh 1975). The suggested solution to this problem was the creation of new GCs from the gas associated with the progenitor galaxies (Schweizer 1987; Ashman & Zepf 1992). The Hubble Space Telescope (HST), with its high spatial resolution, has indeed detected proto–globular cluster candidates in several merging galaxies. Over a dozen such systems have now been observed with HST (e.g. Holtzman et al. 1992; Whitmore et al. 1993; Whitmore & Schweizer 1995; Schweizer et al. 1996; Holtzman et al. 1996; Miller et al. 1997; Zepf et al. 1999; Carlson et al. 1999). These studies suggest that all mergers involving gaseous systems create proto–globular clusters (PGCs). However there are several outstanding issues concerning these PGCs, such as the total number created, their luminosity (mass) function, their destruction rate and the overall specific frequency of the final system (e.g. Kissler–Patig, Forbes & Minniti 1998; Brodie et al. 1998; Zepf et al. 1999).
Perhaps the first detailed study of PGCs in a merging system was that of Lutz (1991). Lutz presented optical imaging and spectroscopy of NGC 3597 (AM 1112-232). Classified as an S0pec, it reveals an extended structure with plumes but the main body of the galaxy resembles an r1/4–like surface brightness profile. Using the ESO 2.2m telescope, under 1.3 seeing conditions, Lutz detected and measured photometry for 31 unresolved objects around the galaxy. About half of these were suggested to be young, blue PGCs. Following this ground–breaking work by Lutz, Holtzman et al. (1996) re–observed NGC 3597 using the WFPC2 camera on HST. They detected over 70 PGC candidates. The bulk of these had similar colours suggesting a single age and metallicity population. However from their V–R colours alone they were unable to identify a unique age for the PGCs.
Here we present K band (2.2m) imaging of NGC 3597 taken under photometric conditions with 0.6 seeing. The near–infrared has the advantage of being much less affected by dust extinction (AK 0.1 AV). We also incorporate deep B and R band data from the HST archive. The near–infrared photometry, when combined with optical magnitudes, provides a powerful constraint on the age of PGCs. After completing our study, Carlson et al. (1999) published a study of NGC 3597 using the same deep HST imaging. However as described below, the deep B and R data alone do not provide a significant improvement over the Holtzman et al. V and R band data in determining the age of the PGCs. Our main contribution is the addition of new K band photometry which allows the age of the PGCs to be uniquely constrained for the first time. The K band images also reveal a second nucleus, not obvious in the shorter wavelength HST images, but apparent from radio imaging.
2 Near–infrared Data
2.1 Observations and Data Reduction
K short (Ks; = 2.162/0.275) images of NGC 3597 were taken with the infrared camera SOFI on the ESO NTT over 2 nights in 1999 March. The data were obtained under photometric conditions and excellent seeing (0.6). SOFI has a field-of-view of 5 5 and a pixel size of 0.292. A total of 220 30sec exposures were taken to give a total effective exposure time of 110min. Between each 30sec exposure, the telescope position was offset by 1. Standard stars from the list of Persson et al. (1999) were also taken before and after each block of galaxy observations.
Flat–fields were made by median combining the standard star images. These were determined to be superior to the dome and twilight flats. After subracting dark currents and flat–fielding, the individual images were carefully shifted and median combined to form a single final Ks image of NGC 3597. The sky background of the final image is flat to 2%.
From our standard star images taken directly before and after the galaxy, we have determined a Ks zero point of 22.23 0.03, where the uncertainty represents the errror on the mean from several different images. We will not attempt to transform our Ks magnitudes to standard K band values, but simply note that they are similar and have been defined so that Ks = K for A0 standard stars (Persson et al. 1999). Hereafter we simply use K to refer to our K short band data.
2.2 Galaxy Modelling
We have modelled the galaxy using the STSDAS task ellipse. The central position and the position angle of the model were fixed, but the ellipticity was allowed to vary. Stars and bright PGCs were masked out. We also used sigma clipping to exclude the most deviant data values from the model fit. Subtraction of the resulting galaxy model showed that it was a reasonable representation except in the very inner regions. The K surface brightness profile for the model is shown in Fig. 1. The outer regions are close to an r1/4 surface brightness profile, as found in most elliptical galaxies. The total magnitude of the galaxy, from a curve-of-growth analysis, is K = 11.75 0.05. We later use the model–subtracted image for the detection of globular clusters.
3 Results and Discussion
3.1 The Host Galaxy
The basic properties of NGC 3597 are summarised in Table 1. Coordinates of the galaxy centre are taken from an HST R band (F702W) image, but are probably only accurate to within 1 due to dust. However this position is consistent with the position of the brightest radio source (van Driel et al. 1991). The distance of 49 Mpc is based on a Virgocentric inflow corrected velocity of 3513 km s-1 and Ho = 75 km s-1 Mpc-1. At this distance 1 corresponds to 240 pc. The galaxy is fairly luminous at all wavelengths, and is undergoing a vigourous starburst (e.g. Lutz 1991; Kim et al. 1995; Rephaeli et al. 1995).
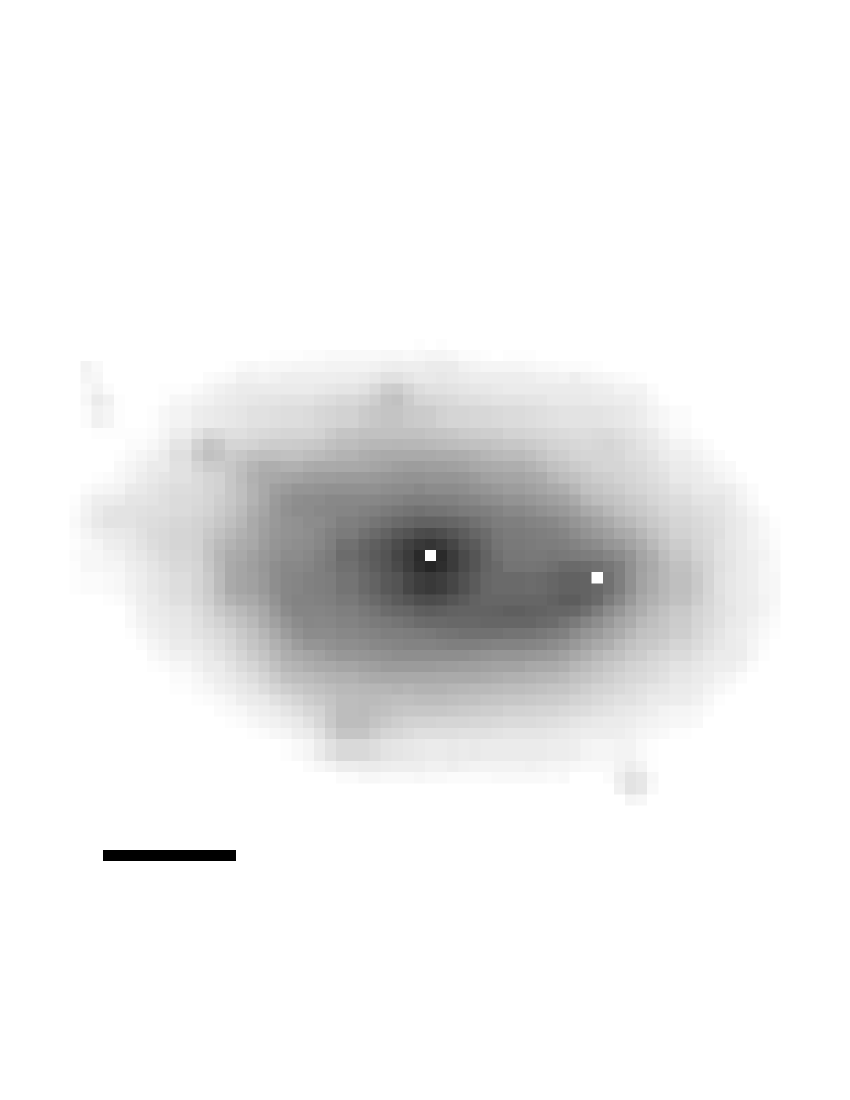
In Fig. 2 we show the inner regions of our K image of NGC 3597. We also identify the location of the two radio sources mapped at 6cm by van Driel et al. (1991), which correspond spatially with the bright central source and a second source in our K image. The galaxy inner regions reveal that the bright central source is connected via a ‘bridge’ to the second source about 3.8 (0.9 kpc) to the West. This could be simply a super starcluster, but it is not particuarly bright at optical wavelengths. At radio wavelengths, it appears as a connected second source with a similar flux (S6cm = 18.0 mJy compared to the central source of 29.1 mJy). Thus it appears quite likely that the central source and the second source, seen in the K band and at 6cm, are the nuclei of the merging galaxies. The dynamical timescale for these nuclei to merge is less than 106 yrs, so we appear to be witnessing NGC 3597 in the very final stages of nuclear coascelence.
With a projected nuclear separation of 0.9 kpc, NGC 3597 is at a similar evolutionary stage to NGC 3256 (Norris & Forbes 1995) and NGC 6240 (van der Werf et al. 1993) with separations of 0.73 and 0.90 kpc respectively. The ratio of far–infrared to H2 mass is a measure of star formation efficiency, and has been shown to increase as the nuclear separation of two merging galaxies reduces to zero (Gao & Solomon 1998; Georgakakis, Forbes & Norris 1999). NGC 3597 has a L of 25.6 (Wiklind et al. 1995), comparable to 20 for NGC 3256 and 30 for NGC 6240. This further supports the case that NGC 3597 is near the nuclear coascelence stage of a merger sequence.
Beyond our faintest isophote, deep optical images reveal plumes ( mag arcsec-2) to the NW and SW (Lutz 1991). As NGC 3597 is relatively isolated, the outer morphological disturbance is almost certaintly due to a merger of some sort. Indeed the morphology of the plumes resembles the merger simulation shown in Barnes (1998) at 300 Myr after pericentre, and just before nuclear merger.
The galaxy is currently undergoing a starburst. Optical spectra (e.g. Lutz 1991; Kim et al. 1995) reveal emission lines indicative of HII regions. However, as well as the current star formation activity, there is also evidence that the burst is not instantaneous but has proceeded for some time. Optical spectra clearly show weak Hydrogen absorption lines (along with the Hydrogen emission) indicative of an earlier phase of star formation. The radio spectral index is = –0.84 indicating that the emission is not dominated by HII regions but rather is due to non–thermal synchrotron emission from SNRs (Smith & Kassim 1993). Both the current and post starburst contribute to the far–infrared luminosity of LFIR 7 1010 L⊙ which is consistent with the well known far–infrared vs radio correlation. Kim et al. (1995) estimated an H absorption EW of 2.5 Å from their optical spectrum. Such an EW occurs in the first 10 Myrs of a starburst (e.g. Bruzual & Charlot 1993). This indicates that the starburst is very recent, starting less than 10 Myr ago and continuing to the present day. We compare this age estimate to that of the PGCs in the next section.
Wikland et al. (1995) did not detect HI gas in NGC 3597 but only placed a relatively high upper limit of M M⊙. Based on the FIR luminosity and a Galactic gas-to-dust ratio, Lutz (1991) estimated an HI gas mass of 3 108 M⊙, i.e. almost a factor of one hundred below the current Wikland et al. limit. It would be interesting to place tighter limits on the HI mass and investigate the possibility that atomic hydrogen gas is being compressed during the merger into molecular gas.
Mihos & Hernquist (1994) have modelled the star formation history of equal mass spiral galaxies. They found that for systems without strong bulges (e.g. Sc spirals), most of the merger–induced star formation occurs at the pericentre encounter over a timescale of a few Myrs. However the presence of a bulge inhibits gas flow and delays the main starburst until nuclear coalescence. This starburst also lasts only a few Myrs. The age of the starburst in NGC 3597 (i.e. 10 Myrs) and the galaxy morphology (i.e. two nuclei and a common r1/4 like envelope) suggests that the latter situation is the correct one. Thus it appears that NGC 3597 is likely the product of two near equal mass spirals, at least one of which contained a strong bulge. Furthermore we are currently witnessing it at the nuclear merger stage, which is also the period of its most intense star formation activity.
3.2 The Proto–Globular Clusters
Our K image of NGC 3597 reveals a number of bright unresolved sources. The vast bulk of these are PGCs. They were first noticed by Lutz (1991) and later re–observed with HST (Holtzman et al. 1996; Carlson et al. 1999). In the discussion that follows we will assume a Galactic extinction towards NGC 3597 of AV = 0.12 (AB = 0.16, AR = 0.08, and AK = 0.01) as used by Holtzman et al. Although the galaxy shows a dust lane to the North of the nucleus, the internal extinction towards most of the PGCs is probably not large given the relatively uniform V–R colors noted by Holtzman et al. (see their figure 6).
Lutz (1991) tabulated 31 sources. From Holtzman et al. (1996), it appears that 9 of them are bona fide PGCs, i.e. numbers 10, 11, 13, 14, 17, 19, 21, 23 and 24 from his table (the other 22 sources are either foreground stars or background galaxies). The mean B–V colour for these 9 sources, corrected for Galactic extinction, is 0.40 with a 1 error on the mean of 0.03. This colour and range for the PGCs is shown in Fig. 3, along with the evolutionary track for a solar metallicity, Salpeter IMF single stellar population from Bruzual & Charlot (1993). The IMF and metallicity of the PGCs are of course unknown, so any derived ages will be a guideline only. The average PGC colour intersects the track at about 6–10, 100 and 1000 Myrs. Thus it is impossible to derive a unique age from the B–V colour alone.
Holtzman et al. (1996) used WFPC2 to obtain F555W (V) and F702W (R) photometry of the PGCs. They detected 72 PGCs in the PC chip down to V 25.5. The first source listed by Holtzman et al. (Holtz ID = 1) is probably a star with V = 20.04 and V–K = 1.4 which suggests it is a G0 dwarf star. For the 60 globular clusters with V 25, the mean colour and error on the mean is V–R = 0.34 0.03 (again corrected for Galactic extinction). This is shown in Fig. 4 along with the Bruzual & Charlot (1993) evolutionary track. As with B–V, the V–R colours do not give a single age but several possibilities, i.e. 6, 12, 80, 200 Myrs. The V–R colours do however rule out the oldest B–V age of 1 Gyr.
Using the HST PGC positions, we measured K magnitudes using daophot. This was carried out on the galaxy subtracted image, using small aperture magnitudes for which we then applied an aperture correction (based on objects away from the galaxy centre). We detected 31 PGCs in our image down to K 22.8, although with large errors at faint magnitudes. Our K magnitudes and measurement errors are listed in Table 2, along with Holtzman et al. ID number and offset from the galaxy centre. All of these PGCs lie within 20 of the galaxy centre (i.e. detected in the PC chip by Holtzman et al. ).
In Table 3 we list the V magnitude, V–R colours and errors from Holtzman et al. (1996). The errors are photometric measurement errors, and do not include zeropoint errors (on the order of 0.05–0.1 mag.). These errors have been combined in quadrature to obtain the final V–K error. The mean colour and error on the mean is V–K = 0.95 0.14. This range of colours is shown in Fig. 5, along with the Bruzual & Charlot (1993) evolutionary track. The extra ‘leverage’ from the K band means that the V–K colours of the PGCs only intersect the track at one place, i.e. around 5 Myrs. This is consistent with the youngest age suggested by the B–V and V–R colours, and rules out the older ages at the 3 level. Any correction for internal extinction, or if the PGCs had supersolar metallicities, would make the age even less than 5 Myrs. Such an age should be regarded as somewhat qualitative since it is depedent on unknown factors (e.g. the IMF) and on the particular stellar population model used (i.e. Bruzual & Charlot 1993).
We have obtained deep F450W (B) and F702W (R) HST images of NGC 3597 from the CADC HST archive. The 8 images total 5200sec in B and 5000sec in R, and cover essentially the same area as the shallower Holtzman et al. (1996) data. They were average combined using the STSDAS task gcombine, which effectively removes cosmic rays. The high throughput of the F702W filter and the spectral energy distribution of globular clusters means that the R image will be somewhat deeper than the B image. Nevertheless both images should reach magnitudes typical of the brighter GCs associated with the original, old population from the progenitor galaxies. The previous HST imaging published by Holtzman et al. (1996) had an F702W exposure time of 1100sec and was thus not deep enough to reach the old population and only probe the bright end of the new population. This data was also recently used by Carlson et al. (1999), and reaches about 1.6 mags deeper in R than the Holtzman et al. study.
In order to locate sources, we used daofind with a conservative 4 per pixel detection criterion. For the PC chip, we fit the galaxy isophotes using ellipse and subtracted off a model before running daofind. Because of the confused nature in the central regions in the B image, due to dust and young star formation, we have excluded the central 9 radius from the automatic detection. Photometry on all four chips was measured using phot with a 2 pixel radius aperture. Aperture corrections to 0.5 and zero points were taken from Holtzman et al. (1995, 1996). The objects on the PC chip are marginally resolved. Holtzman et al. (1996) showed that the bulk of objects required a typical correction of 0.22m, in addition to the above aperture correction, to include all of the light. Variations with the size of the object and its position on the chip, could introduce another source of error on the order of 0.1m. However the correction to total light affects the two filters almost equally, so there is little error introduced in the final B–R colour.
The resulting object lists were then checked visually on the image display to exclude the very few remaining obvious bright stars and background galaxies. At this stage, our candidate GC list contained 292 sources from all four chips (excluding the central 9 of the PC chip). A colour–magnitude diagram is shown in Fig. 6. We have adopted selection cuts of –0.5 B–R 2.0 and B 27. The colour cuts correspond to the full range expected of GCs older than a Myr (Bruzual & Charlot 1993). The faint magnitude limit was chosen to avoid any colour bias in our sample. Within these selection criteria we have 239 objects, the vast bulk of which will be bona fide GCs (as our contamination rate is 5%).
A histogram of B–R colour is shown in Fig. 7. The GCs have an average colour of B–R = 0.66 0.03 (error on the mean). The spread in colour is consistent with photometric errors suggesting that the PGCs are close to a single age and metallicity population. This mean value is shown on the evolutionary tracks of Bruzual & Charlot (1993) in Fig. 8. From B–R colour alone the GCs may have several possible ages, but from our K band imaging above it is clear that the correct age is 5 Myrs. Thus the majority of detected objects in our deep HST images are PGCs.
Have we detected any GCs from the progenitor galaxies ? Milky Way GCs have a mean B band luminosity function that is roughly Gaussian with a peak at MB –6.6, with the brightest GC ( Cen) having MB = –10.7. These correspond to B = 26.85 and 22.75 respectively, at the distance of NGC 3597. Uncertainty in the distance makes these magnitudes uncertain by about 0.2m. Milky Way GCs have an average extinction–corrected colour of (B–R)o 1.2. Examination of the colour–magnitude diagram reveals 32 GCs in the expected colour and magnitude range (shaded region in Fig. 6), although perhaps half of these will simply be PGCs with apparently red B–R colours due to photometric errors. If we assume that say 20 are true old GCs then we can crudely estimate the total population of progenitor GCs. The HST images cover about half of the area out to a galactocentric radius of 125 arcsec, suggesting 40 GCs within this radius. Our HST data only reach to B 26.5, which is slightly less than the expected peak at B = 26.85. This suggests that we are sampling about 40% of the GC population in magnitude terms. Thus another correction of 2.5 is required, giving a total old GC population of about 100. This crude calculation could easily be in error by a factor of two, but is not vastly different to the halo GC population of the Milky Way (i.e. 120). Unfortunately such a calculation does not constrain the progenitor types. Deeper B band observations, over a somewhat wider field of view, would provide better constraints on the original GC systems.
Globular cluster luminosity functions in old ellipticals show a Gaussian log–normal distribution, with a peak, or turnover, magnitude and fewer GCs at low luminosity (mass). However, for the PGC systems studied to date the luminosity function does not peak but continues as a power–law down to low luminosities. Published slopes include –1.78 (NGC 4038/9; Whitmore & Schweizer 1995), –2.1 (NGC 3921; Schweizer et al. 1996), –1.84 (NGC 7252; Miller et al. 1997) and –1.8 (Zepf et al. 1999). For the closer systems, the PGCs in the PC chip are marginally resolved giving sizes consistent with GCs rather than open clusters (which also have a power–law distribution). Recently Carlson et al. (1999) have examined the luminosity function for NGC 3597. They found a slope of –2.0 to be a reasonable representation. Here using the same HST data, we also probe the R band luminosity function.
Before probing the GC luminosity we need to estimate the incompleteness of our R band detections. This was achieved by simulating GCs using the addstar task, and measuring the detected fraction as a function of R band magnitude. An actual WFC chip was used to reproduce the correct noise characteristics. Care was taken to avoid any blending of artifical GCs. The resulting completeness function for the WFC chips is shown in Fig. 9. Our 50% incompleteness level is at R 26.8. In Fig. 10 we show the R band luminosity function in log–log space, for the three WFC chips and corrected for incompleteness. It is very similar to that shown in figure 10 of Carlson et al. (1999). A Milky Way like GC system with a peak magnitude of MR = –8, would have an apparent magnitude of R 25.5 at the distance of NGC 3597 and be an additional 5.5 magnitudes brighter if they were 5 Myr old instead of 12 Gyr old (assuming a solar metallicity population). This gives an expected peak of R 20, with the faint (lower mass) limit of R 23. By constrast, the observed PGC luminosity function continues to rise to faint magnitudes (R 28) with a power–law like slope of around –2. At the faint end of our luminosity function, assuming a Salpeter IMF, derived masses correspond to 200 M⊙. At 8 magnitudes fainter than the expected peak, these data probe deeper than any previously published study of PGCs. We note that similar mass calculations by Carlson et al. (1999) assumed an age of 500 Myrs, which means that their masses are overestimates. Thus, like other merging galaxies, the low mass PGCs in NGC 3597 must be destroyed (e.g. by tidal disruption or evaporation) over time if their luminosity functions are to resemble those of old ellipticals (see Zepf et al. 1999).
Elmegreen & Efremov (1997) have proposed that a universal mechanism exists for GC formation. In their model, GCs form in high pressure regions with an assumed power–law mass distribution of slope –2. They suggest that a GC system is formed initially without a characteristic mass, but as low mass GCs are destroyed over time a characteristic mass develops. Over 10 Gyr, the luminosity function grows to resemble that of the Milky Way GC system with a characteristic mass corresponding to MR –8.0
In our K image there are many unresolved sources beyond the central (i.e. the region covered by Holtzman et al. 1996). We used daofind to find all sources 3 above the background noise. After rejecting 3 obvious bright stars, 1 galaxy and objects fainter than with K = 23, we were left with a list of 142 candidate PGCs. These objects are listed in Table 4 along with their K magnitudes and photometric errors. Some of the brighter objects will be foreground stars, and some will be compact background galaxies. Indeed, after examining the area in common with the deep HST images, we have excluded a further three stars and two galaxies (as noted in Table 4). As the HST images do not cover the whole area of our K image, we are unable to confidently remove all stars and galaxies. In the absence of overlapping HST data (or optical magnitudes), it is difficult to make conclusive statements about these outer objects, but many will be PGCs.
4 Concluding Remarks
The combination of near–IR and optical imaging from the NTT and HST telescopes has provided new insights into the merging system NGC 3597. For the host galaxy we confirm an r1/4 like surface brightness profile in the outer regions and discover the presence of two closely separated (r 0.9 kpc) nuclei. The two nuclei seen in our K band image correspond to those seen at radio wavelengths and are probably the nuclei of the progenitor galaxies at the final stages of coalescence. Various properties of the galaxy starburst suggest that the burst occured less than 10 Myrs ago and may have involved at least one early type spiral.
A number of proto–globular clusters (PGCs) are identified in NGC 3597 with
average colours of V–K = 0.95. The extra leverage provided by our K band
photometry allows us to derive a unique age for the PGCs of a few Myr.
From deep B and R HST imaging we detect 300 globular clusters,
the vast bulk of which are PGCs. We derive an R band luminosity function
which reaches 8 magnitudes fainter than the expected characteristic mass of
a standard old globular cluster luminosity function, and confirm
the slope of the
luminosity function to be about –2.
A small number of globular clusters have properties consistent with
Galactic ones, and we speculate that they were
associated with the progenitor galaxies.
Acknowledgments
We thank Richard Brown, Paul Goudfrooij
for help and useful discussions.
Based on observations with the NASA/ESA Hubble Space Telescope under
NASA contract NAS5-26555 and the European Southern Observatory.
GKTH acknowledges financial support by FONDECYT under grant 1990442.
References
Ashman, K.M., & Zepf S.E. 1992, ApJ 384, 50
Barnes, J., 1998, astro-ph/9811091
Brodie, J.P., Schroder L.L., Huchra J.P., Phillips A.C., Kissler-Patig M.,
Forbes D.A., 1998, AJ, 116, 691
Bruzual, G., & Charlot S. 1993, ApJ 405, 538
Carlson, M.N., et al. 1998, AJ, 115, 1778
Elmegreen B.G., Efremov Y.N. 1997, ApJ 480, 235
Forbes, D. A. 1998, Galaxy Interactions at Low and High
Redshift, ed. D. Sanders, in press
Gao, Y., & Solomon, P. M. 1998, astro-ph/9812320
Georgakakis, A., Forbes, D. A., & Norris, R. P. 1999, in preparation
Holtzman, J.A., et al., 1992, AJ 103, 691
Holtzman, J.A., et al., 1995, PASP, 107, 156
Holtzman, J.A., et al., 1996, AJ 112, 416
Kim, D.C., Sanders, D.B., Veilleux, S., Mazzarella, J.M., Soifer, B.T.,
1995, ApJS, 98, 12
Kissler-Patig, M., Forbes, D.A., Minniti, D., 1998, MNRAS, 298, 1123
Lutz, D., 1991, A&A 245, 31
Mihos, C., Hernquist, L., 1994, ApJ, 390, L53
Miller, B.W., Whitmore, B.C., Schweizer, F., Fall, S.M., 1997, AJ, 114, 2381
Norris, R.P., Forbes, D.A., 1995, ApJ, 446, 594
Persson, S. E. Murphy, D. C., Krzeminski, W., Roth, M., & Rieke, M. J.
1999, AJ, 116, 2475
Rephaeli, Y., Gruber, D., & Persic, M. 1995, A&A, 300, 91
Schweizer, F., 1987, in Nearly Normal Galaxies, ed S. Faber (Springer, New
York), 18
Schweizer, F., Miller B.W., Whitmore B.C., Fall S.M., 1996 AJ 112, 1839
Smith, E. P., & Kassim, N. E. 1993, AJ, 105, 46
van Driel, W., van den Broek, AC., & de Jong, T. 1991, A&AS, 90, 55
Van den Bergh S., 1975, ARAA, 13, 217
Van der Werf, P., Genzel, R., Krabbe, A., Blietz, M., Lutz, D., Drapatz,
S., Ward, M.J., Forbes, D.A., 1993, ApJ, 405, 522
Whitmore, B.C., Schweizer F., Leitherer C., Borne K., Robert C., 1993,
AJ, 106, 1354
Whitmore, B.C., Schweizer F., 1995, AJ 109, 960
Whitmore, B.C., Miller B.W., Schweizer F., Fall M., 1997, 114, 797
Wikland, T., Combes, F., & Henkel, C. 1995, A & A, 297, 643
Zepf, S.E., et al. 1999, astro-ph/9904247


![[Uncaptioned image]](/html/astro-ph/9910421/assets/x11.png)
![[Uncaptioned image]](/html/astro-ph/9910421/assets/x12.png)
![[Uncaptioned image]](/html/astro-ph/9910421/assets/x13.png)
![[Uncaptioned image]](/html/astro-ph/9910421/assets/x14.png)