Source Counts from the 15 ISOCAM Deep Surveys ††thanks: Based on observations with ISO, an ESA project with instruments funded by ESA Member States (especially the PI countries: France, Germany, the Netherlands and the United Kingdom) with the participation of ISAS and NASA
Abstract
We present the results of the five mid-IR 15 m (12-18 m LW3 band) ISOCAM Guaranteed Time Extragalactic Surveys performed in the regions of the Lockman Hole and Marano Field. The roughly 1000 sources detected, 600 of which have a flux above the 80 % completeness limit, guarantee a very high statistical significance for the integral and differential source counts from 0.1 mJy up to 5 mJy. By adding the ISOCAM surveys of the HDF-North and South (plus flanking fields) and the lensing cluster A2390 at low fluxes and IRAS at high fluxes, we cover four decades in flux from 50 Jy to 0.3 Jy. The slope of the differential counts is very steep () in the flux range 0.4-4 mJy, hence much above the Euclidean expectation of . When compared with no-evolution models based on IRAS, our counts show a factor 10 excess at 400 Jy, and a fast convergence, with at lower fluxes.
Key Words.:
Galaxies: evolution – Infrared: galaxies1 Introduction
Deep galaxy counts as a function of magnitude, or flux density, should, in principle, give a constraint on the geometry of the universe (, ). In fact, their departure from the Euclidean expectation (no expansion, no curvature) is dominated by the e-correction (intrinsic evolution of the galaxies) and by the k-correction (redshift dependence). The understanding of galaxy evolution therefore is a key problem for cosmology, and number counts appear to be a strong constraint on the models, which does not suffer from the exotic behavior of individual galaxies. Most of the energy released by local galaxies is radiated in the optical-UV range (Soifer & Neugebauer 1991). If this were to remain true over the whole history of the universe, then one could follow the comoving star formation rate of the universe as a function of redshift by measuring the optical-UV light radiated by galaxies (Lilly et al 1996, Madau et al 1996). This scenario changed considerably after the detection of a substantial diffuse cosmic IR background (CIRB) in the 0.1 – 1 mm range from the COBE-FIRAS data (Puget et al 1996, Guiderdoni et al 1997, Hauser et al 1998, Fixsen et al 1998, Lagache et al 1999) and at 140 – 240 m from the COBE-DIRBE data (Hauser et al 1998, Lagache et al 1999). Surprisingly the mid-IR/sub-mm extragalactic background light is at least as large as that of the UV/optical/near-IR background (Dwek et al 1998, Lagache et al 1999), which implies a stronger contribution of obscured star formation at redshifts larger than those sampled by IRAS (). To understand the exact origin of this diffuse emission and its implications for galaxy evolution, we need to identify the individual galaxies responsible for it and the best way to do that consists of observing directly in the IR/sub-mm range.
In the mid-IR, IRAS has explored the local universe (). With a thousand times better sensitivity and sixty times better spatial resolution, ISOCAM (Cesarsky et al 1996), the camera on-board ISO (Kessler et al 1996), provides for the first time the opportunity to perform cosmologically meaningful surveys. Deep surveys have been carried out on small fields containing sources well known at other wavelengths: the HDF North (Serjeant et al 1997, Aussel et al 1999a,b, Désert et al 1999) and the CFRS 1452+52 field (Flores et al 1999). This has yielded a small but meaningful sample of sources (83 galaxies) with a positional accuracy better than 6”, sufficient for most multiwavelength studies. Most of these sources can easily be identified with bright optical counterparts () with a median redshift of imposed by the k-correction (Aussel et al 1999a,b, Flores et al 1999). Flores et al (1999) estimate, from their sample of 41 sources, that accounting for the IR light from star forming galaxies may lead to a global star formation rate which is 2 to 3 times larger than estimated from UV light only.
To obtain reliable source count diagrams, better statistics and a wider range of flux densities are required. For this reason, we have performed several cosmological surveys with ISOCAM, ranging from large area-shallow surveys to small area-ultra deep surveys. These surveys were obtained in the two main broad-band filters LW2 (5-8.5 m) and LW3 (12-18 m), centered at 6.75 m and 15 m respectively. This paper only presents the source counts at 15 m, because the sample of galaxies detected in the 6.75 m band is strongly contaminated by Galactic stars, whose secure identification requires ground-based follow-up observations. Including the surveys over the two Hubble deep fields, almost 1000 sources with flux densities ranging from 0.1 mJy to 10 mJy were detected, allowing us to establish detailed source count diagrams. Source lists for each individual survey, as well as maps and detailed description of data reduction, will be found in separate papers (see Table 1). Forthcoming papers will discuss the nature of these galaxies based on the ISOHDF-North survey (Aussel et al, in prep. & 1999b), the contribution of these galaxies to the cosmic IR background, the relation of these observations with ISOPHOT and SCUBA deep surveys (Elbaz et al, in prep.), as well as a tentative modelling of the number counts (Franceschini et al, in prep.).
2 Description of the Surveys
The five ISOCAM Guaranteed Time Extragalactic Surveys (Cesarsky & Elbaz 1996, Table 1) are complementary. They were carried out in both the northern (Lockman Hole) and southern (Marano Field) hemispheres, in order to be less biased by large-scale structures. These two fields were selected for their low zodiacal and cirrus emission and because they had been studied at other wavelengths, in particular in the X-ray band, which is an indicator of the AGN activity of the galaxies. Only one of the ‘Marano’ maps was scanned at the exact position of the original Marano Field (Marano, Zamorani, Zitelli 1988), while the ‘Marano FIRBACK’ (MFB) Deep and Ultra-Deep surveys were positioned at the site of lowest galactic cirrus emission, because they were combined with the FIRBACK ISOPHOT survey at 175 m (Puget et al 1999, Dole et al 1999). Indeed the importance of the Galactic cirrus emission in hampering source detection is much larger at 175 m than at 15 m, but the quality of the two 15 m ultra deep surveys in the Marano Field area is equivalent. In addition, very deep surveys were taken with ISOCAM over the areas of the HDF North (Serjeant et al 1997) and HDF South. In this paper, we include the HDF North results from Aussel et al (1999a), and show for the first time ISOCAM counts on the HDF South field.
| Survey | Nobs | Area | S80% | # gal | Slope | |
|---|---|---|---|---|---|---|
| Name | (am2) | (mJy) | (min) | |||
| (1) | (2) | (3) | (4) | (5) | (6) | (7) |
| Lockman Shallow(a) | 3 | 1944 | 1 | 3 | 80 | |
| Lockman Deep(a) | 6 | 510 | 0.6 | 11 | 70 | |
| MFB Deep(a) | 18 | 710 | 0.4 | 15.4 | 144 | |
| Marano UD(a) | 75 | 70 | 0.2 | 114 | 82 | |
| MFB UD(a) | 75 | 90 | 0.2 | 114 | 100 | |
| HDF North(b) | 64 | 27 | 0.1 | 135 | 44 | |
| HDF South(a) | 64 | 28 | 0.1 | 168 | 63 | |
| A2390(c) | 100 | 5.3 | 0.05 | 432 | 31 |
Comments: Col.(1) Survey name with reference: (a) in preparation, (b) Aussel et al (1999), (c) Altieri et al (1999); Col.(2) maximum number of pointings on the same sky position (redundancy); Col.(3) the total area covered in square arcminutes; Col.(4) the flux at which the survey is at least 80% complete; Col.(5) the corresponding integration time per sky position (in minutes); Col.(6) the number of galaxies whose flux is over the 80% completeness threshold; Col.(7) the slope of the fit to the integral . A2390 completeness limit includes the corrections for lensing magnification.
3 Data Reduction and Simulations
The transient behavior of the cosmic ray induced glitches, which makes some of them mimic real sources, is the main limitation of ISOCAM surveys. We have developed two pipelines for the analysis of ISOCAM surveys in order to obtain two independent source lists per survey and improve the quality of the analysis. PRETI (Pattern REcognition Technique for ISOCAM data), developed by Starck et al (1999), is able to find and remove glitches using multi-resolution wavelet transforms.
It includes also Monte Carlo simulations to quantify the false detection rate, to calibrate the photometry and to estimate the completeness. The ‘Triple Beam-Switch’ (TBS) technique, developed by Désert et al (1999), treats micro-scanning or mosaic images as if they resulted from beam-switching observations. All the surveys have been independently analyzed using both techniques and the source lists were cross-checked to attribute quality coefficients to the sources. PRETI and TBS agree at the 20 level in photometry (corresponding to the photometric accuracy of both techniques), and with an astrometric accuracy smaller than the pixel size (due to the redundancy). PRETI allowed us to attain fainter levels in deep surveys, whereas in the shallow surveys, where the redundancy is not very high, a very strict criterion of multiple detections had to be applied. Finally, we have made Monte Carlo simulations by taking into account the completeness and the photometric accuracy to correct for the Eddington bias and to compute error bars in the number count plots.
4 The ISOCAM 15 source counts
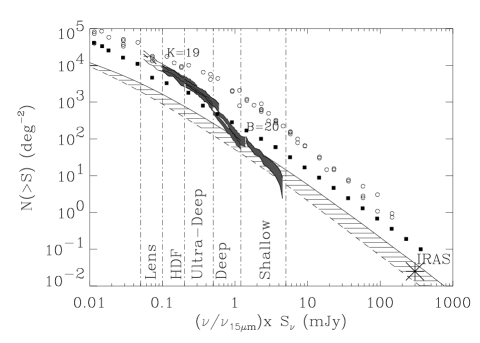
Figures 1 and 2 show respectively the integral and the differential number counts obtained in the five independent guaranteed time surveys conducted in the ISOCAM 15 m band,as well as the HDF surveys. The contribution of stars to the 15 m counts was corrected. It is negligible at fluxes below the mJy level as confirmed by the spectro-photometric identifications in the ISOHDF-North (1 star out of 44 sources), South (3 stars over 71 sources), and CFRS 1415+52 (1 star over 41 sources ranging from mJy to mJy). In the Lockman Shallow Survey ( mJy), about 12 of the sources were classified as stars from their optical-mid IR colors (using the Rayleigh-Jeans law). We have also represented the counts from the ISOHDF-North (from Aussel et al 1999a), ISOHDF-South, and, at the lowest fluxes, the counts obtained from the A2390 cluster lens (down to 50 Jy, including the correction for lensing magnification; Altieri et al 1999, see also Metcalfe et al 1999). We have only included the flux bins where the surveys are at least 80 % complete, according to the simulations.
The first striking result of these complementary source counts is the consistency of the eight 15 m surveys over the full flux range. Some scatter is nevertheless apparent; given the small size of the fields surveyed, we attribute it to clustering effects.

The two main features of the observed counts are a significantly super-euclidean slope () from 3 to 0.4 mJy and a fast convergence at flux densities fainter than 0.4 mJy. In particular, the combination of five independent surveys in the flux range 90-400 Jy shows a turnover of the normalized differential counts around 400 Jy and a decrease by a factor at 100 Jy. We believe that this decrease, or the flattening of the integral counts (see the change of slope in col(7) of Table 1) below 400 Jy, is real. It cannot be due to incompleteness, since this has been estimated from the Monte-Carlo simulations (see Section 3). The differential counts can be fitted by two power laws by splitting the flux axis in two regions around 0.4 mJy. In units of mJy-1 deg-2, we obtain, by taking into account the error bars ( is in mJy):
| (4) |
In the integral plot, the curves are plotted with 68 confidence contours based on our simulation analysis. The total number density of sources detected by ISOCAM at 15 m down to 100 Jy (no lensing) is () arcmin-2. It extends up to () arcmin-2, down to 50 Jy, when including the lensed field of A2390 (Altieri et al 1999).
5 Discussion & Conclusions
We have presented the 15 m differential and integral counts drawn by several complementary ISOCAM deep surveys, with a significant statistical sampling (993 galaxies, 614 of which have a flux above the 80 % completeness limit) over two decades in flux from 50 Jy up to 5 mJy.
The differential counts (Fig. 2), which are normalized to (the expected differential counts in a non expanding Euclidean universe with sources that shine with constant luminosity), present a turnover around =0.4 mJy, above which the slope is very steep (). No evolution predictions were derived assuming a pure k-correction in a flat universe (), including the effect of Unidentified Infrared Bands emission in the galaxy spectra. In the Fig.1&2, the lower curve is based on the Fang et al (1998) IRAS 12 m local luminosity function (LLF), using the spectral template of a quiescent spiral galaxy (M51). The upper curve is based on the Rush, Malkan & Spinoglio (1993) IRAS-12 m LLF, translated to 15 m using as template the spectrum of M82, which is also typical of most starburst galaxies in this band. More active and extincted galaxies, like Arp220, would lead to even lower number counts at low fluxes while flatter spectra like those of AGNs are less flat than M51. In the absence of a well established LLF at 15 m, we consider these two models as upper and lower bounds to the actual no-evolution expectations; note that the corresponding slope is . The actual number counts are well above these predictions; in the 0.3 mJy to 0.6 mJy range, the excess is around a factor 10: clearly, strong evolution is required to explain this result (note the analogy with the radio source counts, Windhorst et al 1993).
We believe, according to the results obtained on the HDF and CFRS fields (Aussel et al 1999a,b, Flores et al 1999), that the sources responsible for the ’bump’ in the 15 m counts are not the faint blue galaxies which dominate optical counts at . Instead, they most probably are bright and massive galaxies whose emission occurs essentially in the IR and could account for a considerable part of the star formation in the universe at .
In Fig. 1, we have overplotted the integral counts in the K (Gardner et al 1993) and B (Metcalfe et al 1995) bands, in terms of . For bright sources, with densities lower than 10 deg-2, these curves run parallel to an interpolation between the ISOCAM counts presented here and the IRAS counts; the bright K sources emit about ten times more energy in this band than a comparable number of bright ISOCAM sources at 15 . But the ISOCAM integral counts present a rapid change of slope around 1-2 mJy, and their numbers rise much faster than those of the K and B sources. The sources detected by ISOCAM are a sub-class of the K and B sources which harbor activity hidden by dust. Linking luminosity to distance, we predict a rapid change of the luminosity function with increasing redshift, which can only be confirmed by a complete ground-based spectro-photometric follow-up. We should be able to follow the evolution of the luminosity function from to with the large number of galaxies detected in the Marano Field surveys. The combination of the intensity of the emission line (redshifted in the J-band) with the IR luminosity could set strong constraints on the star formation rate. Finally, emission line diagnostics, combined with hard X-ray observations with XMM and Chandra, would allow us to understand whether the dominant source of energy is star formation or AGN activity.
Acknowledgements.
One of us (MH) wishes to acknowledge the hospitality of the Max Planck Inst. for Radioastronomy and the A. von Humboldt Foundation of Germany during work on this paper; his research with ISO is funded by a NASA grant.References
- (1) Altieri B., Metcalfe L., Kneib J.P., 1999, A&A 343L, 65
- (2) Aussel H., Cesarsky C., Elbaz D. et al, 1999a, A&A 342, 313
- (3) Aussel H., Elbaz D., Désert F.X. et al, 1999b, in Cox, P., Kessler, M.F. (eds.), The Universe as seen by ISO, ESA SP-427, p. 1023
- (4) Cesarsky C., Abergel A., Agnèse P. et al, 1996, A&A 315, L32
- (5) Cesarsky C.J., Elbaz D., 1996, IAUS, M. C. Kafatos, Y. Kondo (eds.), Kluwer Acad. Pub., Dordrecht, vol. 168, 109.
- (6) Désert F.X., Puget J.L., Clements D. et al, 1999, A&A 342, 363
- (7) Dole H., Lagache G., Puget J.L. et al, 1999, in Cox, P., Kessler, M.F. (eds.), The Universe as seen by ISO, ESA SP-427, p. 1031, astro-ph/9902122
- (8) Dwek E., Arendt R., Hauser M. et al, 1998, ApJ 508, 106
- (9) Fang F., Shupe D., Xu C., Hacking P., 1998, ApJ 500, 693
- (10) Fixsen D.J., Dwek E., Mather J.C. et al, 1998, ApJ 508, 123
- (11) Flores H., Hammer F., Thuan T. et al, 1999, ApJ 517, 148
- (12) Gardner J.P., Cowie L.L., Wainscoat R.J., 1993, ApJ 415, L9
- (13) Guiderdoni B., Bouchet F, Puget J.L. et al, 1997, Nat 390, 257
- (14) Hauser M.G., Arendt R.G., Kelsall T., 1998, ApJ 508, 25
- (15) Kessler M., Steinz J., Anderegg M. et al, 1996, A&A 315, L27
- (16) Lagache G., Abergel A., Boulanger F. et al, 1999, A&A 344, 322
- (17) Lilly S., Le Fèvre O., Hammer F. et al, 1996, ApJ 460, L1
- (18) Madau P., Ferguson H., Dickinson M. et al, 1996, MNRAS 283, 1388
- (19) Marano, B., Zamorani, G., Zitelli, V., 1988, MNRAS 232, 111
- (20) Metcalfe N., Shanks T., Fong R. et al, 1995, MNRAS 273, 257
- (21) Metcalfe L., Altieri B., McBreen B. et al, 1999, in Cox, P., Kessler, M.F. (eds.), The Universe as seen by ISO, ESA SP-427, p. 1019, astro-ph/9901147
- (22) Puget J.L., Abergel A., Bernard J.P. et al, 1996, A&A 308, L5
- (23) Puget J.L., Lagache G., Clements D. et al, 1999, A&A 345, 29
- (24) Rush B., Malkan M.A., Spinoglio L., 1993, ApJS 89, 1
- (25) Serjeant S., Eaton N., Oliver S. et al, 1997, MNRAS 289, 457
- (26) Soifer B.T., Neugebauer G. 1991, AJ 101, 354
- (27) Starck J.-L., Aussel H., Elbaz D. et al, 1999, A&AS 138, 365
- (28) Windhorst R.A., Fomalont E.B., Partridge R.B., Lowenthal J.D., 1993, ApJ 405, 498
- (29) Xu C., Hacking P., Fang F. et al, 1998, ApJ 508, 576