2.4 – 197 m spectroscopy of OH/IR stars:
The IR characteristics of
circumstellar dust in O-rich environments
††thanks: Based on observations with ISO, an ESA project with instruments
funded by ESA Member States (especially the PI countries: France, Germany,
the Netherlands and the United Kingdom) with the participation of ISAS and
NASA.
Abstract
Infrared spectra of a number of evolved O-rich stars have been obtained with the Short- and Long- Wavelength spectrometers on board the Infrared Space Observatory. The very broad wavelength coverage (2.4–197m) obtained by combining observations made with the two spectrometers includes practically all of the flux emitted by the sources, and allows us to determine the emission and absorption features of the dense circumstellar dust shells. Agreement between the fluxes obtained by the two instruments is generally very good; the largest discrepancies are probably due to source variability. Our sample of oxygen-rich AGB stars exhibits a wealth of spectral features due to crystalline silicates and crystalline water ice in emission and absorption. In this study a qualitative overview of all features due to crystalline silicates and water ice in these high mass loss rate objects is presented. It seems that there is a certain onset value for the mass loss rate above which these features appear in the spectrum. Moreover, crystalline silicate emission features have been detected for the first time at wavelengths where the amorphous silicates are still in absorption, implying different spatial distributions for the two materials. A spherically symmetric and an axi-symmetric geometry are proposed.
Key Words.:
Stars: AGB and post-AGB – circumstellar matter – Stars: mass-loss – Infrared: stars1 Introduction
The post-main sequence evolution of stars of low or intermediate mass takes these stars on to the Asymptotic Giant Branch (AGB), where they lose mass at rates of 10-7–10-4M⊙yr-1. In the circumstellar outflows molecules are formed and dust grains condense. The relative abundances of carbon and oxygen in the star determine the chemical composition of the gas and dust in the outflows. Oxygen-rich stars produce silicate dust and molecules such as H2O and OH. If the mass-loss rate is sufficiently high, the dust completely obscures the star at visible wavelengths, and the object is known as an OH/IR star because of its strong emission in the infrared (IR), produced by the dust grains, and in radio OH lines, due to maser action by OH molecules. See Habing (habing (1996)) for a detailed review of AGB and OH/IR stars. The optically-thick dust envelopes of OH/IR stars may be the result of a recent increase in mass-loss rate: the so-called ‘superwind’ phase (e.g. Justtanont et al. 1996b ; Delfosse et al. delfosse (1997)). Omont et al. (omont (1990)) detected the 43- and 60-m emission bands of water ice in the KAO spectra of a number of OH/IR stars, attributing the bands to the condensation of water molecules onto silicate grain cores in the dense outflows.
An important result from the Infrared Space Observatory (ISO) mission is the detection of emission from crystalline silicates in the far-IR spectra of many sources, including the circumstellar environments of young and evolved stars and solar-system comets (e.g. Waters et al. waters96 (1996), waters99 (1999)). Crystalline silicate bands have been detected in OH/IR star spectra (Cami et al. cami (1998)) but are not seen in O-rich AGB stars with low mass-loss rates, suggesting that the abundance of the crystalline materials is related to the density of the circumstellar matter at the dust condensation radius (Waters et al. waters96 (1996)). ISO has also detected thermal emission and absorption by water, in both the gaseous and solid (ice) phases (e.g. Barlow barlow (1998)), from O-rich circumstellar environments.
In this paper we present ISO spectra of seven well-known OH/IR stars covering a range of mass-loss rates. The spectrum of the archetypal Mira variable, Cet, is presented for comparison. For most of our targets, the spectra cover the complete 2.4–197m spectral range of ISO. Sect. 2 of the paper describes the observations and data reduction. In Sect. 3, the spectra are presented and analyzed, with emphasis on the determination of the continuum and the features due to ices and silicates. Concluding remarks are made in Sect. 4.
2 Observations
| Star | IRAS name | Date SWS Obs | Date LWS Obs | LWS Factor | SWS Time | LWS Time |
|---|---|---|---|---|---|---|
| JD 2450000+ | JD 2450000+ | (sec) | (sec) | |||
| Mira | 021680312 | 489.47 | 633.83 | 1.5 | 3454 | 1928 |
| CRL 2199 | 18333+0553 | 749.17 | 746.42 | 0.97 | 1912 | 2228 |
| WX Psc | 01037+1219 | 433.43 | 614.52 | 1.4 | 1912 | 4704 |
| OH104.9+2.4 | 21177+5936 | 321.29 | 321.28 | 1.0 | 1140 | 1268 |
| OH127.8+0.0 | 01304+6211 | 825.20 | 651.02 | 1.0 | 1912 | 1330 |
| OH26.5+0.6 | 183480526 | 368.16 | 368.13 | 1.15 | 1912 | 1268 |
| AFGL 5379 | 174113154 | 879.85 | 507.23 | 0.8 | 1912 | 1614 |
| OH32.8$-$0.3 | 184980017 | 358.42 | – | – | 1912 | – |
Seven of our eight sources were observed with both the SWS and LWS instruments, while of OH32.80.3 only the SWS data were useful. Table 1 lists the sources observed, and the JD dates of the observations (henceforth we abbreviate the OH/IR star designations to OH104.9, OH127.8 etc). Some of our sources (e.g. OH104.9, OH26.5) were observed nearly contemporaneously with the two instruments, while for others, the two spectra were taken more than 100 days apart. In the past, modelling work (e.g. Lorenz-Martins & de Araújo lorenz (1997)) has been hindered to some extent by the non-simultaneity of NIR photometry and 10-20 m spectra (usually IRAS LRS data). The fact that the SWS spectrum covers both these wavelength regions at a single epoch will be useful for future modelling of these sources (Kemper et al, in preparation).
2.1 SWS
The 2.38–45.2 m part of the spectrum was obtained using the ISO Short Wavelength Spectrometer (SWS). A detailed description of the instrument can be found in de Graauw et al. (1996a ). Our objects were observed in AOT 1 mode, speed 2, except for Mira (speed 3) and OH104.9 (speed 1). The spectrum scanned with SWS contains 12 subspectra, that each consist of two scans, one in the direction of decreasing wavelength (‘up’ scan) and one in the increasing wavelength direction (‘down’ scan). There are small regions of overlap in wavelength between the subspectra. Each sub-spectrum is recorded by 12 independent detectors.
The data reduction was performed using the ESA SWS Interactive Analysis package (IA3), together with the calibration files available in January 1999, equivalent to pipe-line version 6.0. We started from the Standard Processed Data (SPD) to determine the final spectrum, according to the steps described in this session.
The observations suffer from severe memory effects in the 4.08–12.0 m and 29.0–45.2 m wavelength regions. It is possible to correct for the memory effects for the individual detectors, using a combined dark-current and memory-effect subtraction method. This method was applied assuming that the flux levels in these wavelength regions are very high, and treating the memory effect as giving an additive contribution to the observed signal. We also assumed that the spurious signal from the memory effect reaches a certain saturation value very quickly after the start of the up scan, and then remains constant throughout the rest of the up scan and the entire down scan. This memory saturation value is measured immediately after the down scan is ended, and is subtracted from the up and down scan measurements. The spectral shape of the memory-corrected down scan is now correct; the error in the spectral shape of the up scan is corrected by fitting a polynomial to the up scan and adjusting this fit to the down scan, without changing the detailed structure of the spectrum. The order of the applied polynomial fit differs per subband, but is chosen to be in agreement with the spectral shape in that band. For band 1 and 4 we mostly used polynomials of order 1 or 2, for band 2a, 2b and 3 we predominantly used order 2 or 3, and for band 2c higher order polynomials (up to order 10) were required to adjust the up scan to the down scan.
The spectra of some of our objects showed fringes in the 12.0–29.0 m wavelength region. This was corrected using the defringe procedures of IA3.
Glitches caused by particle hits on the detector were removed by hand. Glitches can be easily recognized: they start with a sudden increase in flux level, followed by a tail which decreases exponentially with time. Any given glitch affects only one of the two scans.
The data were further analyzed by shifting all spectra of the separate detectors to a mean value, followed by sigma clipping and rebinning to a resolution of , which is reasonable for AOT 1 speed 2 observations.
2.2 LWS
We obtained 43–197 m grating spectra using the LWS instrument. Details of the instrument and its performance can be found in Clegg et al. (clegg (1996)) and Swinyard et al. (swinyard (1996)) respectively. The resolution element was 0.3 m for the the short-wavelength detectors ( m) and 0.6 m for the long-wavelength detectors ( m). Four samples were taken per resolution element. Between 6 and 26 fast grating scans were made of each target, depending on source brightness and scheduling constraints. Each scan consisted of a single 0.5-sec integration per sample.
The data were reduced using the LWS off-line processing software (version 7.0), and then averaging the scans after sigma-clipping to remove the discrepant points caused by cosmic-ray hits.
For all our LWS sources, apart from Mira and WX Psc, the Galactic background FIR emission was strong, and off-source spectra were taken to enable the background to be subtracted from the on-source spectrum. Galactic background flux levels were only significant for m. The Galactic background emission is extended compared to the LWS beam, and therefore gives rise to strong fringing in both the on- and off-source spectra. The background-subtracted spectra do not show fringing, indicating that the OH/IR stars are point-like to the LWS, as expected.
After averaging and background subtraction (if necessary), each observation consisted of ten subspectra (one per detector), which were rescaled by small factors to give the consistent fluxes in regions of overlap, and merged to give a final spectrum.
2.3 Joining the SWS and LWS spectra
One of the main goals of this article is to study the overall ISO spectra of the selected objects. Therefore, it is necessary to join the SWS and LWS spectra in such a way that the flux levels and slopes of the spectra agree for both LWS and SWS. Differences in the flux levels of the LWS and SWS spectra are mostly due to flux calibration uncertainties. Although the spectral shape is very reliable, the absolute flux calibration uncertainty is 30% for the SWS at 45 m (Schaeidt et al. schaeidt (1996)), and 10-15% for the LWS at the same wavelength (Swinyard et al. swin98 (1998)). Therefore, differences between the flux levels of LWS and SWS which are smaller than 33% are acceptable within the limits of the combined error bars.
The SWS and LWS spectra were scaled according to their fluxes in the overlap region. Generally this resulted in a shift of less than 20% (see Table 1). In the case of Mira and WX Psc, a much larger shift was required, presumably due to the large time interval between the SWS and LWS observations of these variable stars.
3 Results
| Star | (M⊙ yr-1) | (K) | ||
|---|---|---|---|---|
| Mira | 1000 | |||
| CRL 2199 | 1.8 | 600 | 1.2 | 3.2 |
| WX Psc | 7.6 | 550 | 1.3 | |
| OH104.9+2.4 | 2.4 | 400 | 1.2 | |
| OH127.8+0.0 | 2.0 | 370 | 2.2 | 16.0 |
| OH26.5+0.6 | 1.2 | 350 | 2.6 | 19.6 |
| AFGL 5379 | 300 | 3.5 | ||
| OH32.80.3 | 2.2 | 280 | 3.9 | 19.0 |
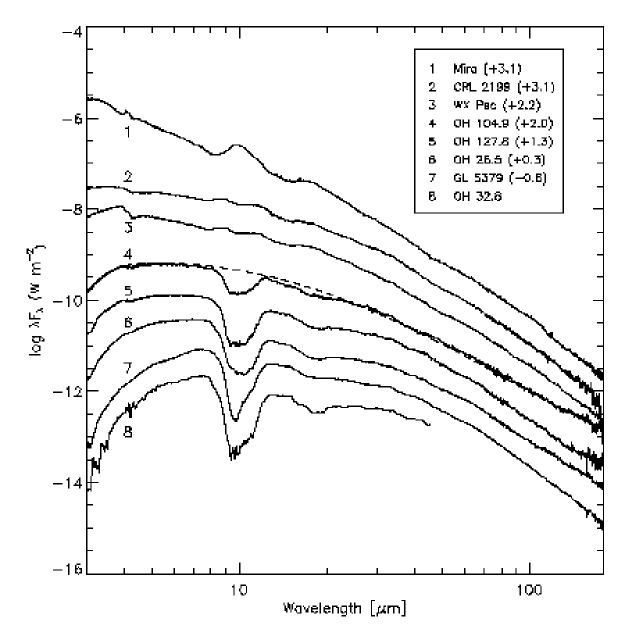
The combined spectra are presented in Fig. 1, in units.
The spectra are ordered by increasing optical depth in the observed 10-m silicate absorption, , and hence are in approximate order of increasing mass-loss rate, assuming roughly similar luminosities. By modelling the infrared excess emission of O-rich AGB stars, Schutte & Tielens (schutte (1989)) and Justtanont & Tielens (justtiel (1992)) have determined the dust mass loss rates for several individual O-rich AGB stars. Their results are summarized in Table 2, where our sources are listed in the same order as in Fig. 1. According to Table 2, our sample is indeed ordered with increasing mass loss rate, excluding WX Psc. The values of measured from the spectra are the apparent optical depth compared to our continuum fit to the overall SED, or to an assumed silicate emission profile for CRL 2199 and WX Psc. They therefore represent only a part of the total 10-m silicate optical depth towards the sources. This is evident from Table 2, where the measured are quoted, along with the 10-m optical depths derived for some of our sources by Justtanont & Tielens (justtiel (1992)), using radiative transfer modelling. A description of the determination of our continuum fit can be found in Sect. 3.1.
All of our sources are dominated by continuum emission from cool dust. The most striking feature in our spectra is the 10-m silicate band, which appears in emission for Mira, partially self-absorbed for WX Psc and CRL 2199, and in strong absorption for the other sources. The overall shape of the observed spectral energy distribution (SED) varies with , the sources with high showing ‘redder’ SEDs. The SEDs can be roughly approximated using blackbodies with temperatures ranging from 300 K for the most optically-thick sources, to 600 K for the partially self-absorbed sources (see Table 2).
The 20-m silicate feature also passes from emission to absorption going down the sequence in Fig. 1, but none of our sources show it as a self-absorbed emission feature. Variations in shape as well as optical depth are evident in the 10- and 20-m absorption features. Weaker features beyond 20 m can be discerned: these are features of water ice and crystalline silicates, and will be discussed below. Evident at short wavelengths are molecular absorption bands (see Justtanont et al. 1996a for identifications for the supergiant source NML Cyg, which is not included here) and the 3.1-m H2O ice absorption feature.
3.1 Determination of the continuum
In order to determine the shape and relative strength of the emission and absorption features we will define a pseudo- continuum, which is assumed to represent featureless thermal emission from the dust. The continuum-divided spectrum will provide us with information on the optical depth of the different species that are located outside the continuum-producing region and the wavelength at which the material becomes optically thin. However, one has to be very careful with the physical meaning of the pseudo-continuum, since the observed continuum results from several wavelength-dependent dust emissivities, with a large range of dust temperatures, modified by strong optical depth effects, rather than being simply a superposition of blackbody energy distributions corresponding to the physical temperature gradient.
For the determination of the continuum we plotted the energy distribution log (W m-2 m-1) against (m). Plotting the data this way one can easily recognize the general shape of the continuum; the parts of the spectrum where the continuum is well defined, i.e. the long and short wavelength edges, are emphasized. This makes it easier to constrain the continuum in the wavelength regions where the strong spectral features are present. At m, the dust is optically thin, and only weak emission features are present. At m, the radiation from the stellar photosphere is partially (for the Miras) or completely (OH/IR stars) absorbed by molecular lines and the high dust opacity towards the central star. When a spline fit is performed in log space, we can thus constrain the continuum by using the known long and short wavelength continuum contributions as reference points. Applying spline fitting with the same reference points in other parameter spaces ( log space, space, log space etc.) shows that all the fits vary within 10% (in flux) with respect to the adopted pseudo-continuum in the 10–20 m region.
3.2 Description of the spectrum
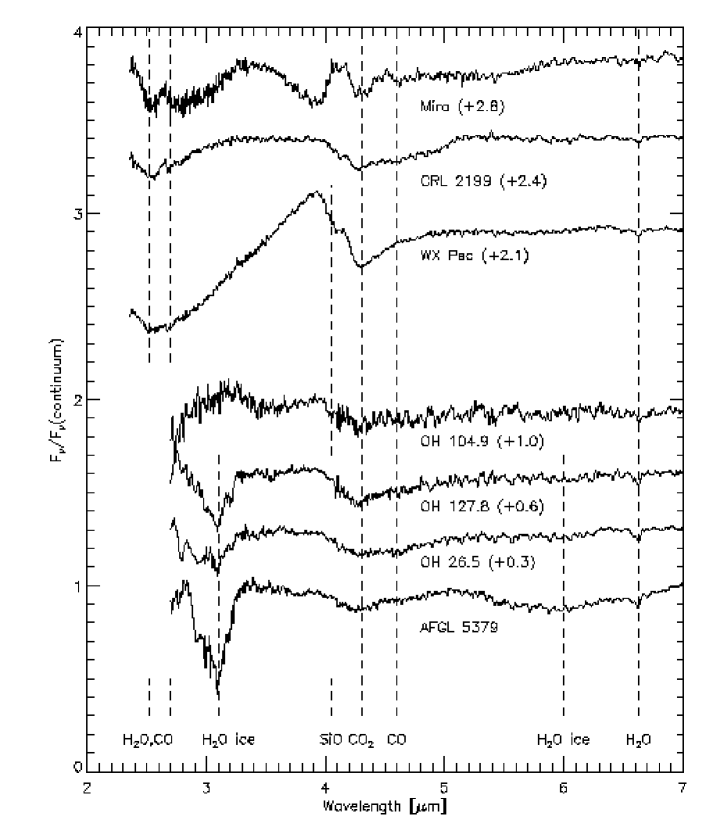
Figs. 2–4 show the observed spectra after division by the adopted continuum. A wealth of interesting features can be recognized in the spectra. At the shortest wavelengths, from 2.38 – 7 m, see Fig. 2, the spectrum is dominated by molecular absorption bands and the effects of dust absorption. In Mira and the intermediate type stars (WX Psc and CRL 2199), strong absorption features due to a blend of H2O and CO are present from 2.38–3.3 m (2.38–3.8 m in the case of WX Psc), see Fig. 2. Absorption due to SiO is found in some objects around 4.0 m, most prominently in WX Psc and OH104.9. In most of our spectra we find clear absorption features of gaseous CO2 at 4.3 m. CO line absorption around 4.5 m is found in all our spectra. Throughout the whole 2.38–7 m wavelength region, H2O absorption lines are present; very strong lines of gaseous H2O are found at 6.60–6.63 m. Yamamura et al. (yamamura (1999)) have performed a detailed study of the water features in the spectrum of Mira; Mira is also the only source in our sample that shows OH absorption lines in the 2.5–3.5 m region. In the high mass-loss rate objects, water ice features are present as well, at 3.1 and (possibly) 6.0 m. The ice features will be discussed in the next section.
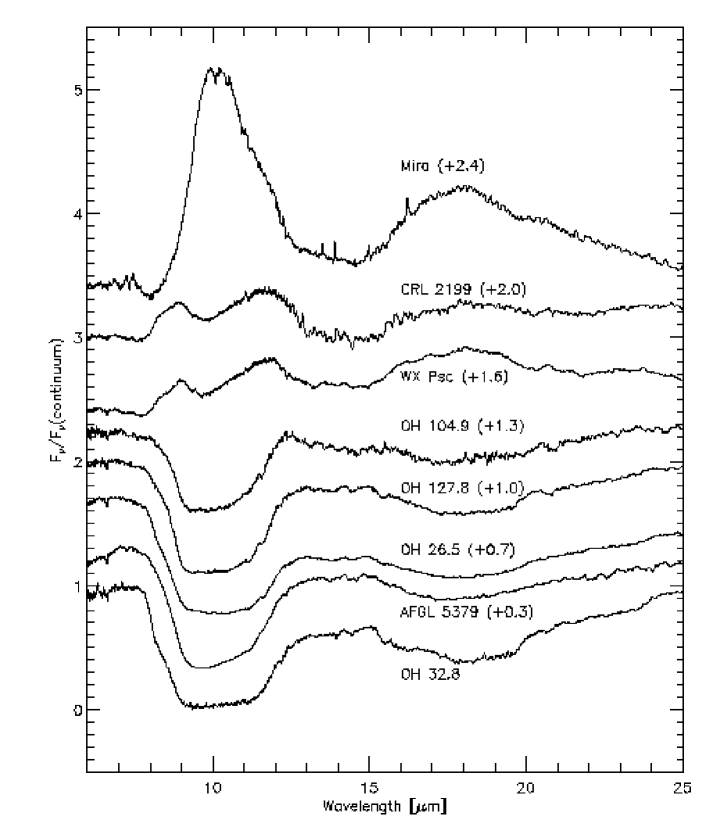
The 7–25 m region (Fig. 3) is dominated by the strong features of amorphous silicates. The 9.7-m feature (ranging from 8 to 12–13 m) and the 18 m feature (ranging from 15 to 20–25 m) are very strong bands that occur in emission or (self-)absorption. Crystalline silicate features also occur in the same wavelength ranges but are usually much weaker, so the actual shape of the observed silicate bands is due to a blend of crystalline and amorphous silicates. Absorption by molecular SiO can be seen at 8 m, on the wing of the silicate feature. Around 15 m the spectrum of Mira exhibits some sharp emission lines due to CO2.
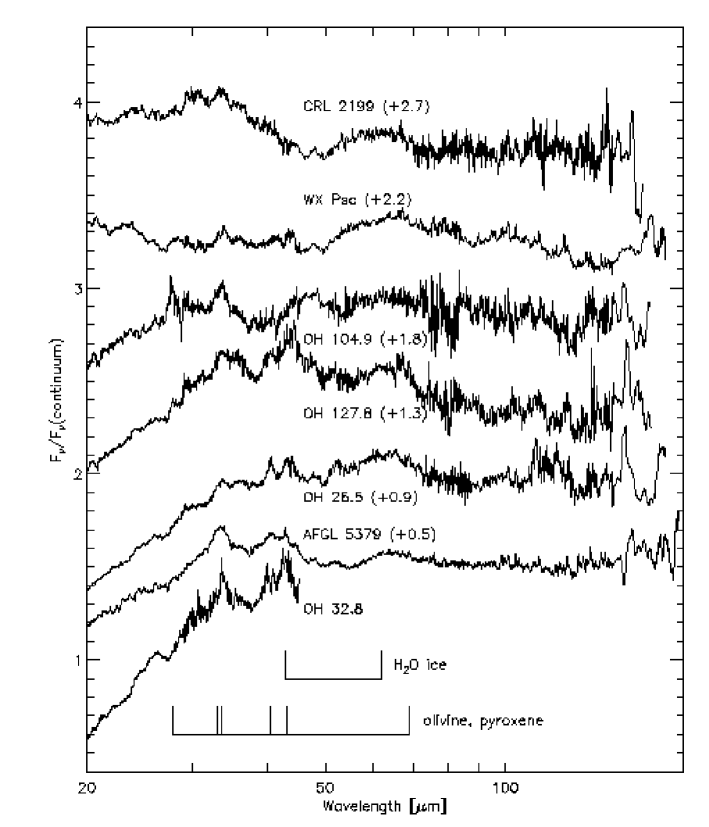
Longwards of 25 m (Fig. 4), most spectral features occur in emission. The only absorption feature is the OH pumping line at 34.6 m, which is detected in some of the sample stars. Groups of crystalline silicate emission features occur near 28, 33, and 43 m, the latter probably being a blend with the 43 m crystalline water ice feature, while a broad feature, which we ascribe to water ice, peaks around 62 m. Superposed on this is a sharp feature at 69 m, due to forsterite.
Several sources show emission features near 47.5 and 52 m. The longitudinal optical band of water ice lies close to 52 m (Bertie & Whalley bertie (1967)), but in laboratory data it is only ever seen as a shoulder on the 43-m band (e.g. Smith et al. smithal (1994)), not a clearly-separated feature. The observed feature is therefore unlikely to be the longitudinal ice band. Malfait et al. (malf99 (1999)) suggested that montmorillonite, which gave a good fit to the broad 100-m emission feature in the spectrum of HD 142527, is a possible carrier of the 47 and 50m features in this source. The planetary nebula NGC 6302 also shows the 47, 53 and 100 m bands (Lim et al., 1999). If the three features do have a common carrier, the apparent absence of the 100 m band in the spectra presented here may be due to a difference in dust temperature.
As well as broad emission bands, unresolved emission lines can be detected in the long-wavelength regions of the least noisy of our spectra, (e.g. WX Psc and AFGL 5379). Most of these lines are pure rotational lines of water vapour. The 157.7-m [C ii] line is also visible in most of our sources; this is the residual Galactic background [C ii] emission after subtraction of the off-source spectrum. In the case of AFGL 5379, the [C ii] line is seemingly in absorption: again, this is due to imperfect cancellation of the background emission.
3.3 Water Ice
Water ice is an important component of the solid-phase material in cool astronomical sources. Its spectrum shows bands at 3.1, 6.0, 11-12, 43 and 62 m. The 3.1-m stretching band is seen (always in absorption) in the spectra of many highly-embedded young stars (e.g. Whittet et al. whittet (1988)) and in some OH/IR stars (e.g. Meyer et al. meyer (1998)). Its formation in the circumstellar envelopes of OH/IR stars has been discussed in particular by Jura & Morris (jura (1985)). Before the ISO mission, the far-IR ice bands had been observed in emission in a small number of sources including the OH/IR stars OH26.5, OH127.8 and OH231.84.2 (Omont et al. omont (1990) and references therein). ISO spectra have shown the 43- and 62-m ice bands in emission in various objects (Barlow barlow (1998)), such as the planetary nebulae CPD (Cohen et al. cohen (1999)) and NGC 6302 (Lim et al. lim (1999)), the post Red Supergiant source AFGL 4106 (Molster et al. 1999a ) and Herbig Ae/Be stars (Waters & Waelkens wawa (1998); Malfait et al. malfait (1998), malf99 (1999)), while the 43-m band has been detected in absorption toward the highly-embedded sources AFGL 7009 and IRAS 19110+1045 (Dartois et al. dartois (1998), Cox & Roelfsema cox (1999)). Both of the far-IR bands can be blended with crystalline silicate emission, but examination of the shapes and positions of the observed bands can distinguish between silicate and ice emission.
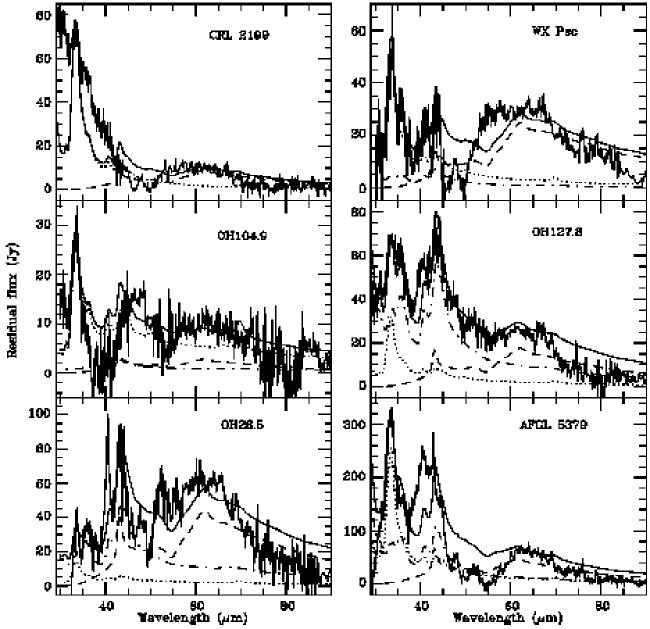
The new ISO spectra have significantly better resolution and sensitivity than the earlier KAO data. Fig. 5 shows attempts to fit the 30–90 m region of our (continuum-subtracted) spectra, using a spectral synthesis routine kindly provided by Dr T. Lim (personal comm.). This routine takes absorption (or emission) efficiencies for materials of interest, along with user-defined temperatures and relative amounts, and produces the resulting spectrum for optically-thin emission from the individual materials, as well the total emission from all the materials (shown as the thin solid line in Fig. 5). The materials used to fit the OH/IR star spectra were forsterite, enstatite and crystalline water ice; temperatures of order 50–100 K were used for the fitting. The detected ice features are listed in Table 3.
Pyroxenes (such as enstatite; see dash-dotted line in Fig. 5) also show strong 43-m features, therefore detection of a 43-m band in an observed spectrum is not sufficient evidence to demonstrate the presence of H2O ice. However, for temperatures 40 K, the 43-m peak is at least as prominent as the 62-m peak, so objects which do not have a 43-m feature are unlikely to contain much water ice (unless it is very cold). Conversely, if an object shows the 62-m feature, H2O ice is likely to be responsible for at least part of that object’s 43-m feature.
We claim detections of crystalline water ice emission based on the presence of the bands at 43 and 62 m in OH127.8, OH26.5 and AFGL 5379, confirming the tentative detections for the first two sources by Omont et al. (omont (1990)). OH32.8 also shows a 43-m feature (Fig. 4), but without observations of the 62-m feature, we cannot determine if ice emission is present.
CRL 2199 and WX Psc both seem to show broad 50–70 m features, but the shape of these features does not resemble laboratory crystalline ice features, unlike the observed features of OH127.8, OH26.5 and GL5379. In particular, the emissivity of ice has a minimum near 55 m before reaching its peak at 62 m (see dashed line in Fig. 5). This structure is present in the spectra of the latter three sources, while the CRL 2199 and WX Psc features are more flat-topped, with strong emission at 55 m and no real evidence of a peak at 62 m. The attempt to fit the WX Psc spectrum with ice emission (Fig. 5) illustrates this point. The OH 104.9 features are rather weak and ill-defined; there may be a weak 62-m band, but the 43-m band is replaced by a broader feature peaking near 47 m.
If the 50–70 m features in CRL 2199 and WX Psc are not water ice, what are they? They may simply be instrumental artefacts: Fig. 1 illustrates how the spectra are dominated by the steep downward slope of the SED, and that spectral features around 60 m are small perturbations on this overall trend. (Clearly, this statement also holds for the features which we believe to be real.) Experiments with adopting different LWS dark currents and with methods for dealing with detector memory effects made little difference to the spectra. The clino-pyroxene optical constants of Koike et al. (koike (1993)) show a broad feature around 60 m (see also Cohen et al. cohen (1999)), but this peaks at longer wavelengths than the crystalline water ice band, and so is not a likely carrier for the CRL 2199 and WX Psc features. Similarly, the 62-m features in OH127.8, OH26.5 and GL 5379 do not need an additional long-wavelength component, so the Koike pyroxene is not necessary to fit these spectra. The Jäger et al. (jaeger (1998)) laboratory data do not reproduce the broad 60-m band seen in the Koike data, so the feature may not be real.
In general, we find that the observed features in Fig. 5 are narrower than our fits, suggesting that we have overestimated the continuum level in this wavelength region, or that the optical constants we used do not adequately represent the circumstellar materials.
The sources in which we detect the ice emission features are the four stars with the deepest 10-m silicate absorption, and hence presumably the highest mass-loss rates. These same stars also show the 3.1-m absorption band (see Fig. 2). OH32.8 was too faint at 3 m to be detected by the SWS, but the 3.1-m ice absorption feature has been detected in ground-based spectra (Roche & Aitken roche (1984)). The sources with self-absorbed silicate emission features, do not appear to show ice features. OH104.9, which shows a relatively shallow silicate absorption, may show a weak 3.1-m absorption, but it is hard to discern, because the spectrum is noisy at short wavelengths.
The 6.0-m band of water ice is significantly weaker than the 3.1m band (see e.g. Moore moore (1999)). The spectra of our most heavily-obscured sources, OH32.8, AFGL 5379 and OH26.5, show a weak depression around 6 m, but this wavelength region is very rich in gaseous H2O lines, making it difficult to ascribe the observed feature to ice absorption.
Ice formation requires cool temperatures and sufficient shielding from stellar and interstellar radiation (e.g. Whittet et al. whittet (1988)). The high densities in the (general) outflow that accompany large mass-loss rates may provide the required shielding. Alternatively, enhanced densities could be provided by the formation of a circumstellar disk in the superwind phase, or by inhomogeneous mass loss, such as is apparent in studies of H2O and OH maser clumps (e.g. Richards et al. richards (1999)). As discussed by Omont et al. (omont (1990)), the presence of the 63-m band requires that the water ice is at least partially crystalline, implying that the ice remained relatively warm (100 K) for long enough to allow crystalline reorganization to take place.
Optical depths and column densities for the detected 3.1-m features are given in Table 3. Meyer et al. (meyer (1998)) have proposed that the ice column density correlates better with the ratio of mass-loss rate to luminosity () than with alone. Adopting reasonable estimates (based on values in the literature) for these parameters, our results support the relation between ice column density and proposed by Meyer et al (see their Fig. 3). However, given the uncertainties in both parameters, and that the luminosity changes significantly with the variability phase, the relationship should be treated with some caution.
OH32.8 shows the 3.1-m ice band, and an 11-m absorption feature in the wing of the silicate absorption feature (Roche & Aitken roche (1984)) which was attributed to the libration mode of water ice. Justtanont & Tielens (justtiel (1992)) were able to model ground-based and IRAS observations of this source using silicate grains with water-ice mantles, which give a much broader 10-m absorption feature than do bare silicate grains.
The broad 11-m feature is clearly seen in the five sources with strong 10-m absorption (Fig. 1). It appears strongly in OH26.5, OH104.9, OH127.8 and OH32.8, and as an inflection near 11.5 m in AFGL 5379. The contribution of this feature to the overall 10-m absorption profile therefore does not appear to correlate fully with the presence of the other water ice bands: AFGL 5379 shows strong far-IR ice emission and 3.1-m absorption, but only weak 11-m absorption, while OH104.9 shows strong 11-m absorption but has weak or absent far-IR and 3.1-m features.
Smith & Herman (smith (1990)) found an 11-m absorption feature in the spectrum of another OH/IR star, OH138.0+7.3, which does not show any ice absorption at 3.1 m. Since the 3.1-m stretching mode is intrinsically stronger than the libration mode, Smith & Herman concluded that the 11-m feature observed towards OH138.0 is not produced by water ice, and suggested that it is due to partially-crystalline silicates. Another possibility is that spectra like that of OH138.0 are the absorption counterpart of the Little-Marenin & Little (lml (1990)) ‘Sil++’ or ‘Broad’ emission features, which show an emission component at 11 m on the wing of the silicate feature. These features have been ascribed to crystalline silicates or amorphous alumina grains (see e.g. Sloan & Price sloan (1998)). Clearly, full radiative-transfer modelling would be useful to determine whether ice mantles can indeed explain the range of 11-m features seen, or whether other grain components are necessary.
The presence of strong water ice features in our spectra indicates that a substantial amount of the H2O in the circumstellar envelopes may be depleted into the solid phase. This would decrease the amount of gas-phase H2O (and photodissociated OH) in the outer regions of the circumstellar envelope which can be detected by maser and thermal emission, Water maser lines are observed to be relatively weaker in OH/IR stars than in objects with lower mass-loss rates (e.g. Likkel likkel (1989)). Collisional quenching due to the high densities in the inner parts of the outflow is thought to suppress the maser action; our results indicate that depletion into the solid (ice) phase may also play a role.
CO ice shows features near 4.7 m (e.g. Chiar et al. chiar (1995)): these are not seen in our spectra, but a broad absorption band around 4.3 m, due to gas-phase CO is seen. This band is significantly broader than the 4.27-m CO2 ice absorption feature seen in molecular clouds (e.g. de Graauw et al. 1996b ). We see no evidence of CO2 ice at 4.27 m. CO2 ice shows another strong feature at 15 m; our spectra show some structure near this wavelength (Fig. 6), but this may be an artefact of the instrument or data-reduction process.
3.4 Silicates
For these objects, most of the energy radiated by the central star is absorbed by the circumstellar dust shell and re-radiated as thermal emission, predominantly by amorphous silicates. Amorphous silicates have strong features at 10 and 18 m. The current objects can be ordered by increasing optical depth of those features, which agrees with ordering by increasing wavelength of the peak of the SED. When the 10-m feature becomes optically thick, the energy from the central star must be re-radiated at even longer wavelengths, therefore the peak position shifts towards 30 m (see Fig. 1). It is believed that the low mass loss rate Miras evolve into high mass loss rate OH/IR stars, while the IRAS colors indicate that the peak of the dust emission shifts towards longer wavelengths (van der Veen & Habing vanderveen (1988)). With increasing mass loss rate the characteristic density in the wind will increase, increasing the optical depth towards the central star. This evolution can be found in the oxygen-rich AGB stars in our sample.
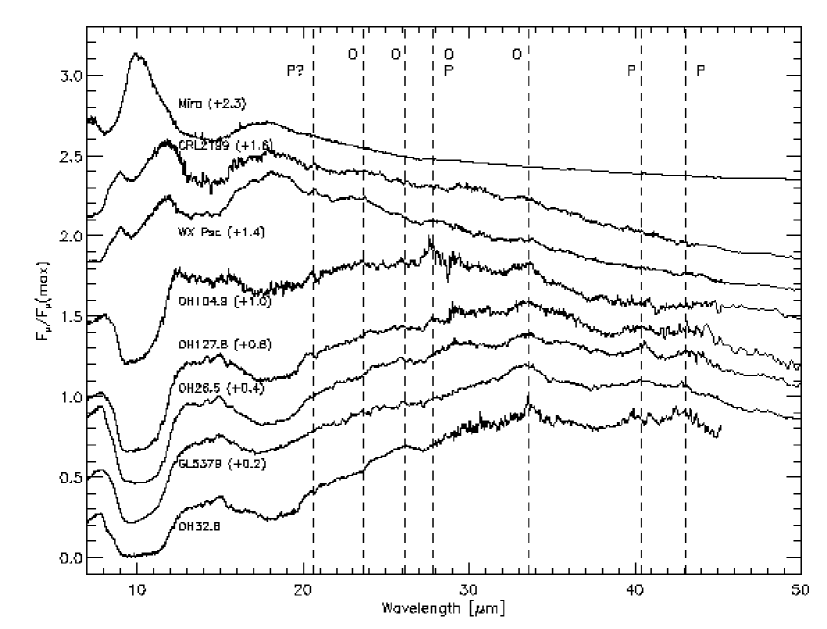
In Fig. 6 the objects are plotted in the same order as in Fig. 1, however, the intensities are now in units, and normalized with respect to the measured maximum intensity. The 10-m feature of Mira is completely in emission; for WX Psc and CRL 2199, the 10-m feature is partially self-absorbed. For the OH/IR stars OH104.9, OH127.8, OH26.5, AFGL 5379 and OH32.8, the 10-m feature is completely in absorption, with optical depths ranging from 1.1 for OH104.9 to 3.6 for OH32.8. A detailed analysis of the amorphous silicate features will be presented in a future paper (Kemper et al, in preparation). As the optical depth increases, some structure becomes apparent in the 20–45 m region.
| (m) | 20.6 | 23.6 | 26.1 | 27.8 | 33.0-33.6 | 40.4 | 43.1 | 69 |
|---|---|---|---|---|---|---|---|---|
| Species | P? | O | O | O,P | O,P | P | P | O |
| Mira | N | N | N | N | N | N | N | N |
| CRL 2199 | Y+ | N | N | N | Y+ | Y+ | N | N |
| WX Psc | Y+ | Y+ | N | Y+ | Y+ | N | N | N |
| OH104 | Y+ | Y+ | Y+ | Y+ | Y+ | N | N | N |
| OH127 | Y? | N | Y+ | Y+ | Y+ | Y+ | Y+ | Y+ |
| OH26 | Y | Y | Y+ | N | Y+ | Y+ | Y+ | Y+ |
| AFGL 5379 | N | N | Y+ | N | Y+ | Y+ | Y+ | Y+ |
| OH32 | Y | Y | Y+ | N | Y+ | Y+ | Y+ | Y+ |
In the lower mass-loss rate objects, strong emission features due to amorphous silicates are present, but there are no obvious narrow features at m. For the redder objects, we find that the amorphous silicates features are (self-)absorbed, and that some structure is apparent at wavelengths m. These narrow features can be identified as crystalline silicates, both olivines and pyroxenes (Waters et al. waters96 (1996)). The identifications are based on laboratory spectra of crystalline silicates (Jäger et al. jaeger (1998); Koike et al. koike (1993), Koike & Shibai koike98 (1998)) and similar bands seen in other objects on which detailed studies have been performed, i.e. AFGL 4106 (Molster et al. 1999a ) and to HD 45677 (Voors voors (1999)). The dashed lines in Fig. 6 represent the position of some important crystalline silicate complexes, which are listed in Table 4. These crystalline silicate features are found in emission at the longest wavelengths but sometimes in absorption at somewhat shorter wavelengths, for example the 23.6 m olivine feature in OH32.8 and in OH26.5 (see Fig. 6). The OH/IR stars presented here are the only objects known to exhibit crystalline silicates in absorption outside the 8-13 m wavelength region. For OH32.8 this was already reported by Waters & Molster (wamo (1999)) in comparison with AFGL 4106. The presence of the most important crystalline silicate features is indicated in Table 4 for all the sources in our sample. Note that those features are detected by close examination of the spectrum; not all features are visible in the overview figures presented in this paper. Detailed modelling of the wealth of crystalline silicate features shown by the individual objects is deferred to a future paper.
The crystalline silicate features tend to appear in those sources having greater optical depth at 10 m. However, the sharpness of the crystalline silicate features shows a large variation. The sharpness is expected to be determined by properties of the crystalline silicates, such as the presence of impurities, the shape of the dust grains, and irregularities in the lattice structure. The spectrum of AFGL 5379 does not show the sharp crystalline peaks found in the spectra of the other OH/IR stars and in the spectra of AFGL 4106 and HD 45677, but the shapes of its features do resemble the laboratory spectra of crystalline silicates (Jäger et al. jaeger (1998)). This suggests that the dust grains around these objects exhibit differences in the properties of the lattice structure, such as impurities, holes, and edge effects due to grain size. The appearance of the crystalline silicate emission features in the redder sources in our sample confirms the relationship between dust crystallinity and envelope colour temperature, and hence mass-loss rate, identified by Waters et al. (waters96 (1996)). Specifically, there seems to be a threshold value for the mass loss rate above which the crystalline silicate features appear in the spectrum. However, above this threshold value, the strength and width of the features seem to be uncorrelated to the mass loss rate.
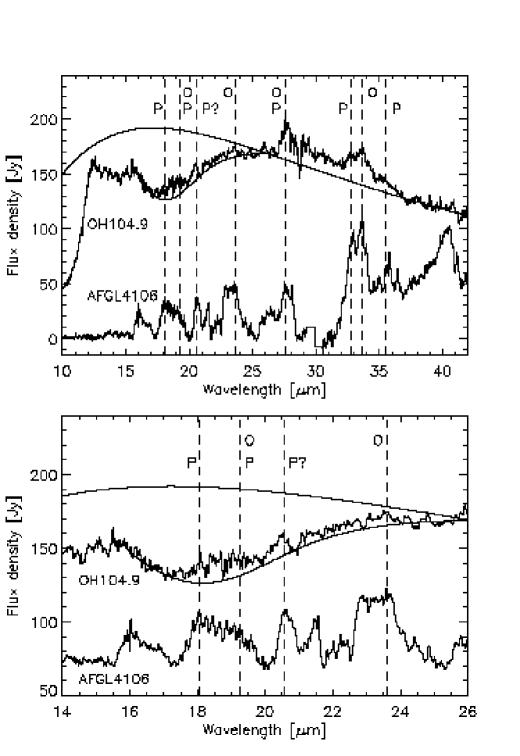
Fig. 7 presents a more detailed overview of the location of the crystalline silicate features. In the upper panel, the upper spectrum is that of OH104.9. The solid line represents the continuum fit obtained using the method described above. At longer wavelengths the spectrum shows emission features superposed on the pseudo-continuum. The 18-m absorption feature extends to m. However, as Fig. 7 clearly shows for both plots, there are crystalline emission features present within this wavelength region, in particular, the 17.5–20 m complex. For reference, the continuum-subtracted spectrum of AFGL 4106 (Molster et al. 1999a ) is also plotted. The 20.6 m emission feature is probably related to crystalline silicates, although it is not yet identified (Molster et al. 1999a ; Voors voors (1999)). These OH/IR star spectra are the first to show crystalline silicates in emission simultaneously with amorphous silicates in absorption in the same wavelength region.
The presence of crystalline emission features in the spectrum of OH104.9, at wavelengths where the amorphous dust component is still in absorption, implies that the crystalline silicate dust must have a different spatial distribution than the amorphous silicate dust. We consider two possible geometries: spherical and axi-symmetrical.
For the case of a spherically symmetric distribution, the crystalline dust can have a different radial distribution and be located further out in the envelope than the amorphous dust. The SWS and LWS beam sizes are much larger than the angular size of the dust shells of these OH/IR stars, so the amorphous silicate absorption can originate from the entire dust shell, while the crystalline silicate emission can arise from the cool outer layers of the dust shell, where the material is optically thin. If the crystalline silicates are located further out, we can conclude that the crystalline and amorphous dust has not formed at the same time, but that the amorphous dust annealed as it moved away from the star. This could imply that lower mass loss rate Mira variables could in principle be able to form crystalline material as well, but that we cannot detect it because the column densities are not high enough. However, given that higher temperatures are required for annealing amorphous silicates into crystalline silicates than are required for the formation of amorphous silicates themselves, it does seem unlikely that crystalline silicate grains could be formed further out in an outflow than amorphous silicate grains. One possibility is that some small fraction of the particles which formed in an outflow (perhaps the smallest particles) immediately annealed into crystalline silicates in the inner, hottest regions. The large total column density of amorphous silicate grains would lead to net absorption in the 10- and 18-um bands and thus obscure these hot crystalline silicates. When these particles are cooled while flowing outwards, the strong emission features of crystalline silicates at wavelengths longer than 15 m can be seen superposed on the amorphous dust features.
An alternative scenario for the observed behaviour is that OH/IR stars possess a dust disk, in addition to a more spherically symmetric outflow. Two alternatives suggest themselves:
-
•
Crystalline silicates that have formed and moved out from the inner regions of the outflow produce emission bands that are seen superposed against the continuum emission and amorphous silicate features that arise from the disk. This would require that those OH/IR stars that have the largest 10-m amorphous silicate optical depths are the ones whose disks are seen most nearly edge-on.
-
•
The crystalline silicates are located in the disk, while the amorphous silicates are located mainly in the outflow and thus have a more spherically symmetric distribution, with the amorphous silicate absorption features arising from optically thick lines of sight towards the central star. Depending on the inclination angle of the system, the crystalline silicate features can be seen in emission. When the disk is viewed face-on, the crystalline silicate features would be optically thin. Radiation from most of the disk surface reaches the observer via lines of sight which pass through only the outer regions of the spherical dust shell, where the amorphous material is not optically thick.
Two mechanisms can be invoked to explain the high abundance of crystalline silicates in a disk. Below the so-called glass temperature, only amorphous silicates condense, while crystalline silicates can form at temperatures greater than the glass temperature. At the high densities occurring in a disk, condensation of silicates will be able to proceed at higher temperatures than usual (Gail & Sedlmayr gail (1999)) and the temperature range in which it is possible to condense crystalline silicates is thus broadened. In our current sample there is empirical evidence for a correlation between crystallinity and density. Second, if there is amorphous material present in the disk, this can be transformed into crystalline material by annealing. In order to allow the annealing process of the silicates to proceed, the dust-forming region should not cool too rapidly. An orbiting (or slowly outflowing) disk provides the required stability and keeps the amorphous silicates relatively close to the central star for a sufficiently long time for the annealing into crystalline material to occur. Both the above mechanisms provide circumstances that allow the formation of crystalline silicates, which would not be the case if the stellar wind removes the newly-formed silicates at the outflow velocity, such that they rapidly cool.
In order to study the spatial distribution of both dust components in more detail, spectral mapping of the OH/IR stars is necessary. Then we may be able to put constraints on the spatial distribution, and determine the annealing time, of the crystalline dust, using travel time and stability arguments. Using laboratory data on annealing time scales, we may be able to determine physical parameters such as temperature and density in the circumstellar dust shell, thus helping to clarify the AGB mass loss phase of stellar evolution. Recent high-resolution imaging of the dust around evolved stars, such as Mira (Lopez et al. lopez (1997)) and VY CMa (Monnier et al. monnier99 (1999)), has shown that substantial inhomogeneities exist in the dusty outflows; our spectra suggest that the dust around OH/IR stars may also show complex morphologies.
For any geometry of the circumstellar shell, the amorphous–crystalline volume ratio could also be affected by grain-grain collisions. Such collisions have long been recognised as important processes for the evolution of grains in circumstellar envelopes (see e.g. Biermann & Harwit bier (1980)) and in the interstellar medium (Jones et al. jones (1996)). The shock wave driven into the two grains by the collision can lead to vaporization, the formation of high pressure phases, melting, annealing, and shattering depending on the pressures involved (cf., Tielens et al. tmsh (1994)). Experiments show that at a relative collision velocity of 1 km s-1, mechanical effects (shattering, crater formation) become important. Thermal effects such as crystallization, involving the intergranular nucleation of new, strain–free grains in a previously highly deformed matrix start at somewhat higher velocities ( 5 km s-1; 700 kbar) and are never very pervasive. Above 7 km s-1 (1 Mbar), melting followed by rapid quenching leads to glass formation (Bauer bauer (1979); Schaal et al. schaal (1979)). Thus, these experiments imply that crystallization only occurs over a very narrow collision velocity range and is not very efficient. Of course, if the projectile/target size ratio is large, even high velocity impacts will lead to a small volume fraction of the target grain passing through the regime where recrystallization can occur when the shock wave expands.
Given the grain velocity profile in AGB outflows (Habing et al. habingea (1994)), potentially crystallizing grain-grain collisions will be largely confined to the acceleration zone at the base of the flow. An important objection against annealing through grain-grain collisions is that the cooling time scales of dust grains are very short compared to the annealing time scales. Therefore the silicate dust grains solidify in the amorphous state (Molster et al. 1999b ). The annealing process can be described as a three dimensional random walk diffusion process on a cubic lattice (Gail hpgail (1998)), which provides an estimate of the annealing time scale as a function of dust temperature. At a = 2000 K the annealing time scale is 1 s and strongly increases for lower temperatures. The cooling time scale can be derived under the assumption that the power emitted by the dust grain is given by the Planck function, modified by the Planck mean of the absorption efficiency . By comparing the emitted power to the internal heat of the grain one finds for the cooling time scales 10-3 s for = 2000 K and 0.02 s for = 800 K. In agreement with the experiments, only a small fraction of crystallized material is expected due to the grain-grain collisional shock loading. Final assessment of the viability of this mechanism for the formation of crystalline silicates in AGB outflows has to await detailed modeling of such grain-grain collisions in circumstellar outflows (Kemper et al. in preparation). Finally, we note that the spectrum of Pic, which is due to a dust size distribution that is surely collisionally dominated, shows little evidence for crystalline silicates. Although the 10 m spectrum of Pic (Knacke et al. knacke (1993), Aitken et al. aitken (1993)) may show some spectral structure resembling that of solar system comets – characteristic for silicate minerals – the longer wavelength bands so prominent in cometary spectra are completely absent in this source (Pantin et al. malfbpic (1999)). While this may at first sight argue against this mechanism, the collisional velocities in this system may be much lower and predominantly lead to shattering.
4 Conclusions
We have presented the complete SWS/LWS spectra for seven oxygen-rich evolved stars, together with the SWS spectrum of an eighth source. For the OH/IR stars, which have optically thick dust shells, essentially all of the stellar luminosity is radiated in the wavelength region covered by ISO. Emission features of crystalline silicates are seen longwards of 15 m in the dustier objects. Some of these emission features lie within the 20-m absorption feature of amorphous silicate, suggesting that the crystalline and amorphous components have different spatial distributions. The dust shells of these sources are sufficiently cool for abundant water ice to form, as indicated by the near-IR absorption and far-IR emission features of crystalline ice.
In a future paper (Kemper et al., in preparation) we will present some of the further analysis and modelling required to determine the physical conditions and processes which give rise to these very rich spectra.
Acknowledgements.
We thank Tanya Lim for making available the spectral synthesis routine, and the referee, H. Habing, for constructive comments. FK and LBFMW acknowledge financial support from NWO Pionier grant number 616-78-333, and from an NWO Spinoza grant number 08-0 to E.P.J. van den Heuvel.References
- (1) Aitken D.K., Moore T.J.T., Roche P.F., Smith C.H., Wright C.M., 1993, MNRAS, 265, L41
- (2) Barlow M.J., 1998, Ap&SS, 255, 315
- (3) Bauer, J.F., 1979, Proc. Lunar Planet Sci.Conf., 10, 2573
- (4) Bertie J.E., Whalley E., 1967, J. Chem. Phys., 46, 1271
- (5) Biermann P., Harwit M., 1980, ApJL, 241, L105
- (6) Cami J., de Jong T., Justtanont K., Yamamura I., Waters L.B.F.M., 1998, Ap&SS, 255, 339
- (7) Chiar J.E., Adamson A.J., Kerr T.H., Whittet D.C.B., 1995, ApJ, 455, 234
- (8) Clegg P.E., Ade P.A.R., Armand C., et al., 1996, A&A, 315, L38
- (9) Cohen M., Barlow M.J., Sylvester R.J., et al., 1999, ApJL, 513, L135
- (10) Cox P., Roelfsema P., 1999, in Solid interstellar matter - the ISO revolution, Les Houches No 11, L. d’Hendecourt, C. Joblin & A. Jones eds., EDP Sciences, Les Ulis
- (11) Dartois E., Cox P., Roelfsema P.R., et al., 1998, A&A, 338, L21
- (12) de Graauw Th., Haser L.N., Beintema D.A., et al., 1996a, A&A, 315, L49
- (13) de Graauw Th., Whittet D.C.B., Gerakines P.A., et al., 1996b, A&A, 315, L345
- (14) Delfosse X., Kahane C., Forveille T., 1997, A&A 320, 249
- (15) Gail H.-P., 1998, A&A, 332, 1099
- (16) Gail H.-P., Sedlmayr E., 1999, A&A 347, 594
- (17) Habing H.J., 1996, A&AR, 7, 97
- (18) Habing, H.J., Tignon, J., Tielens, A.G.G.M., 1994, A&A, 286, 523
- (19) Jäger C., Molster F.J., Dorschner J., et al., 1998, A&A, 339, 904
- (20) Jones A.P., Tielens A.G.G.M., Hollenbach D.J., 1996, ApJ, 469, 740
- (21) Jura M., Morris M., 1985, ApJ 292, 487
- (22) Justtanont K., Tielens A.G.G.M., 1992, ApJ, 389, 400
- (23) Justtanont K., de Jong T., Helmich F.P., et al., 1996a, A&A, 315, L217
- (24) Justtanont K., Skinner C.J., Tielens A.G.G.M., Meixner M., Baas F., 1996b, ApJ, 456, 337
- (25) Knacke R.F., Fajardo-Acosta S.B., Telesco C.M., Hackwell J.A., Lynch D.K., Russell R.W., 1993, ApJ, 418, 440
- (26) Koike C., Shibai H.,1998, ISAS report no. 671
- (27) Koike C., Shibai H., Tuchiyama A., 1993, MNRAS, 264, 654
- (28) Little-Marenin I.R., Little S.J., 1990, AJ 99, 1173
- (29) Likkel L., 1989, ApJ, 344, 350
- (30) Lim T., Molster F.J., Sylvester R.J., et al., 1999, A&A, submitted
- (31) Lopez B., Danchi W.C., Bester M., et al., 1997, ApJ, 488, 807
- (32) Lorenz-Martins S., de Araújo F.X., 1997, MNRAS, 291, 296
- (33) Malfait K., Waelkens C., Waters L.B.F.M., et al., 1998, A&A, 332, L25
- (34) Malfait K., Waelkens C., Bouwman J., de Koter A., Waters L.B.F.M., 1999, A&A, 345, 181
- (35) Meyer A.W., Smith R.G., Charnley S.B., Pendleton Y.J., 1998, AJ 115, 2509
- (36) Molster F.J., Waters L.B.F.M., Trams N., et al., 1999a, A&A 350, 163
- (37) Molster F.J., Yamamura I., Waters L.B.F.M., et al., 1999b, Nature 401, 563
- (38) Monnier J.D., Tuthill P.G., Lopez B., et al., 1999, ApJ, 512, 351
- (39) Moore M.H., 1999, in Solid interstellar matter: the ISO revolution, Les Houches No 11, L. d’Hendecourt, C. Joblin & A. Jones eds., EDP Sciences, Les Ulis, p. 199
- (40) Omont A., Mosely S.H., Forveille T., et al., 1990, ApJ 355, L27
- (41) Pantin E., Waelkens C., Malfait K., 1999, in The Universe as seen by ISO, ESA, SP 427, 385
- (42) Richards A.M.S., Yates J.A., Cohen R.J., 1999, MNRAS, 306, 954
- (43) Roche P.F., Aitken D.A., 1984, MNRAS, 209, 33p
- (44) Schaal R.B., Hörz F., Thompson T.D., Bauer J.F., 1979, Proc. Lunar Planet Sci.Conf., 10, 2547
- (45) Schaeidt S.G., Morris P.W., Salama A., et al., 1996, A&A, 315, L55
- (46) Schmitt B., Quirico E., Trotta F., Grundy W.M., 1998. In: Schmitt B., de Burgh C., Festou M., eds. Solar System Ices, Kluwer, Dordrecht, p. 199
- (47) Schutte W.A., Tielens A.G.G.M., 1989, ApJ, 343, 369
- (48) Sloan G.C., Price S.D., 1998, ApJS, 119, 141
- (49) Smith R.G., Herman J., 1990, A&A, 227, 147
- (50) Smith R.G., Robinson G., Hyland A.R., Carpenter G.L., 1994, MNRAS, 271, 481
- (51) Swinyard B.M., Clegg P.E., Ade P.A.R., et al., 1996, A&A, 315, L43
- (52) Swinyard B.M., Burgdorf M.J., Clegg P.E., et al., 1998, Proc. SPIE Vol. 3354, p. 888-899
- (53) Tielens A.G.G.M., McKee C.F., Seab C.G., Hollenbach D.J., 1994, ApJ, 431, 321
- (54) van der Veen W.E.C.J., Habing H.J., 1988, A&A, 194, 125
- (55) Voors R.H.M., 1999, Ph.D. Thesis, Utrecht University
- (56) Waters L.B.F.M., Waelkens, C., 1998, ARA&A, 36, 233
- (57) Waters L.B.F.M., Molster F.J., 1999, in “Asymptotic Giant Branch Stars, IAU symposium 191”, eds. Le Bertre T., Lèbre A. & Waelkens C., p. 209-219
- (58) Waters L.B.F.M., Molster F.J., de Jong T., et al., 1996, A&A, 315, L361
- (59) Waters L.B.F.M., Molster F.J., Waelkens C., 1999, in Solid interstellar matter - the ISO revolution, Les Houches No 11, L. d’Hendecourt, C. Joblin & A. Jones eds., EDP Sciences, Les Ulis
- (60) Whittet D.C.B., Bode M.F., Longmore A.J., et al., 1988, MNRAS, 233, 321
- (61) Yamamura I., de Jong T., Cami J., 1999, A&A 348, L55