The Large Zenith Telescope: Redshifts and Physical Parameters of Faint Objects from a Principal Component Analysis
Institut d’astrophysique de Paris (CNRS), France
1. The Large Zenith Telescope Survey
The Large Zenith Telescope (LZT) is a 6-m liquid mirror telescope (Hickson 1998; Borra et al. 1992; Cabanac et al. 1998). It is a transient instrument dedicated to a survey of faint objects (Table 1). The final input of the survey will be a catalog giving the photometric fluxes in narrow-band filters (3700Å-1 range), as well as basic morphological information for objects. Here we investigate the potential of the Principal Component Analysis (PCA) to extract meaningful physical parameters from such a large dataset.
| Latitude | |
|---|---|
| Median seeing | |
| Diameter of corrected field | |
| Detector | Thinned 2048 x 2048 CCD |
| Image scale | |
| Integration time | |
| Limiting mag in filter | 24.4 |
| Expected # of stars/galaxies/QSOs | |
| Area covered in one night (8h) |
2. Principal Component Analysis and Mock Catalogs
The application of the PCA to the classification of galaxies is described elsewhere (Murtagh & Heck 1987; Galaz & de Lapparent 1998 and references therein). After a PCA, the spectrophotometric energy distribution (SED) of each object can be approximated as where is the SED, are the eigenvalues, are the eigenvectors. We build realistic mock catalogs of LZT SEDs to a limiting magnitude for stars (number counts and color distribution from the Bahcall-Soneira model, ARAA 1986), galaxies (Fioc & Rocca-Volmerange GISSEL and Bruzual & Charlot PEGASE spectra, luminosity functions by Autofib for , and CFRS luminosity function for ), and QSOs (number counts and counts vs from 2dF QSO Survey).
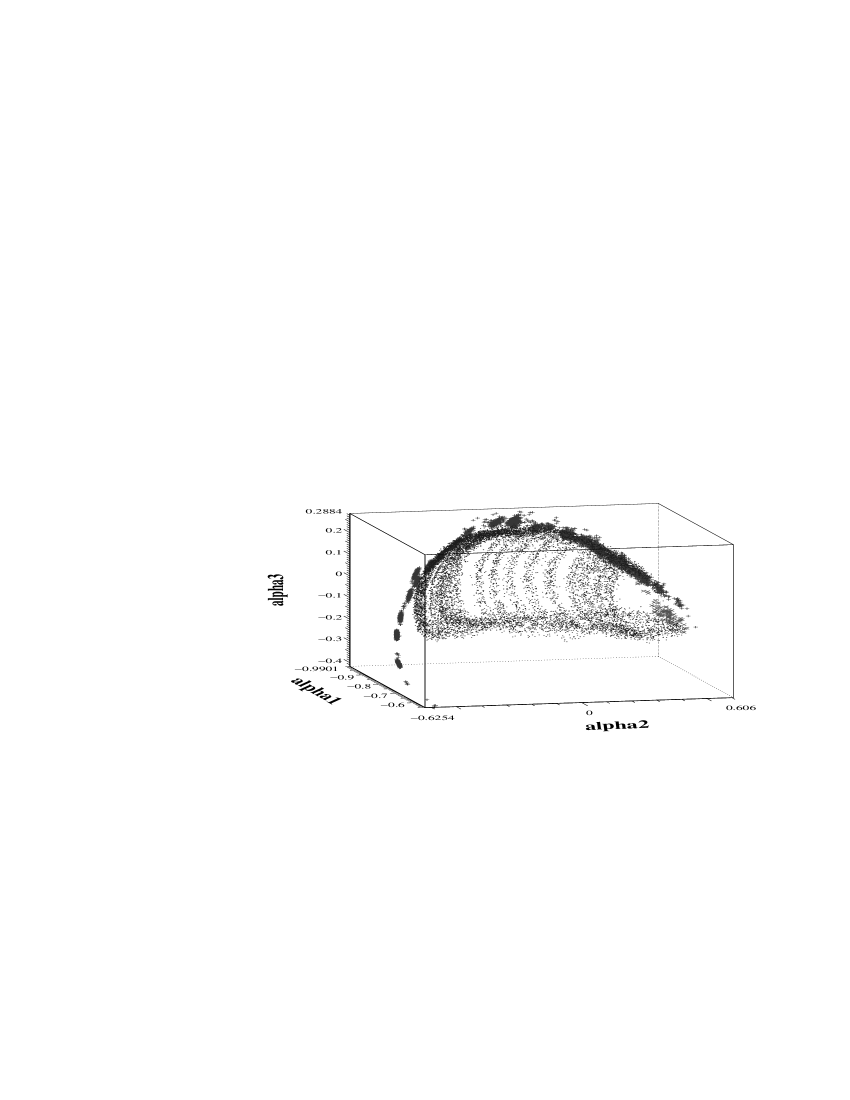
3. Results: morphological discrimination and redshift
(i) Most of the information in the LZT spectral energy distributions is contained in the continua. Only strong emission lines are detected (). (ii) The PCA is robust to discriminate different species at a resolution of , and at low . (iii) Redshifts of galaxies can be derived for . Strong degeneracies occur at higher redshifts between high blue galaxies and local red galaxies because the H & K (Ca II) break exits the observed spectral range.
| (star)2963 | 0.0 | 0.049 | 1082 | 0.7 | 0.013 | 373 | 1.5 | 0.0103 |
|---|---|---|---|---|---|---|---|---|
| 109 | 0.1 | 0.134 | 906 | 0.9 | 0.056 | 234 | 1.7 | 0.222 |
| 567 | 0.3 | 0.015 | 812 | 1.1 | 0.084 | 568 | 1.9 | 0.177 |
| 926 | 0.5 | 0.023 | 568 | 1.3 | 0.053 | (QSO)41 | 2.0-2.5 | 0.0 |
References
Borra, E.F., Content, R., & Girard, L. 1992, ApJ, 393, 829
Cabanac, R.A., Borra E.F., & Beauchemin, M. 1998, ApJ, 509, 309
Murtagh & Heck, 1987, Multivariate Data Analysis (Dordrecht: Reidel)
Hickson, P., et al. 1998, Proc. SPIE, 3356, Kona
Galaz, G., & de Lapparent, V. 1998, A&A, 332, 459