The Scatter in the Relationship between Redshift and the Radio-to-Submm Spectral Index
Abstract
We derive the scatter in the relationship between redshift and radio-to-submm spectral index, , using the observed spectral energy distributions of 17 low redshift star forming galaxies. A mean galaxy model is derived, along with the rms scatter in . The scatter is roughly constant with redshift. Constant rms scatter, combined with the flattening of the mean – relationship with increasing redshift, leads to increasing uncertainty for redshift estimates at high redshifts. Normalizing by the dust temperature in the manner proposed by Blain decreases the scatter in for most of the sample, but does not remove outliers, and free-free absorption at rest frequencies above 1.4 GHz is not likely to be a dominant cause for scatter in the – relationship. We re-derive the cumulative redshift distribution of the 14 field galaxies in a recent submm and radio source sample of Smail et al.. The most likely median redshift for the distribution is 2.7, with a conservative lower limit of , as was also found by Smail et al. based on the original – models. The normalization and shape of the redshift distribution for the faint submm sources are consistent with those expected for forming elliptical galaxies.
1 Introduction
The sharp rise of observed flux density, , with increasing frequency, , in the Rayleigh-Jeans portion of the grey-body spectrum for thermal dust emission from star forming galaxies (), leads to a dramatic negative -correction for observed flux density with increasing redshift. Submm surveys thereby provide a uniquely distance independent sample of objects in the universe, meaning the observed submm flux density of an object of given intrinsic luminosity is roughly constant for between 1 and 7 (Blain & Longair 1993, Hughes & Dunlop 1998). Sensitive observations at submm wavelengths are revealing what may be a population of active star forming galaxies at high redshift which are unseen in deep optical surveys due to dust obscuration (Smail, Ivison, and Blain 1997, Barger et al. 1998, Hughes et al. 1998, Barger et al. 1999a, Blain et al. 1999a, Eales et al. 1999, Bertoldi et al. 1999). Current models suggest that this population may represent the formation of elliptical galaxies and galactic bulges at between 2 and 5, constituting about half of the total amount of cosmic star formation from the big bang to the present (Barger et al. 1999b, 1999c, Tan, Silk, & Balland 1999, Blain et al. 1999b, Trentham, Blain, and Goldader 1999, Lilly et al. 1999, Smail et al. 1999c).
The faint submm source counts suggest that a significant revision is needed to the optically derived star formation history of the universe (Steidel et al. 1999), with the addition of a population of highly reddened active star forming galaxies not seen in deep optical surveys (Chapman et al. 1999). However, this conclusion hinges on the currently unknown redshift distribution of the faint submm sources. Follow-up observations have shown that most faint submm sources are associated with very faint optical () and near IR () sources (Smail et al. 1999a), in which case obtaining reliable optical redshifts is difficult. Moreover, at these faint levels confusion in optical fields can be severe. At the limit of the Hubble Deep Field one expects about 5 sources in a typical faint submm source error circle of 3′′ radius (Blain et al. 1999c, Downes et al. 1999, Hughes et al. 1998). For comparison, the probability of detecting a radio source with in this same region is 0.04 (Richards 1999). Even crude estimates of source redshifts that do not rely on identification of the sources in the optical or near IR are fundamental to our understanding of the faint submm source population.
We recently proposed the technique of using the radio-to-submm spectral index as a redshift indicator (Carilli and Yun 1999). This technique is based on the universal radio-to-far infrared (FIR) correlation for star forming galaxies (Condon 1992), with the extrapolation that the spectral shapes may be similar enough to be able to differentiate between low and high redshift objects. Even a gross indication of the source redshift distribution provides critical constraints on models of the star formation history of the universe using submm source counts (Blain et al. 1999b). Carilli and Yun (1999) presented empirical models for the relationship between and the observed spectral index between 1.4 and 350 GHz, , based on the spectral energy distributions (SEDs) of Arp 220 and M82, plus semi-analytic models based on the equations in Condon (1992), assuming a dust spectrum comparable to that of M82 (Güsten et al. 1992). We found that these simple models were in reasonable agreement with the few spectroscopically measured redshifts for high submm sources, and we discussed possible reasons for departure of sources from this relationship, including the presence of a radio loud AGN, and cooling of the synchrotron emitting relativistic electrons due to inverse Compton scattering off the microwave background radiation. A subsequent paper by Blain (1999) showed that very low dust temperatures () can also lead to departures from the standard relations.
In this paper we take a complimentary, empirical, approach to the analytic approach of Blain (1999), by looking at the mean and scatter in the – relation using the observed SEDs of 17 low star forming galaxies. Note that Blain (1999) considered the logarithm of the flux density ratio between observed frequencies of 350 and 1.4 GHz while we use the spectral index. These quantities are simply related by a scale factor: log[] = 2.4. We use = 75 km s-1 Mpc-1 and qo = 0.5.
2 Analysis
2.1 Scatter in the – Relation
Most of the galaxies in our study come from the recent submm study of Lisenfeld, Isaak, & Hills (1999), which is a subsample of bright IRAS galaxies observed in CO(1–0) by Sanders, Scoville, & Soifer (1991). Lisenfeld et al. detected 14 of 19 galaxies at 350 GHz using SCUBA on the JCMT. As discussed in Lisenfeld et al., these galaxies span a wide range in IR luminosity, from luminous (), to ultraluminous (), and in infrared-to-blue luminosity ratio, and should be representative of the star forming galaxy population, although the fact that these are IRAS selected galaxies could lead to a bias toward warm dust. We have augmented this sample with three other star forming galaxies with well sampled SEDs from 1.4 GHz to 25000 GHz (M82, IRAS 051892524, and UGC 5101). The sources are listed in column 1 of Table 1.
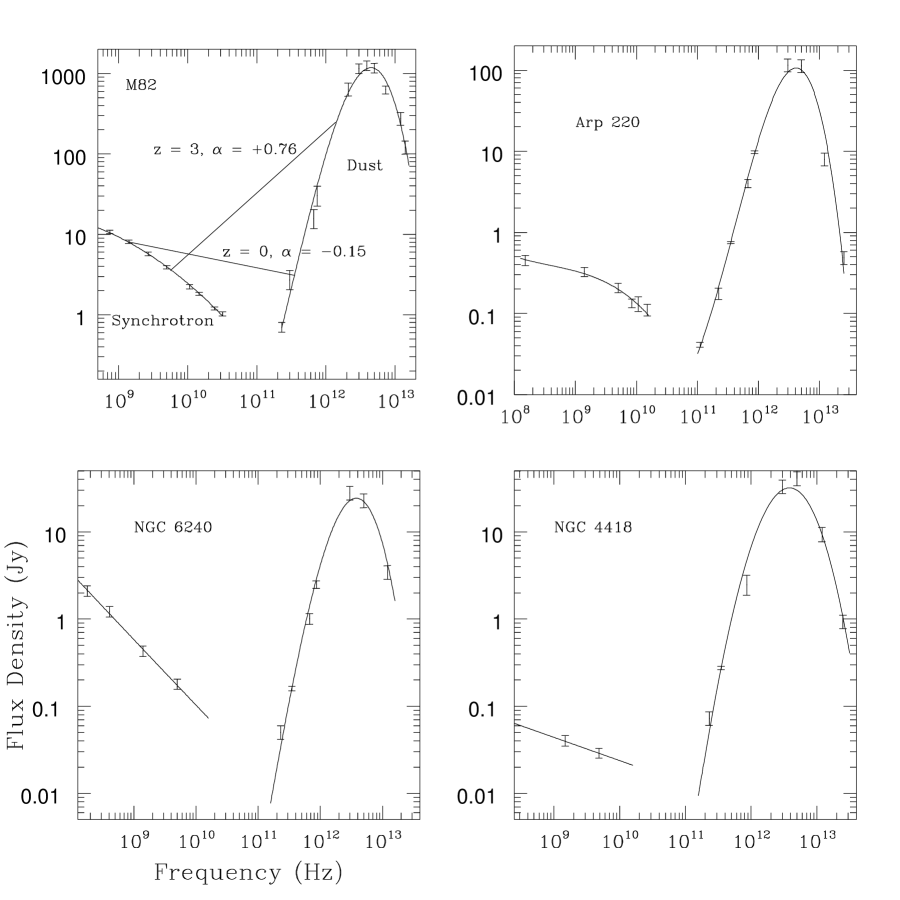
The process of deriving the redshift evolution of entails fitting accurate polynomials to the observed SEDs at cm through IR wavelengths, then using these polynomials to predict the change in with redshift (Carilli and Yun 1999). Examples of the SEDs, plus polynomial fits, for four of the galaxies are shown in Figure 1. The fitting process is required to interpolate the discretely sampled data points to unsampled spectral regions. As with any interpolation process, errors will occur in unsampled regions, and the errors will increase as the sampling decreases. This is particularly true for the six sources in the sample with only one mm or submm measurement (NGC 3110, 5135, 5256, 5653, 5936, Zw049). Such errors are difficult to quantify. We have performed the analysis excluding these sources, and find no substantial changes in the results.
Table 1 lists the spectral index between 0.33 and 1.4 GHz (column 2), 1.4 and 5 GHz (column 3), and 350 GHz and 1.4 GHz (column 4), the FIR luminosities (column 5), and the radio-to-FIR ratio (column 6), as quantified in the parameter defined by Condon (1992): log [], where is the flux density at 1.4 GHz in Jy, and and are the flux densities at 60m and 100 m, in Jy, respectively. The sources are ordered in decreasing FIR luminosity. Condon (1992) has found for a large sample of nearby spiral galaxies a mean value of = 2.3 with an rms scatter of 0.2. The galaxies in our sample generally fall within 2 of this value.
The values for have a mean 0, and an rms scatter () of 0.14. Using the polynomial fits to the radio-to-IR SEDs, we have derived the evolution of with redshift for all 17 sources in Table 1. The results are shown in Figure 2. The solid curves show the distributions for sources with L L⊙, while the dash curves show the distributions for sources with L L⊙. The high luminosity sources have, on average, lower values of than the low luminosity sources. The mean value of varies from at to +0.97 at for the high luminosity sources, while the corresponding values for the low luminosity sources are and +1.18, respectively. Confirmation of this trend of with FIR luminosity requires significantly larger galaxy samples with well observed radio-to-IR SEDs.
We derive the mean and rms scatter of as a function of redshift using the curves in Figure 2 for all 17 sources. This mean-galaxy model is shown as the solid curve in Figure 3, while the dotted curves delineate the range, as determined from scatter in the distribution of sources. We designate these curves: , , and , respectively. For a normal distribution, the range implies that 67 of the sources in a given sample would fall within the range set by the dotted curves in Figure 3. The rms scatter is roughly constant with redshift, decreasing from 0.14 at to 0.12 at . Constant scatter in , combined with the flattening of with increasing , implies that the uncertainty in redshift estimates based on measured values of increases with . Table 2 lists the mean, (column 3), and 1 error ranges, and (columns 2 and 4), for likely redshifts given a measured value of (column 1).
We find that the mean galaxy model, , can be reasonably parameterized by a forth order polynomial: , with a maximum deviation, , between the polynomial fit and the mean galaxy model of . For values of , only a likely lower limit to a source redshift can be derived. The dashed curve in Figure 3 is the – relationship derived for Arp 220, which has been used as a representative template for the – relationship by Barger, Cowie, & Richards (1999d).
The data points in Figure 3 are for observed submm sources with measured spectroscopic redshifts, as summarized in Carilli & Yun (1999). This includes a number of sources with AGN-type spectra, as discussed in detail in Yun et al. (1999). The sources H 1413+117 and BR 09520115 are shown to demonstrate how the presence of a radio-loud AGN affects the position of a source on this diagram. Carilli & Yun (1999) point out that, given a source redshift, this diagram can be used to search for evidence for a radio-loud AGN.
2.2 Effects of Dust Temperature
Blain (1999) has hypothesized that dust temperature may have an important impact on the scatter in the – relationship, leading to a degeneracy between high redshift, hot dust sources, and low redshift, cold dust sources. He showed that this effect can be mitigated by considering the quantity . In Figure 4 we plot the values against , using dust temperatures from Lisenfeld et al. (1999), Güsten et al. (1992), and Rigopoulou et al. (1996), with TD normalized to the mean dust temperature of 39 K for the sample. Again, the solid lines are for high luminosity sources, while the dash lines are for low luminosity sources.
If we consider all the sources the rms is dominated by two sources, NGC 4418 and Mrk 231, and the rms scatter of at a given value of has not decreased significantly from that in Figure 2 (). However, if we remove the two outliers we find a significant decrease in the rms values, from 0.11 for the distribution in Figure 2, to 0.075 for the distribution in Figure 4, and the rms is roughly constant with .
2.3 Variations in Radio Properties
The radio spectral indices from 330 MHz through 5 GHz for the sources listed in Table 1 show a large scatter, from –0.2 to –0.9. The canonical value for synchrotron emission from star forming galaxies is –0.8 (Condon 1992). Causes for flatter spectra include: (i) free-free absorption at low frequencies, (ii) free-free emission at high frequencies, or (iii) a synchrotron self-absorbed AGN component. Herein we examine the possible contribution of free-free absorption to the observed values of .
We compare the observed spectral indices between 1.4 and 5 GHz to those between 0.33 and 1.4 GHz (columns 2 and 3 in Table 1). No evidence for systematic flattening of the spectra with increasing star forming activity is found for the majority of the galaxies, as would occur due to free-free absorption. However, the presence of a patchy absorbing medium could lead to complicated spectral shapes, and this alone is not a sufficient reason to rule out the importance of free-free absorption.
One method used by Condon et al. (1991) to investigate the possibility of free-free absorption at 1.4 GHz was to correct the radio spectra by assuming a constant radio spectral index of 0.8 and normalizing to the observed flux densities at 5 GHz. This analysis will mitigate free-free absorption effects at least out to (). We have investigated this possibility for the galaxies in our sample with 5 GHz detections. We find that the rms scatter at low redshift decreases only marginally, from 0.14 to 0.12. Given these results, and the fact that free-free opacity decreases quadratically with increasing frequency, we conclude that free-free absorption for rest frequencies above 1.4 GHz is not likely to be a dominant cause of scatter in the – relationship. Multifrequency, high resolution radio imaging of a large sample of star forming galaxies is required to properly address this issue.
2.4 The Redshift Distribution of Faint Submm Sources
Smail et al. (1999b) have discussed using a statistical distribution for source redshifts to provide constraints on models of the star formation history of the universe using submm source counts. Based on the original Carilli & Yun (1999) and Blain (1999) models for the – relationship, they concluded that the median redshift for their faint submm sources is likely to be between 2.5 and 3, with a conservative lower limit of about 2.
We have repeated the cumulative redshift distribution analysis of Smail et al. (1999b) using the values of for the 14 field galaxies in their Table 1, plus our new – model. The results are shown in Figure 5. Note that for 7 of these galaxies only lower limits to are available, which leads to lower limits to the possible redshifts. We have performed the analysis using both and curves, as shown in Figure 3. The model leads to a conservative lower limit to the median redshift of the sources of 2.05, while the model leads to a median redshift of 2.68. These results strengthen the primary conclusions of Smail et al. (1999b) that the majority of the faint submm sources are likely to be at , and that there is no prominent low-z tail in the distribution.
There are three field galaxies in Table 1 of Smail et al. (1999b) with reliable spectroscopic redshifts. For two of the sources, SMMJ14011+0252 at and SMMJ023990134 at , the redshifts predicted by the mean galaxy model in Figure 3 are remarkably close to the spectroscopic values, = 2.53 and 1.10, respectively. For the source SMMJ023990136 the mean galaxy model predicts a redshift of 1.65, which is well below the spectroscopic redshift of 2.80. This may indicate the presence of a radio-loud AGN in this source, and the source has been shown to contain an optical AGN, and possibly an extended radio jet source (Ivison et al. 1998). On the other hand, the source is not far beyond the limit of predicted by the model in Figure 3.
For comparative illustration, the dotted line in Figure 5 shows the expected fraction of uncollapsed 1012 M⊙ structures derived using the standard CDM Press-Schechter formalism with a bias factor 2 (Peebles 1993). There is an interesting, perhaps fortuitous, similarity between the observed redshift distribution for the formation of structures of this mass, comparable to elliptical galaxies, and the redshift distribution of the faint submm sources. In particular, structures of this mass first separate from the general expansion of the universe and collapse under their own self-gravity at , and are mostly in-place by (Kaiser and Cole 1989).
3 Discussion
We have derived the mean and rms scatter for redshift estimates based on the – relationship from a sample of 17 low star forming galaxies with well sampled cm to infrared SEDs. We emphasize that this analysis should be treated as strictly statistical. Given the rms scatter in , and the shallow slope of the – relationship at high redshift, the uncertainty in the redshift for any individual source is large. However, for a large sample of sources, and assuming a normal error distribution, one can say that 67 of the sources are within the 1 curves in Figure 3, and that 84 of the sources are at redshifts higher than the +1 curve in Figure 3. We have repeated the analysis using the median values plus inner quartile ranges, and reach essentially the same conclusions, although the outliers tend to increase the error range when considering rms deviations.
Applying the mean-galaxy model to the sample of Smail et al. (1999b), we find that 80 of the sources are likely to be between and 4. Blain et al. (1999a) have derived a cumulative source surface density of 2.2 sources arcmin-2 for source with flux densities 1 mJy at 350 GHz, after correcting for magnification by gravitational lensing. The implied comoving number density is then Mpc-3. These sources correspond to star forming galaxies with FIR luminosities comparable to, or larger than, that of Arp 220. The comoving space density of these high sources is a factor 103 larger than that of low ultraluminous infrared galaxies (Sanders and Mirabel 1996), and is comparable to that of low elliptical galaxies (Lilly et al. 1999, Cowie and Barger 1999). Hence the normalization, and shape of the redshift distribution (see Figure 5), for the faint submm sources are consistent with those expected for forming elliptical galaxies (Tan et al. 1999).
The upper-most curve in Figures 2 and 4 is the distribution for NGC 4418, while the lowest curve is for Mrk 231. Mrk 231 is well known to contain a radio-loud AGN, although there is also evidence for radio emission from a starburst disk (Downes and Solomon 1998, Carilli, Wrobel, & Ulvestad 1999a, Taylor et al. 1999). Below 1.4 GHz the spectrum appears to be dominated by a possible star forming disk seen on sub-kpc scales, while above 1.4 GHz the pc-scale AGN component raises the total flux density by about a factor 2 (Taylor et al. 1999). In fairness to high samples, for which such detailed imaging information is not available, we have made no attempt to remove the AGN emission for Mrk 231 in the mean galaxy model shown in Figure 3. The relatively flat radio spectrum of NGC 4418 () may indicate that the source is partially free-free absorbed, thereby leading to the source appearing radio-quiet with respect to most low star forming galaxies. Also, Lisenfeld et al. (1999) have pointed out that the dust spectrum of NGC 4418 is anomalous relative to the rest of their sample, with a low value of and a high dust temperature, leading to the unusual distribution for the source in the temperature-corrected curves shown in Figure 4. Lisenfeld et al. suggest that such an anomalous dust spectrum may be due to significant dust opacity at submm wavelengths. Whether such optical depth effects (free-free absorption at cm wavelengths, and dust opacity at submm wavelengths) are important for a significant fraction of high redshift sources remains to be determined.
We have found that the scatter in decreases by about 30 when the dust temperature is also included in the analysis, as predicted by Blain (1999), with the exception of the two anomalous sources discussed above. Unfortunately, even after correcting for dust temperature, the allowed range in redshift for a given value of is large, eg. for = 0.8 and TD = 39 K the 1 redshift range is: 1.9 2.9, further emphasizing that the – relationship should be used statistically, and not be considered an accurate measure of an individual source’s redshift. A further complication is that accurate determination of TD requires sensitive observations be made at a number of mm and submm wavelengths.
Implicit in the analysis of section 2 is the assumption that there is not a systematic change in the intrinsic SEDs for star forming galaxies with redshift, as might occur due to cooling of the synchrotron emitting relativistic electrons due to inverse Compton scattering off the microwave background radiation at high , or due to a systematic change in ISM magnetic fields in high galaxies. Such a variation can only be tested with extensive observations at cm through submm wavelengths of a large sample of high star forming galaxies with known redshifts – a task which remains problematic at the present. The sparse data that currently exists appear to be consistent with the derived models based on low galaxies.
A massive star forming galaxy with a star formation rate of a few hundred M⊙ year-1 at has a submm flux density of a few mJy at 350 GHz, and a radio flux density Jy at 1.4 GHz (Carilli & Yun 1999, Cowie & Barger 1999). Such flux levels are currently accessible with long integrations using existing bolometer arrays on mm and submm telescopes, and using the Very Large Array (VLA). In some studies magnification by cluster gravitational lensing has been used to improve the effective senstivities by a factor of 2 or so (Smail et al. 1997). Future instrumentation, such as the Atacama Large Millimeter Array, and the upgraded VLA, should be able to detect high galaxies with star formation rates of order 10 M⊙ year-1. Moreover, the very wide bandwidths ( 8 GHz) available on these future instruments will allow for searches for CO emission over large redshift ranges in reasonable integration times, thereby by-passing the requirement of optical spectroscopy for accurate redshift determinations.
We would like to thank the referee, I. Smail, and R. Ivison, A. Blain F. Owen, F. Bertoldi, and K. Menten, for useful comments and discussions. C.C. acknowledges support from the Alexander von Humboldt Society. The National Radio Astronomy Observatory is operated by Associated Universities, Inc., under a cooperative agreement with the National Science Foundation. This research made use of the NASA/IPAC Extragalactic Data Base (NED) which is operated by the Jet propulsion Lab, Caltech, under contract with NASA.
References
- (1)
- (2) Barger, A.J., Cowie, L.L., Smail, I., Ivison, R., Blain, A., and Kneib, P.-J. 1999a, AJ, 117, 2656
- (3)
- (4) Barger, A.J., Cowie, L.L., Trentham, N., Fulton, E., Hu, E. M., Songaila, A., Hall, D. 1999b, AJ, 117, 102
- (5)
- (6) Barger, A.J., Cowie, L.L., and Sanders, D.B. 1999c, ApJ (letters), 518, 5
- (7)
- (8) Barger, A.J., Cowie, L.L., and Richards, E.A. 1999d, in the Proceedings of OCIW Workshop on Photometric Redshifts, (astro-ph/9907022)
- (9)
- (10) Barger, A.J. et al. Nature, 394, 248
- (11)
- (12) Benford, D. 1999, PhD thesis, California Institute of Technology
- (13)
- (14) Bertoldi, F. et al. 1999, A&A (letters), in preparation
- (15)
- (16) Blain, A.W., & Longair, M.S. 1993, MNRAS, 264, 509
- (17)
- (18) Blain, A., Kneib, J.-P., Ivison, R.J. and Smail, I. 1999a, ApJ (letters), 512, 87
- (19)
- (20) Blain, A., Smail, I., Ivison, R.J., and Kneib, J.-P. 1999b, MNRAS, 302, 632
- (21)
- (22) Blain, A. 1999, MNRAS, in press (astro-ph/9906438)
- (23)
- (24) Blain, A., Smail, I., Ivison, R.J., and Kneib, J.-P. 1999, in The Hy-Redshift Universe, eds. A. Bunker and W. van Breugel, (San Francisco: ASP)
- (25)
- (26) Carilli, C.L., Menten, K.M. & Yun, M. S. 1999b, ApJ (letters), 521, 25
- (27)
- (28) Carilli, C. L. & Yun, M. S. 1999, ApJ (letters), 513, 13
- (29)
- (30) Carilli, C.L., Wrobel, J., and Ulvestad, J. 1999a, AJ, 115, 928
- (31)
- (32) Chapman, S.C. et al. 1999, MNRAS, submitted (astroph 9909092)
- (33)
- (34) Cowie, L.L. and Barger, A.J. 1999, in The Hy-Redshift Universe, eds. Andrew J. Bunker & Wil J. M. van Breughel, (San Francisco: ASP)
- (35)
- (36) Condon, J. J., Huang, Z.-P., Yin, Q.F., and Thuan, T.X. 1991, ApJ, 378, 65
- (37)
- (38) Condon, J. J. 1992, ARAA, 30, 575
- (39)
- (40) Condon, J. J., Cotton, W. D., Greisen, E. W., Yin, Q. F., Perley, R. A. et al. 1998, AJ, 115, 1693
- (41)
- (42) Downes, D. et al. 1999, A&A, 347, 809
- (43)
- (44) Downes, D. and Solomon, P. 1998, ApJ, 507, 615
- (45)
- (46) Eales, S., et al. 1999, ApJ, 515, 518
- (47)
- (48) Güsten, R., Serabyn, E., Kasemann, C., Schinckel, A., Schneider, G., Schulz, A., & Young, K. 1993, ApJ, 402, 537
- (49)
- (50) Genzel, R. 1998, ApJ, 498, 579
- (51)
- (52) Hughes, D. et al. 1998, Nature, 394, 341
- (53)
- (54) Hughes, D. and Dunlop, J. 1998, in Highly Redshifted Radio Lines, eds. C.Carilli, S. Radford, K.Menten, and G. Langston, (San Francisco: ASP)
- (55)
- (56) Ivison R.J., et al. 1998, MNRAS, 298, 583
- (57)
- (58) Kaiser, N. and Cole, S. 1989, in The Epoch of Galaxy Formation, eds. C. Frenk et al., (Dordrecht: Kluwer), p. 243
- (59)
- (60) Lisenfeld, U., Isaak, K.G., and Hills, R. 1999, MNRAS, in press (astro-ph/9907035)
- (61)
- (62) Lilly, S. et al. 1999, ApJ, 518, 641
- (63)
- (64) Peebles, P.J.E. 1993, Princeiples of Physical Cosmology, (Princton University Press)
- (65)
- (66) Rengelink, R.B. et al. 1997, A&A (supp), 124, 259
- (67)
- (68) Rigopoulou, D. Lawrence, A., Rowan-Robinson, M. 1996, MNRAS, 278, 1049
- (69)
- (70) Richards, E. 1999, ApJ, in press
- (71)
- (72) Sanders, D., Scoville, N., and Soifer, B. 1991, ApJ, 370, 158
- (73)
- (74) Sanders, D.B. and Mirabel, I.F. 1996, ARAA, 34, 749
- (75)
- (76) Smail, I., Ivison, R., and Blain, A. 1997, ApJ (letters), 490, 5
- (77)
- (78) Smail, I., Ivision, R., Kneib, J.-P., Cowie, L.L., Blain, A. W. et al. 1999a, MNRAS, in press (astro-ph/9905246)
- (79)
- (80) Smail, I., Ivison, R., Owen, F., Blain, A., and Kneib, J.-P., 1999b, ApJ (letters), submitted
- (81)
- (82) Smail, I., Ivison, R., Blain, A., and Kneib, J.-P., 1999c, in The Universe in Three Dimensions, eds. W. van Breugel and J. Bland-Hawthorn, (San Francisco: ASP)
- (83)
- (84) Steidel,C., Adelberger,K., Giavalisco,M., Dickinson,M., and Pettinin,M. 1999, ApJ, 519,1
- (85)
- (86) Tan, J.C., Silk, J., & Balland, C. 1999, ApJ, 522, 579
- (87)
- (88) Taylor, G.B., Silver, C.S., Ulvestad, J.S., and Carilli, C.L. 1999, ApJ, 519, 185
- (89)
- (90) Trentham, N., Blain, A., and Goldader, J. 1999, MNRAS, 305, 61
- (91)
- (92) Ulvestad, J.S., Wrobel, J.M., and Carilli, C.L., 1999, ApJ, 516, 127
- (93)
- (94) Yun, M.S., Carilli, C.L., Kawabe, R., Tutui, Y., Kohno, K. & Ohta, K. 1999, ApJ, in press
- (95)
- (96) Yun, M.S., Reddy, N., & Condon, J.J. 1999, in preparation
- (97)
| Source | LFIR | ||||
|---|---|---|---|---|---|
| Mrk 231 | –0.48 | +0.30 | –0.16 | 23 | 2.12 |
| Arp 220 | –0.15 | –0.37 | +0.15 | 16 | 2.62 |
| Mrk 273 | –0.49 | –0.27 | –0.07 | 13 | 2.26 |
| UGC 5101 | –0.69 | –0.56 | –0.06 | 10 | 2.07 |
| NGC 6240 | –0.82 | –0.70 | –0.18 | 6.3 | 1.83 |
| Arp 193 | –0.54 | –0.52 | –0.01 | 4.3 | 2.33 |
| NGC 1614 | – | –0.54 | –0.03 | 3.6 | 2.50 |
| NGC 5256 | –0.79 | –0.67 | –0.09 | 2.8 | 1.95 |
| NGC 5135 | –0.73 | –0.50 | –0.07 | 1.7 | 2.08 |
| NGC 3110 | –0.65 | –0.79 | –0.01 | 1.6 | 2.16 |
| NGC 4418 | –0.27 | –0.26 | +0.35 | 0.88 | 3.06 |
| NGC 5653 | –0.79 | –0.78 | +0.05 | 0.84 | 2.38 |
| NGC 5936 | – | –0.89 | –0.14 | 0.82 | 1.95 |
| NGC 4194 | –0.56 | –0.77 | +0.00 | 0.69 | 2.43 |
| M 82 | –0.34 | –0.61 | –0.11 | 0.48 | 2.20 |
| IRAS 05189-2524 | – | –0.50 | 0.18 | 10 | 2.76 |
| Zw 049 | – | –0.70 | –0.17 | 0.14 | 1.81 |
| 0.0 | 0 | 0 | 0.21 |
| 0.1 | 0 | 0.14 | 0.40 |
| 0.2 | 0.08 | 0.31 | 0.58 |
| 0.3 | 0.23 | 0.49 | 0.81 |
| 0.4 | 0.40 | 0.71 | 1.08 |
| 0.5 | 0.60 | 0.96 | 1.42 |
| 0.6 | 0.83 | 1.27 | 1.86 |
| 0.7 | 1.12 | 1.65 | 2.45 |
| 0.8 | 1.47 | 2.18 | 3.29 |
| 0.9 | 1.93 | 2.95 | 4.44 |
| 1.0 | 2.60 | 4.03 | 6.60 |
| 1.1 | 3.63 | 6.04 |


Erratum for:
The Scatter in the Relationship between Redshift and
the Radio-to-Submm Spectral Index
The 350 GHz flux densities of 4 of the 17 galaxies used in Carilli & Yun (2000) were found to be low by a factor 1.5 to 2 due to missing extended emission in the original Lisenfeld et al. (2000) sample. These values were subsequently up-dated by Lisenfeld et al. after our paper went into press. We have corrected these values using the revised Lisenfeld et al. data, which agree (within the errors) with the data presented in Dunne, Clements, & Eales (2000). In addition, two of the radio flux densities have been adjusted to correct for confusing sources.
In this erratum we present a revised table, plus the revised model for the relationship between redshift, , and observed spectral index between 1.4 GHz and 350 GHz (Figure 6 below, Figure 3 in Carilli & Yun (2000)). The main change in the model has been an increase in by about 0.04 at all redshifts (eg. from 0 to 0.04 at , and from 1.10 to 1.14 at ). The rms scatter in remains roughly constant with redshift, ranging from 0.17 at , to 0.14 at . The changes in the model are insufficient to change the basic conclusions in Carilli & Yun (2000).
In the revised figure we include the recent – model from Dunne et al. (2000), based on 104 low redshift galaxies. The scatter in the Dunne et al. model is about 0.10 in . While there is substantial overlap between the scatter ranges defined by the two distributions, the Dunne et al. model predicts systematically higher values of at a given redshift. For instance, at the Dunne et al. model predicts = 0.180.10, while the 17 galaxy model in Figure 6 predicts = 0.040.17. This difference was pointed out by Dunne et al., based on the model in Figure 3 in Carilli & Yun (2000). They suggested that much of the difference might be due to the low submm flux densities used for a few of the sources in the original model. The revised 17 galaxy model presented herein shows that about 30 of the difference can be explained by the errant data. If we also remove the two galaxies with evidence for a radio AGN (Mrk 231 and NGC 6240), the value of rises to 0.08. The remaining difference could be due to the fact that most of the sources in our 17 galaxy sample are in the upper half of the luminosity distribution delineated by the 104 galaxies used by Dunne et al. (ie. L1.4GHz W Hz-1). Figure 3 in Dunne et al. shows a systematic decrease in with increasing radio luminosity (a fact also pointed out in Carilli & Yun 2000), from about +0.3 for galaxies with radio spectral luminosities at 1.4 GHz of about W Hz-1, to +0.05 for galaxies with radio luminosities of W Hz-1. On the other hand, the remaining difference is well within the scatters of the two distributions, and could simply be due to limited statistics.
References
Dunne, L., Clements, D., and Eales, S. 2000, MNRAS, in press (astro-ph/0002436)
Carilli, C.L. and Yun, M.S. 2000, ApJ, 530, 618
Lisenfeld, U., Isaak, K.,G., and Hills, R. 2000, MNRAS (letters), 312, 433
| Source | LFIR | L | ||||
|---|---|---|---|---|---|---|
| L⊙ | W Hz-1 | |||||
| Mrk 231 | –0.48 | +0.30 | –0.16 | 23 | 10.0 | 2.12 |
| Arp 220 | –0.15 | –0.37 | +0.15 | 16 | 2.0 | 2.62 |
| Mrk 273 | –0.49 | –0.27 | –0.07 | 13 | 4.0 | 2.26 |
| UGC 5101 | –0.69 | –0.56 | –0.06 | 10 | 4.8 | 2.07 |
| IRAS 05189-2524 | – | –0.50 | +0.18 | 10 | 1.0 | 2.76 |
| NGC 6240 | –0.82 | –0.70 | –0.18 | 6.3 | 5.0 | 1.83 |
| Arp 193 | –0.54 | –0.52 | –0.01 | 4.3 | 1.0 | 2.33 |
| NGC 1614 | – | –0.54 | +0.10 | 3.6 | 0.61 | 2.50 |
| NGC 5256 | –0.79 | –0.67 | –0.09 | 2.8 | 1.7 | 1.95 |
| NGC 5135 | –0.73 | –0.50 | –0.07 | 1.7 | 0.73 | 2.08 |
| Zw 049 | – | – | +0.24 | 1.7 | 0.18 | 2.71 |
| NGC 3110 | –0.65 | –0.79 | +0.10 | 1.6 | 0.62 | 2.16 |
| NGC 4418 | –0.27 | –0.26 | +0.35 | 0.88 | 0.04 | 3.06 |
| NGC 5653 | –0.79 | –0.78 | +0.20 | 0.84 | 0.19 | 2.38 |
| NGC 5936 | – | – | +0.20 | 0.82 | 0.16 | 2.40 |
| NGC 4194 | –0.56 | –0.77 | +0.00 | 0.69 | 0.14 | 2.43 |
| M 82 | –0.34 | –0.61 | –0.11 | 0.48 | 0.09 | 2.20 |
