OLD ISOLATED NEUTRON STARS
SERGEI B. POPOV
Sternberg Astronomical Institute, Moscow
polar@xray.sai.msu.su polar@sai.msu.ru
Abstract
In this poster I briefly review several articles
on astrophysics of old isolated neutron stars,
which were published in 1994-99 by my co-authors and myself.
Acknowledgments
I want to thank all my co-authors: prof. V.M. Lipunov, dr. M.E. Prokhorov, prof. M. Colpi, dr. D. Yu. Konenkov, prof. A. Treves, dr. R. Turolla.
Simple Model Of Accretion Onto Isolated Neutron Star With
Synchrotron Cooling
Popov S.B., Astron. Circ. N1556 pp. 1-2, 1994
Here I modeled accretion onto an isolated neutron star (INS) from the interstellar medium in the case of spherical symmetry for different values of the magnetic field strength, ambient gas density and NS’s mass. I tried to verify the idea that if the radius of corotation, , is less than the Alfven radius, , the shell will form around the INS and will decrease to , and the periodic X-ray source will appear (see Treves et al., 1993 A&A 269, 319).
Dependence of on in our model roughly coincides with the analytic formula from Treves et al. (1993): (for some values was decreasing faster).
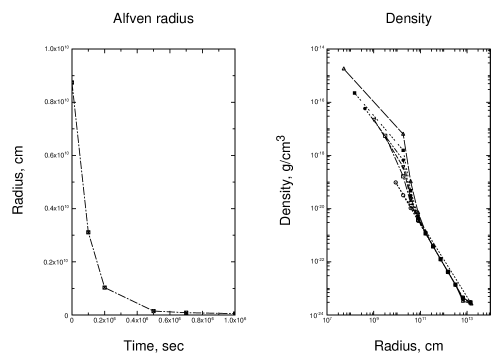
On the figure I show the growth of the envelope density (curves on the figure are plotted for different moments of time: higher density corresponds to later moments of time) and the decreasing of the Alfven radius with time.
Periodic sources with from several minutes to several months can appear.
Spin and its evolution for isolated neutron stars: the Spindown
theorem
Lipunov V.M. & Popov S.B., AZh 72, N5, pp. 711-716, 1995
(astro-ph/9609185)
A possible scenario of spin evolution of isolated neutrons stars is considered.
The new points of our consideration are (all points, including the Spindown theorem, are formulated for constant field!):
–we give additional arguments for the relatively short time scale of the Ejector stage ( yrs for small velocities of NSs).
–we propose specific SPINDOWN THEOREM and give some arguments for its validity. This theorem argues, that the Propeller stage is always shorter than the Ejector stage (for constant magnetic field).
–we consider evolution of spin period of a NS on the Accretor stage and predict that its period without field decay is sec and INSs can be observed as pulsating X–ray sources.
–we consider new idea of stochastic acceleration of very old NSs due to accretion of turbulizated ISM. A specific equilibrium period can be reached.
– accreting INSs can be spin-up and spin-down with equal probability.
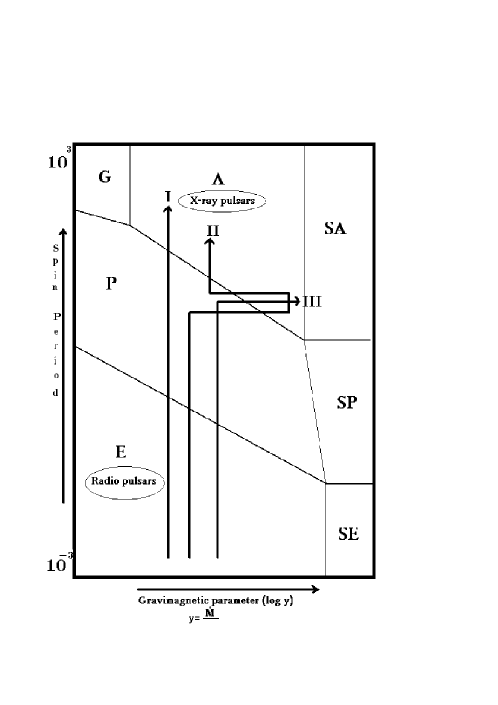
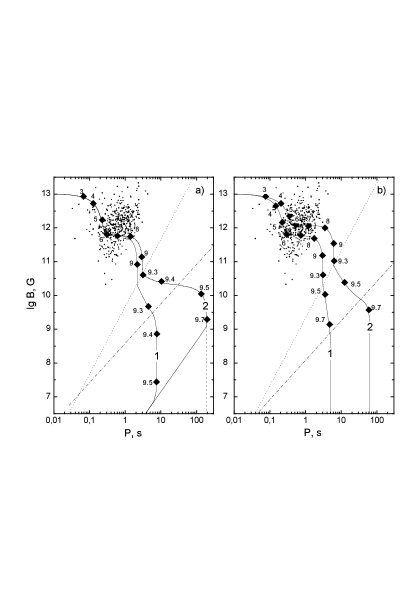
The figure illustrates magneto-rotational evolution of an isolated neutron star on diagram. Gravimagnetic parameter: .
RX J0720.4–3125 as a Possible Example of the Magnetic
Field Decay of Neutron Stars
Konenkov D.Yu. & Popov S.B., PAZh 23, pp. 569-575, 1997
(astro-ph/9707318)
Popov S.B. & Konenkov D.Yu., Radiofizika 41, pp. 28-35, 1998
(astro-ph/9812482)
We studied possible evolution of the spin period and the magnetic field of the X-ray source RX J0720.4-3125 assuming this source to be an isolated neutron star accreting interstellar medium. Magnetic field of the source is estimated to be G, and it is difficult to explain observed spin period 8.38 s without invoking hypothesis of the magnetic field decay. We used the model of ohmic decay of the crustal magnetic field. The estimates of accretion rate (), velocity of the source relative to interstellar medium ( km/s), neutron star age ( yrs) are obtained.
We also make new estimate of the equilibrium period for accreting INS in the ISM:
The period corresponds to the NS rms rotation rate obtained from the solution of the corresponding Fokker–Planck equation. In reality, the rotational period of INS fluctuates around this value. We take into account the three-dimensional character of turbulence, i.e. the fact that the vortex can be oriented not only in the equatorial plane but also at any angle to this plane. In this case, diffusion occurs in the three-dimensional space of angular velocities.
Spatial distribution of the accretion luminosity of
isolated neutron stars and black holes in the Galaxy
Popov S.B. & Prokhorov M.E., A&A 331, pp. 535-540, 1998
(astro-ph/9705236)
Popov S.B. & Prokhorov M.E., astro-ph/9606126, 1996
We present here a computer model of the spatial distribution of the luminosity, produced by old isolated neutron stars (NS) and black holes (BH) accreting from the interstellar medium.
We solved numerically the system of differential equations of motions in the Galactic potential. The density in our model is constant in time. In our model we assumed that the birthrate of NS and BH is proportional to the square of the local density. Stars were assumed to be born in the Galactic plane (Z=0) with circular velocities plus additional isotropic kick velocities. Kick velocities were taken equal for NS and BH. It is possible however that BH have lower kick velocities because of their higher masses.
We used masses for NS and for BH. The radii, , where the energy is liberated, was assumed to be equal to 10 km for NS and 90 km (i.e. , ) for BH.
For each star we computed the exact trajectory and the accretion luminosity. The accretion luminosity was calculated using Bondi’s formula. Calculations used a grid with a cell size 100 pc in the R-direction and 10 pc in the Z-direction.
As expected, BH give higher luminosity than NS, as they are more massive. But if the total number of BH is significantly lower than the number of NS, their contribution to the luminosity can be less than the contribution of NS. The total accretion luminosity of the Galaxy for and is about erg/s. For a characteristic velocity of 200 km/s the maximum of the distribution is situated approximately at 5.0 kpc for NS and at 4.8 kpc for BH. For NS with a characteristic velocity of 400 km/s maximum is located at 5.5 kpc, and for BH at 5.0 kpc. This result is also expected because of high masses of BH.
The toroidal structure of the luminosity distribution of NS and BH is an interesting and important feature of the Galactic potential. As one can expect, for low characteristic kick velocities and for BH we have a higher luminosity.
As we made very general assumptions, we argue, that such a distribution is not unique for our Galaxy, and all spiral galaxies can have such a distribution of the accretion luminosity, associated with accreting NS and BH.

Nature of the compact X-ray source in supernova remnant RCW103
Popov S.B., Astron. Astroph. Trans. 17, pp. 35-40, 1998
(astro-ph/9708044; astro-ph/9806354)
Here I briefly discuss the nature of the compact X-ray source in the center of the supernova remnant RCW 103. Several models, based on the accretion onto a compact object such as a neutron star or a black hole (isolated or binary), were analyzed.
I showed that it is more likely that the central X-ray source is an accreting neutron star than an accreting black hole. I also argue that models of a disrupted binary system consisting of an old accreting neutron star and a new one observed as a 69-ms X-ray and radio pulsar are most favored.
Population synthesis of old neutron stars in the Galaxy: no field
decay
Popov S.B., Colpi M., Treves A., Turolla R., Lipunov V.M., Prokhorov
M.E., ApJ 530 (20 Feb), 2000 (astro-ph/9910114)
Isolated neutron stars (NSs) are expected to be as many as –, of the total stellar content of the Galaxy. Young NSs, active as pulsars, comprise only a tiny fraction () of the entire population, and about 1,000 have been detected in radio surveys.
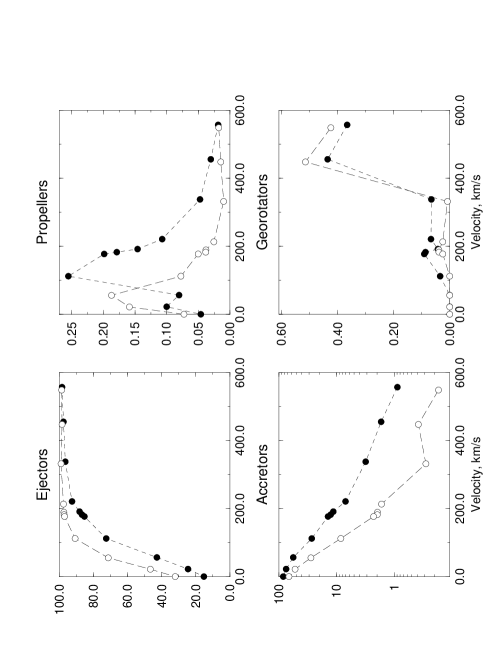
The paucity of old isolated accreting neutron stars in ROSAT observations is used to derive a lower limit on the mean velocity of neutron stars at birth. The secular evolution of the population is simulated following the paths of a statistical sample of stars for different values of the initial kick velocity, drawn from an isotropic Gaussian distribution with mean velocity . The spin–down, induced by dipole losses and the interaction with the ambient medium, is tracked together with the dynamical evolution in the Galactic potential, allowing for the determination of the fraction of stars which are, at present, in each of the four possible stages: Ejector, Propeller, Accretor, and Georotator. Taking from the ROSAT All Sky Survey an upper limit of accreting neutron stars within pc from the Sun, we infer a lower bound for the mean kick velocity, .
Present results, moreover, constrain the fraction of low velocity stars, which could have escaped pulsar statistics, to .
Population synthesis of old neutron stars in the Galaxy: with field
decay
Popov S.B., Colpi M., Treves A., Turolla R., Lipunov V.M., Prokhorov
M.E., ApJ 530 (Feb 20), 2000 (astro-ph/9910114)
The time evolution of the magnetic field in isolated NSs is still a very controversial issue and no firm conclusion has been established as yet. A strong point is that radio pulsar observations seem to rule out fast decay with typical times less than Myr, but this does not exclude the possibility that decays over much longer timescales ( yr).
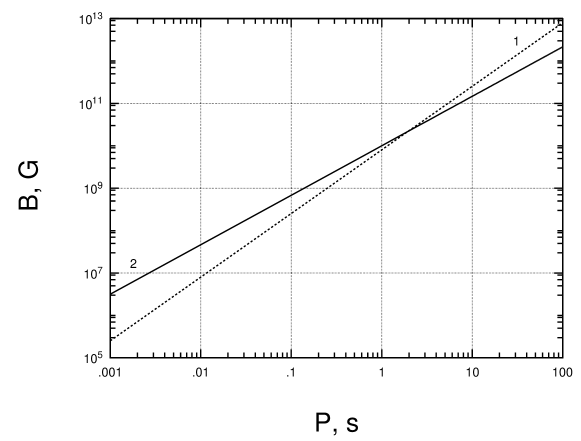
The same conclusion as at the previous page is reached for both a constant ( G) and a magnetic field decaying exponentially with a timescale yr.
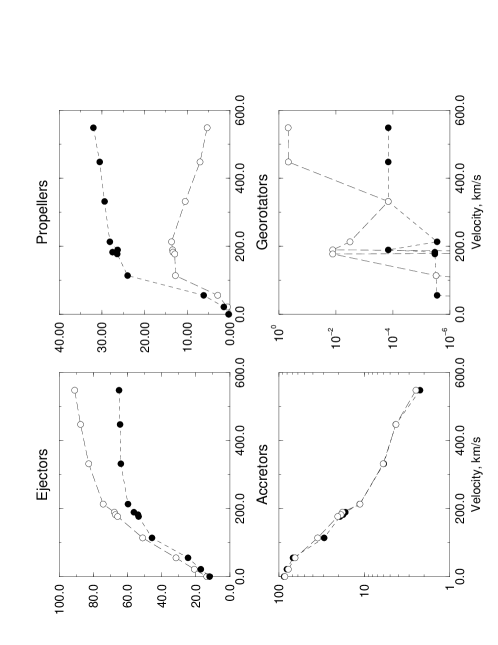
We refer here only to a very simplified picture of the field decay in which . Calculations have been performed for yr, yr and . Results are shown in the figure.
As it is expected, the number of Propellers is significantly increased with respect to the non–decaying case, while Ejectors are now less abundant. Georotators are still very rare. The fraction of Accretors is approximately the same for the two values of , and, at least for low mean velocities, is comparable to that of the non–decaying field while, at larger speeds, it seems to be somehow higher. This shows that the fraction of Accretors depends to some extent on how the magnetic field decays. By contrast, a fast and progressive decay of would lead to an overabundance of Accretors because this situation is similar to “turning off” the magnetic field, i.e., quenching any magnetospheric effect on the infalling matter.
Summarizing, we can conclude that, although both the initial distribution and the subsequent evolution of the magnetic field strongly influences the NS census and should be accounted for, the lower bound on the average kick derived from ROSAT surveys is not very sensitive to , at least for not too extreme values of and , within this model.
ROSAT X-ray sources and
exponential field decay in isolated neutron stars
Popov S.B. & Prokhorov M.E., astro-ph/9908212, 1999
Many astrophysical manifestations of neutron stars (NSs) are determined by their periods and magnetic fields. Magnetic field decay in NSs is a matter of controversy. Many models of the magnetric field decay have been proposed.
The influence of exponential magnetic field decay on the spin evolution of isolated neutron stars is studied. The ROSAT observations of several X-ray sources, which can be accreting old isolated neutron stars, are used to constrain the exponential decay parameters. Even if all modern candidates are not accreting objects, the possibility of limitations of magnetic field decay models based on future observations of isolated accreting NSs should be addressed.
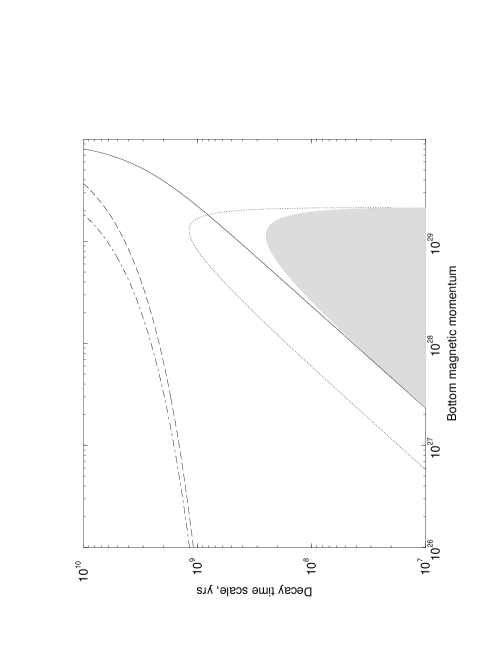
We show that the range of minimum value of magnetic moment, , and the characteristic decay time, , , are excluded assuming the standard initial magnetic momentum, . For these parameters, neutron stars would never reach the stage of accretion from the interstellar medium even for a low space velocity of the stars and a density of the ambient plasma. The range of excluded parameters increases for lower values of .
In fact the limits obtained are even stronger than they could be in nature, because we did not take into account that NSs can spend some significant time (in the case with field decay) at the propeller stage.
We conclude that the existence of several old isolated accreting NSs observed by ROSAT (if it is the correct interpretation of observations), can put important bounds on the models of the magnetic field decay for isolated NSs (without influence of accretion, which can stimulate field decay). These models should explain the fact of observations of accreting isolated NSs in the solar vicinity. Here we can not fully discuss the relations between decay parameters and X-ray observations of isolated NSs without detailed calculations. What we showed is that this connection should be taken into account and made some illustrations of it, and future investigations in that field would be desireble.