A BeppoSAX observation of the cooling flow cluster Abell 2029
Abstract
We present results from a BeppoSAX observation of the cooling flow cluster Abell 2029. The broad band spectrum (2-35 keV) of the cluster, when fitted with a model including a cooling flow component and a one temperature thermal component, yields a temperature of 8.30.2 keV and a metal abundance of 0.460.03 in solar units, for the latter. No evidence of a hard X-ray excess is found in the PDS spectrum. By performing a spatially resolved spectral analysis we find that the projected temperature and abundance drop with increasing radius, going from 8 keV and 0.5 (solar units) at the cluster core to 5 keV and 0.2 (solar units) at about 1.2 Mpc.
Key words: X-rays: galaxies — Galaxies: clusters: individual (Abell 2029)
1 Introduction
Abell 2029 (hereafter A2029) is a rich, nearby (z 0.0766), X-ray luminous, cluster of galaxies. In the optical band, Oegerle et al. (1995), by analyzing the velocity dispersion of a large number of galaxies, do not find any strong evidence of substructure in A2029. X-ray observations (e.g. Slezak, Durret & Gerbal 1994; Buote & Canizares 1996) provide clear evidence that A2029 is a regular cluster. Various authors, either by deprojection analysis of ROSAT data (e.g. Sarazin, O’Connell & McNamara 1992; Peres et al. 1998) or through spectral analysis of ASCA and ROSAT data (e.g. Sarazin, Wise & Markevitch 1998, hereafter S98), have measured a substantial cooling flow in the core of A2029. David et al. (1993), using Einstein MPC data, report a global temperature of 7.8 keV. S98, from the analysis of ASCA data, find evidence of a temperature gradient. The projected temperature is found to decrease from 9 keV to 6 keV when going from the cluster core out to 1.6 Mpc. The temperature map of A2029, presented by S98, is consistent with an azimuthally symmetric temperature pattern. Irwin, Bregman & Evrard (1999), who have used ROSAT PSPC data to search for temperature gradients in a sample of galaxy clusters including A2029, in agreement with S98, find evidence of a radial temperature gradient in A2029. Using ASCA data Allen & Fabian (1998) measure an average metal abundance of 0.460.03. S98, again using ASCA data, do not find compelling evidence of an abundance gradient in A2029.
In this Letter we report a recent BeppoSAX observation of A2029. We use our data to perform an independent measurement of the temperature profile and two-dimensional map of A2029. We also present the abundance profile and the first abundance map of A2029. The outline of the Letter is as follows. In section 2 we give some information on the BeppoSAX observation of A2029 and on the data preparation. In section 3 we present the analysis of the broad band spectrum (2-35 keV). In section 4 we present spatially resolved measurements of the temperature and metal abundance. In section 5 we discuss our results and compare them to previous findings. Throughout this Letter we assume Ho=50 km s-1Mpc-1 and qo=0.5.
2 Observation and Data Preparation
The cluster A2029 was observed by the BeppoSAX satellite (Boella et al. 1997a) between the 4th and the 5th of February 1998. We will discuss here data from two of the instruments onboard BeppoSAX: the MECS and the PDS. The MECS (Boella et al. 1997b) is presently composed of two units (after the failure of a third one), working in the 1–10 keV energy range. At 6keV, the energy resolution is 8% and the angular resolution is 0.7′ (FWHM). The PDS instrument (Frontera et al. 1997), is a passively collimated detector (about 1.51.5 degrees f.o.v.), working in the 13–200 keV energy range. Standard reduction procedures and screening criteria have been adopted to produce linearized and equalized event files. Both MECS and PDS data preparation and linearization was performed using the Saxdas package. The effective exposure time of the observation was 4.2104 s (MECS) and 1.8104 s (PDS). The observed countrate for A2029 was 0.8120.004 cts/s for the 2 MECS units and 0.190.04 cts/s for the PDS instrument.
All MECS spectra discussed in this Letter have been background subtracted using spectra extracted from blank sky event files in the same region of the detector as the source. The energy range considered for spectral fitting is always 2-10 keV. All spectral fits have been performed using XSPEC Ver. 10.00. Quoted confidence intervals are 68% for 1 interesting parameter (i.e. ), unless otherwise stated.
3 Broad Band Spectroscopy
We have extracted a MECS spectrum, from a circular region of 8′ radius (0.95 Mpc), centered on the emission peak. From the ROSAT PSPC radial profile, we estimate that about 90% of the total cluster emission falls within this radius. The PDS background-subtracted spectrum has been produced by subtraction of the “off-source” from the “on-source” spectrum. As in Molendi et al. (1999) (hereafter M99), a numerical relative normalization factor among MECS and PDS spectra has been included to account for: the fact that the MECS includes emission out to about 1 Mpc from the X-ray peak, while the PDS field of view covers the whole cluster; the mismatch in the absolute flux calibration of the MECS and PDS response matrices; the vignetting in the PDS instrument. The estimated normalization factor is 0.76. In the fitting procedure we allow this factor to vary within 15% from the above value to account for the uncertainty in this parameter. The spectra from the two instruments have been fitted with a one temperature thermal emission component plus a cooling flow component (MEKAL and MKCFLOW codes in the XSPEC package), absorbed by a galactic line of sight equivalent hydrogen column density, , of 3.05 cm-2 (Dickey & Lockman 1990). All parameters of the cooling flow component were fixed, as the energy range we use for spectral fitting (2-35 keV) is not particularly sensitive to this component. More specifically, the minimum temperature was fixed at 0.1 keV, the maximum temperature, and the metal abundance were set to be equal to the temperature and the metal abundance of the MEKAL component, the deposited mass, , was fixed at the value of 363derived by S98 when fitting ROSAT PSPC and ASCA GIS data. The model yields an acceptable fit to the data, 160.0 for 167 d.o.f. The best fitting values for the temperature and the metal abundance are respectively, 8.30.2 keV and 0.460.03, solar units. By assuming a value of , equal to the one derived by Peres et. al (1998) by deprojecting the ROSAT PSPC surface brightness profile, we obtain a fit of similar quality for 167 d.o.f. and derive a slightly higher value for the temperature 8.60.2 keV and a similar value for the abundance, 0.470.02.

4 Spatially Resolved Spectral Analysis
The spectral distorsions introduced by the energy dependent MECS PSF, when performing spatially resolved spectral analysis, have been taken into account using the method described in M99 and references therein.
We have accumulated spectra from 5 annular regions centered on the X-ray emission peak, with inner and outer radii of 0′-2′, 2′-4′, 4′-6′, 6′-8′ and 8′-12′. A correction for the absorption caused by the strongback supporting the detector window has been applied for the 8′-12′ annulus, where the annular part of the strongback is contained. For the 6′-8′ region, where the strongback covers only a small fraction of the available area, we have chosen to exclude the regions shadowed by the strongback.
We have fitted each spectrum, except the one extracted from the innermost region, with a MEKAL model absorbed by the galactic NH, of 3.05 cm-2. In the spectrum from the 0′-2′ region we have included a cooling flow component, the parameters of this component have all been fixed, as in the fitting of the broad band spectrum (see section 3). The temperature and abundance we derive for the innermost region are respectively 8.2 0.4 keV and 0.53 0.04, solar units, if we assume the mass deposition reported by S98, , and 9.0 0.5 keV and 0.55 0.05, solar units, if we assume the mass deposition reported by Peres et. al (1998), . In figure 1 we show the temperature and abundance profiles obtained from the spectral fits, the values reported for the innermost annulus are those obtained by fixing the mass deposition to . Our measurements are practically unaltered if we excise from the accumulated spectra the emission of 2 pointlike sources, clearly recognizable in the ROSAT PSPC image of A2029 (see figure 1 of S98). By fitting the temperature and abundance profiles with a constant we derive the following average values: 0.2 keV and 0.410.03, solar units. A constant does not provide an acceptable fit to the temperature profile. Using the statistics we find: 15.2 for 5 d.o.f., corresponding to a probability of 0.009 for the observed distribution to be drawn from a constant parent distribution. A linear profile of the type, kT = a br, where kT is in keV and r in arcminutes, provides a much better fit, 3.5 for 4 d.o.f. The best fitting values for the parameters are a keV, b keVarcmin-1. The improvement is found to be statistically significant at more than the 97.5% level according to the F-test. As for the temperature, a constant does not provide an acceptable fit to the abundance profile, 16.4 for 4 d.o.f. (Prob.0.002). Interestingly, a linear profile of the type, Ab = a br, where r is in arcminutes and Ab is in solar units, provides a significantly better fit, 0.6 for 3 d.o.f. According to the F-test, the probability that the improvement in the fit might be associated to the reduction in the d.o.f. is 0.001. The best fitting values for the parameters are a solar units, b solar unitsarcmin-1.
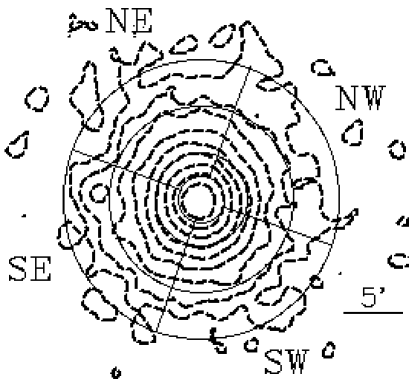
We have divided A2029 into 4 sectors: NW, SW, SE and NE. Each sector has been divided into 3 annuli with bounding radii, 2′-4′, 4′-8′ and 8′-12′. In figure 2 we show the MECS image with the sectors overlaid. A correction for the absorption caused by the strongback supporting the detector window has been applied for the sectors of the 8′-12′ annulus. We have fitted each spectrum with a MEKAL model absorbed by the galactic NH. Our temperature and abundance measurements are practically unaltered if we excise from the spectra the emission of the 2 pointlike sources visible in the ROSAT PSPC image of A2029 (see figure 1 of S98).

In figure 3 we show the temperature profiles obtained from the spectral fits for each of the 4 sectors. In all the profiles we have included the temperature measure obtained for the central region with radius 2′. Fitting each radial profile with a constant temperature we derive the following average sector temperatures: 7.80.3 keV for the NE sector, 8.00.3 keV for the NW sector, 7.70.3 keV for the SW sector and 7.50.3 keV for the SE sector. The fits yield the following values: for 3 d.o.f. (Prob.) for the NE sector, for 3 d.o.f. (Prob.) for the NW sector, for 3 d.o.f. (Prob.) for the SW sector and for 3 d.o.f. (Prob.) for the SE sector. In the NE sector the temperature first increases to values 10 keV in the second and third annulus, and then decreases to 5 keV in the outermost annulus. By comparing the temperature of NE sector of the second and third annulus with the temperature averaged over the other 3 sectors in the second and third annulus, we find that they differ at the level. In the SE and NW sector the temperature decreases continuously as the distance from the cluster center increases, although the statistical significance of the decrease is rather small in the NW sector. Finally in the SW sectors, due to the relatively large errors, no trend can be seen in the temperature profile.

In figure 4 we show the abundance profiles for each of the 4 sectors. In all profiles we have included the abundance measure obtained for the central region with bounding radius 2′. Fitting each profile with a constant abundance we derive the following sector averaged abundances: 0.500.04 for the NE sector, 0.490.04 for the NW sector, 0.430.04 for the SW sector and 0.480.04 for the SE sector. The fits yield the following values: for 3 d.o.f. (Prob.) for the NE sector, for 3 d.o.f. (Prob.) for the NW sector, for 3 d.o.f. (Prob.) for the SW sector and for 3 d.o.f. (Prob.) for the SE sector. A decreasing trend is observed in all sectors, except perhaps the NW sector. A highly statistically significant gradient is observed only in the SW and SE sectors.
5 Discussion
Previous measurements of the temperature structure of A2029 have been performed by S98 and White (1999), using ASCA data, and by Irwin, Bregman & Evrard (1999), using ROSAT PSPC data. S98 find a decreasing radial temperature profile. In figure 1 we have overlaid the temperature profile obtained by S98 using ASCA data, to our own BeppoSAX profile. Although the single temperature measurements show some discordance an overall temperature decline is observed in both profiles. Indeed, a fit with a linear profile of the type kT = a br, where kT is in keV and r in arcminutes, to the S98 data, provides best fitting parameters: a keV, b keVarcmin-1 compatible with those derived from the BeppoSAX data. Recently White (1999) has reanalyzed the ASCA observation of A2029 finding a temperature profile which, although suggestive of a temperature gradient, due to the rather large uncertainties, is consistent with a constant temperature and at the same time with the BeppoSAX declining profile. Irwin, Bregman & Evrard (1999) have used ROSAT PSPC hardness ratios to measure temperature gradients for a sample of nearby galaxy clusters, which includes A2029. In their analysis they find evidence of a radial temperature decrease, the authors comment that a temperature gradient is probably present in this cluster. The profiles we report in figure 3 suggest that the radial temperature gradient is most likely present in all sectors. We also find an indication of an azimuthal temperature gradient occurring in the annuli with bounding radii 2′-4′ (0.24 Mpc - 0.47 Mpc) and 4′-8′ (0.47 Mpc - 0.95 Mpc). The data suggests that the NE sector of the cluster may be somewhat hotter than the rest. Given the modest statistical significance of this temperature enhancement, and the lack of detection of substructure in this sector either from X-ray images (e.g. Buote & Canizares 1996) or from optical velocity dispersion studies (Oegerle et al. 1995), we cannot make a strong case in favor of an azimuthal temperature gradient.
The ASCA radial abundance profile reported by S98 and by White (1999) is characterized by rather large uncertainties, and is compatible with a constant abundance as well as with an abundance decrement such as the one we measure with BeppoSAX data. The profiles we report in figure 4 suggest that the radial abundance gradient is most likely present in all sectors.
-
Acknowledgements.
We acknowledge support from the BeppoSAX Science Data Center.
References
- 1 Allen, S., W., & Fabian, A., C. 1998, MNRAS, 297, L63
- 2 Boella, G., Butler, R. C., Perola, G. C., Piro, L., Scarsi, L., & Bleeker, J. A. M. 1997a, A&AS, 122, 299
- 3 Boella, G., et al. 1997b, A&AS, 122, 327
- 4 Buote, D. A., & Canizares, R.C. 1996, ApJ, 457, 565
- 5 David, L. P., Slyz, A., Jones, C., Forman, W., Vrtilek, S. D., & Arnaud, K. A. 1993, ApJ, 412, 479
- 6 Dickey, J. M., & Lockman, F., J. 1990, ARA&A, 28, 215
- 7 Frontera, F., Costa, E., Dal Fiume, D., Feroci, M., Nicastro, L., Orlandini, M., Palazzi, E., & Zavattini G. 1997, A&AS 122, 357
- 8 Irwin, J.A., Bregman J.N., & Evrard A.E. 1999, ApJ 519, 518
- 9 Markevitch, M., & Vikhlinin, A. 1997, ApJ, 474, 84
- 10 Molendi, S., De Grandi, S., Fusco-Femiano, R. et al. ApJL in press (astro-ph/9909228, M99)
- 11 Oegerle, W.R., Hill, J.M., & Fitchett, M.J. 1995, AJ, 110, 32
- 12 Peres, C. B., Fabian, A. C., Edge, A. C., Allen, S. W., Johnstone, R. M., & White, D. A. 1998, MNRAS, 298, 416
- 13 Sarazin, C.L., O’Connell, R.W., McNamara, B.R. 1992, ApJ, 389L, 59
- 14 Sarazin, C.L., Wise, M.W., Markevitch, M.L. 1998, ApJ, 498, 606 (S98)
- 15 Slezak, E., Durret, F., Gerbal, D. 1994, AJ, 108, 1996
- 16 White, D. A. 1999, MNRAS in press (astro-ph/9909467)