Galactic Bulges from HST-NICMOS Observations: Ages and Dust
Abstract
We present optical and near-infrared colour maps of the central regions of bulges of S0 and spiral galaxies obtained with WFPC2 and NICMOS on the HST. By combined use of HST and ground-based data the colour information spans from a few tens of pc to a few kpc. In almost all galaxies the colour profiles in the central 100-200 pc become more rapidly redder. We attribute the high central colour indices to a central concentration of dust. We infer an average extinction at the center of AV = 0.6 – 1.0 mag. Several objects show central dust rings or disks at sub-kpc scales similar to those found by others in giant ellipticals. For galactic bulges of types S0 to Sb, the tightness of the vs relation suggests that the age spread among bulges of early type galaxies is small, of at most 2 Gyr. Colours at 1 Reff, where we expect extinction to be negligible are similar to than those of elliptical galaxies in the Coma cluster, suggesting that these bulges formed at the same time as the bright galaxies in Coma. Furthermore the galaxy ages are found to be independent of their environment. Since it is likely that Coma was formed at redshift z 3, our bulges, which are in groups and in the field, also must have been formed at this epoch. Bulges of early-type spirals cannot be formed by secular evolution of bars at recent epochs, since such bulges would be much younger. There are three galaxies of type Sbc and later, their bulges are younger and could perhaps arise from secular evolution of transient bars. Our results are in good agreement with semi-analytic predictions (Baugh et al. 1996, 1998, Kauffmann 1996), who also predict that bulges, in clusters and in the field, are as old as giant ellipticals in clusters.
keywords:
1 Introduction
We do not have a clear picture of the formation mechanism for the central bulges of spiral galaxies. Their structural and dynamical properties have long suggested the view that bulges are like small elliptical components residing in the center of a large disk. Indeed, bulges obey the Dn – relation and fall on the Fundamental Plane of elliptical galaxies (Dressler et al. 1987, Bender et al. 1992). Their surface brightness profiles fall off as (Andredakis et al. 1995), with = 4 for early-type galaxies falling to = 1 for Sc and later types. Dynamically, bulges are consistent with oblate, isotropic models, like low-luminosity ellipticals (Kormendy & Illingworth 1982, Davies et al. (1983)). In a series of papers Peletier and Balcells have studied optical and near-infrared (NIR) colour distributions of a complete sample of spiral bulges, using ground-based data (Balcells & Peletier 1994, Peletier & Balcells 1996, 1997) with the goal of extending the comparison of bulges and ellipticals to their stellar populations. They find that, once dust is accounted for, the colours of bulges are never redder than those of elliptical galaxies of the same luminosity. Bulge colours are very similar to those of the inner disk, the differences being much smaller than colour differences from galaxy to galaxy. Population models then suggest that the inner disk (at 2 scale lengths) must have formed at the same time as, or at most 3 Gyr after, the bulge, and that bulge metallicities are lower than those of giant ellipticals.
HST allows us to investigate the centres of bulges with a ten fold increase in angular resolution, yet HST data on the colours of galaxy centres at scales of tens of parsecs is scarce. Colours contain useful information on the stellar populations of the galaxy centres, and allow us to estimate the level of internal extinction. HST data have shown that dust patches are very common in galaxy nuclei, even in ellipticals (van Dokkum & Franx 1995), hence we expect a strong signature of dust in spiral bulges. NICMOS allows an unprecedented look at the inner structure of bulges in the H band where the extinction is approximately a factor 6 lower than in V. NICMOS can produce more reliable measurements of surface brightness profiles and isophotal shapes.
Here we show the results of the first colour study of the centers of galactic bulges based on HST/NICMOS data. We observed in the NICMOS F160W band (-band), F814W () and in F450W, a wider version of the -band. This combination of passbands is very suitable to study stellar populations in galaxies with limited amounts of extinction and recent star formation, like centres of early-type spirals. In those galaxies the observed colours are determined by the underlying old stellar population, perturbed by dust extinction and the light of young, recently formed stars. Extinction by dust affects all optical and near-infrared colours, while recent star formation can only be seen in blue passbands (see e.g. Knapen et al. 1995). In that paper it is shown that a red colour, like will primarily show the extinction due to dust, as well as old stellar population gradients, while a colour which includes a blue band like or , in this paper , is specially sensitive to recent star formation. In the absence of extinction, B, I and H make it possible, in principle, to measure the age and metallicity of the stellar population (e.g. Aaronson et al. 1978; Peletier et al. 1990; Bothun & Gregg 1990). We infer large amounts of centrally concentrated dust within the inner 100 pc. Outside this region, the colour-colour distribution is quite tight, allowing us to place limits on the age dispersion of galactic bulges. With the HST it is easier to reach a high photometric accuracy, because there is no atmospheric extinction to correct for, the instrumental PSF is stable, and the instrument is very well characterized, as compared to ground-based instruments. This means that we can expect accuracies of 0.02–0.03 mag or better in optical and near-infrared colours. Such high quality measurements are vital if we are to separate the effects of age and metallicity using colours, even though the large wavelength baseline (--) minimises the effect of photometric errors.
Currently there are three main scenarios for the formation of bulges: bulges form before, contemporaneously with, or after disks (see the review by Wyse et al. 1997, and Bouwens et al. 1999). In the first scenario (Eggen et al. 1962, Larson 1975, Carlberg 1984) the formation of bulges is mainly described by collapse of a primordial gas cloud into clumps, which then merge together. The disk only forms after the last massive merger via gas infall. In a second scenario, infall of a gas-rich dwarf galaxy onto a disk produces star formation more or less at the same time in bulge and disk (Pfenniger 1992). In the third scenario of secular evolution of disks (e.g Combes et al. 1990, Pfenniger & Norman 1990, Norman et al. 1996), the bulge is formed by dynamical instabilities of the disk, in which a bar is formed, which then forms a massive central concentration by allowing material to stream towards the central regions. The central mass concentration itself then tidally disrupts the bar and forms the bulge. When material is continuing to fall onto the disk sometime later a new bar can be formed, and the whole process will start again and induce more star formation in the bulge. To distinguish between these models one needs to measure the ages of both bulges and disks. Peletier & Balcells (1996) and Terndrup et al. 1994, using ground-based data, found that the ages of bulges and inner disks are very similar. Here in this paper we measure the ages of the bulges themselves.
The paper is organized as follows: Section 2 gives details of the observations and data reduction. Section 3a discusses the dust content of the galactic bulges. Section 3b describes the analysis of the stellar populations, and in Section 4 some implications for our understanding of galactic bulges are discussed.
2 Sample and Observations
Twenty galaxies were observed with HST in Cycle 7 (Summer 1997) with WFPC2 (F450W and F814W) and NICMOS (F160W). They all are part of the original sample of Balcells & Peletier (1994), which is a complete, -magnitude-limited sample of early-type spirals (type S0-Sbc) with inclinations larger than 50o, and for which one side of the minor axis colour profile is approximately featureless as seen from the ground. The subsample considered here was chosen to include galaxies of types S0-Sbc, excluding galaxies that are exactly edge-on, and is biased towards the nearest objects. The galaxies observed are given in Tables 1 and 2. Their basic parameters: luminosities, effective radii and ground-based colours, are given in Andredakis et al. (1995) and Peletier & Balcells (1997). The mean absolute -band magnitude of the sample is = –22.50 mag, with an RMS dispersion of 1 mag (H0 = 70 km s-1 Mpc-1).
The standard HST-pipeline data reduction was used for the WFPC2 optical data. For NGC 7457 the -band observations were taken from the HST Archive. For the -band two MULTIACCUM NIC2-exposures of in total 256 s were taken, offset from each other by 1′′, to enable us to remove bad pixels. The standard STSDAS CALNICA reduction package was used, after which a small fraction of the flatfield was subtracted from the reduced images, to account for a non-zero pedestal level in the raw image. This fraction was determined by requiring that the final image was smooth, and amounts to about 0.3-0.5 ADU s-1, corresponding to about =17 mag (arcsec)-2. Applying this step is only important for the lowest flux levels, but the images improve considerably in quality (they look like the ground-based images). The final sky background level was determined by comparing the image with the ground-based image in the same band. To compare the -band data with the ground-based data in , we used the following transformation, derived from the new GISSEL96 models of Bruzual & Charlot (see Leitherer et al. 1996):
The images were calibrated to the STMAG system using Holtzmann et al. (1995), using a constant shift of 0.10 mag to correct to infinite aperture. The method described in the same paper was used to iteratively account for the colour term in the F450W filter. The colours were corrected for galactic extinction using the new dust maps of Schlegel et al. (1998), and the Galactic extinction law (Rieke & Lebofsky 1985). After this the bands were K-corrected. This small correction (from Persson et al. 1979) was = -5, = – and = 0.
To account for the difference in Point Spread Functions (PSF) when determining the – colour maps and profiles, the -band image was convolved with the -band PSF, and the -band image with the -band PSF. These PSFs were determined with the TinyTim package (Krist 1992). We then determined minor axis profiles by averaging azimuthally in wedges of 22.5o, centered on the -band nucleus. We then combined the surface brightness profiles with the ground-based profiles to cover the whole spatial range of the bulge, by shifting the ground-based profile on top of the HST-profile between about 3′′ and 6′′. This way the final profiles have high signal-to-noise everywhere, and the high-quality photometric accuracy of HST data, for which absolute and relative accuracies of a few percent can be expected (Colina et al. 1998). We then subtracted these wedge profiles in pairs of bands to obtain colour profiles. In Table 1 we list the galaxies and their colours at the center and at one Reff.
| NGC | T | Reff | ||||
|---|---|---|---|---|---|---|
| 5326 | 1 | 2.16 | 2.510 | 2.089 | 2.117 | 1.796 |
| 5389 | 0 | 4.67 | 2.992 | 2.082 | 2.208 | 1.823 |
| 5422 | -2 | 4.51 | 2.581 | 2.092 | 2.170 | 1.809 |
| 5443 | 3 | 4.70 | 2.894 | 1.941 | 2.408 | 1.554 |
| 5475 | 0 | 2.58 | 2.342 | 2.065 | 2.014 | 1.774 |
| 5577 | 4 | 4.14 | 1.910 | 1.862 | 1.792 | 1.665 |
| 5587 | 0 | 2.13 | 2.600 | 1.993 | 2.086 | 1.840 |
| 5689 | 0 | 3.72 | 2.355 | 2.058 | 2.231 | 1.816 |
| 5707 | 2 | 3.40 | 2.720 | 2.069 | 2.144 | 1.722 |
| 5719 | 2 | 3.88 | 3.494 | 2.252 | 2.758 | 1.972 |
| 5746 | 3 | 14.6 | 4.117 | 2.040 | 2.910 | 1.749 |
| 5838 | -3 | 7.50 | 2.600 | 2.091 | 2.184 | 1.767 |
| 5854 | -1 | 6.03 | 1.872 | 1.840 | 1.821 | 1.659 |
| 5879 | 4 | 2.29 | 2.653 | 1.932 | 2.353 | 1.704 |
| 5965 | 3 | 8.23 | 2.946 | 2.051 | 2.406 | 1.755 |
| 6010 | 0 | 2.43 | 2.543 | 2.086 | 2.105 | 1.843 |
| 6504 | 2 | 4.98 | 2.452 | 2.064 | 2.062 | 1.764 |
| 7331 | 3 | 5.0 | 2.356 | 2.047 | 1.978 | 1.766 |
| 7457 | -3 | 8.55 | 1.951 | 1.920 | 1.823 | 1.620 |
| 7537 | 4 | 1.48 | 2.928 | 1.948 | 2.560 | 1.969 |
| 4472 | – | – | – | 2.357 | – | 1.947 |
Notes to Table 1: The morphological types in column (2) are from the RC3 (de Vaucouleurs et al. 1991). The effective radii of the bulges in column (3) in arcseconds are from Andredakis et al. (1995), except for NGC 7331, where the value is an estimate based on Prada et al. (1996). Distances in kpc are given in Andredakis et al. (1995). Also given are the colours of NGC 4472 at 5′′ (see text).
3 The vs. colour-colour diagram
3.1 Dust in Nuclei of Galactic Bulges
In Fig. 1 we show intensity-maps of the inner regions of the galaxies, together with and colour maps with the same scale and orientation, superimposed on -band contour maps. The maps indicate the position of dust lanes. It is clear from the figure that many, maybe all, galaxies have red nuclei. To show this more clearly we show all colour profiles obtained in wedges along the dust free side of the minor axis in Fig. 2. This is not the first time that red nuclei have been found in spiral galaxies. For example, in our ground-based data (Peletier & Balcells 1997) we show several galaxies with red nuclei. For that sample however the colour profiles on the least dusty side are generally featureless at radii larger than 1′′, showing the same logarithmic colour gradients throughout the bulge. Inside 1′′ no information is available about the colours from ground-based data. The fact that the PSF of the HST data is well known and stable enables us to correct the colour-profiles and maps for most of the instrumental PSF effects. In this way one can measure colours down to radii as small as 0.10′′ (the diffraction limit is 0.15′′). At this resolution the red nuclei are easy to see, and extended in most of our sample.
Nuclei can be red because of local dust, large foreground dust lanes, or because of red stellar populations. One usually can distinguish between dust and stellar population reddening by looking for patchy structures, since they are generally due to dust extinction, or to star formation, in combination with extinction. In Table 2 we indicate the nature of the features that we find in the nuclei.
| NGC | F. | Nuc. | Blue | 60mu | 100mu | comment |
|---|---|---|---|---|---|---|
| disk | d/p | Patch | [Jy] | [Jy] | ||
| (1) | (2) | (3) | (4) | (5) | (6) | |
| 5326 | – | + | – | – | – | LGC 361 |
| 5389 | + | + | – | 0.33 | 1.51 | |
| 5422 | + | + | – | – | – | LGC 373 |
| 5443 | – | + | – | 0.33 | 1.48 | LGC 373 |
| 5475 | – | + | + | – | – | |
| 5577 | – | + | MDSF | 0.58 | 1.94 | LGC 379 |
| 5587 | – | + | – | 0.23 | 0.79 | |
| 5689 | + | + | – | 0.46 | 1.27 | LGC 384 |
| 5707 | + | + | – | – | – | LGC 384 |
| 5719 | + | ? | – | 8.05 | 17.1 | LGC 386 |
| 5746 | + | ? | – | 1.33 | 8.88 | LGC 386 |
| 5838 | – | + | + | 0.74 | 1.47 | LGC 392 |
| 5854 | – | + | + | – | – | LGC 393 |
| 5879 | + | ? | MDSF | 0.29 | 3.04 | LGC 396 |
| 5965 | + | + | – | 0.39 | 1.84 | |
| 6010 | – | – | – | – | – | |
| 6504 | – | – | – | – | – | |
| 7331 | + | ? | – | 23.1 | 81.6 | LGC 459 |
| 7457 | – | – | – | – | – | |
| 7537 | – | + | MDSF | – | – |
Notes to Table 2: A ’+’ sign in column (2) indicates the presence of a large foreground disk, in column (3) the presence of a red nuclear dust patch or lane, and in column (4) the presence of a blue patch near the nucleus. IRAS fluxes are presented in column (5) and (6). ’MDSF’ in column (4) means ’mixed dust and star formation’ in the whole nuclear area. The LGC number is the group designation (by Garcia 1993).
We find (Table 2) only three galaxies: NGC 6010, 6504 and 7457, without nuclear dust features, although in some cases a large foreground dust lane makes nuclear dust difficult to detect. For these three galaxies we analysed the isophote shapes more carefully. Dust patches make galaxy isophotes irregular in particular the third order Fourier terms C3 and S3 (Carter 1978) will be non-zero, and generally increasing in amplitude to the blue. S3 and C3 were found to be significantly non-zero in both and in NGC 6010 and 6504 but not in NGC 7457. We conclude that the signature of dust is to be found in almost all galaxies in the sample, including some galaxies indicated with a (–) sign in column 3 of Table 2.
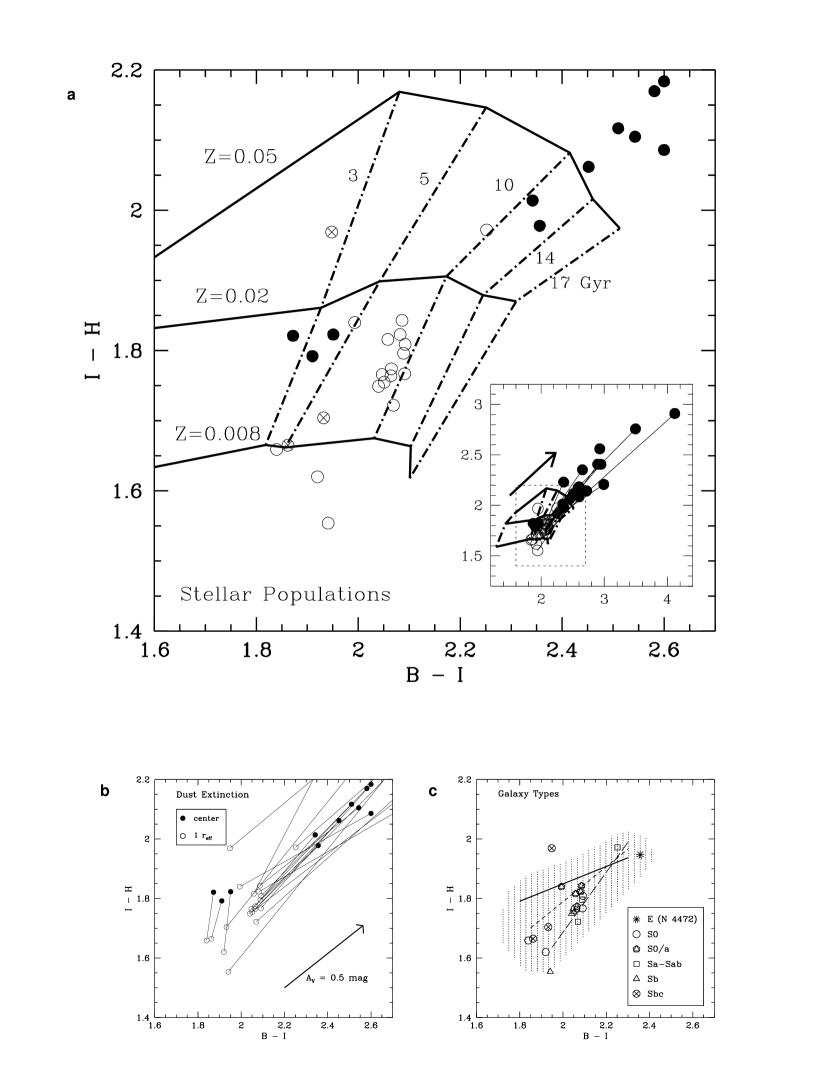
How much reddening is caused by the dust? In Fig. 3 we show the colours at the center (filled dots) and at one bulge effective radius (open dots) in a vs. colour-colour diagram. Fig. 3 (b) and (c) show that in all cases the galaxy is redder in the centre than at re, by sometimes very large amounts. Since the vector indicating reddening by dust is almost parallel to the the vector indicating changes in metallicity, it is not possible to say exactly how much of the reddening is due to extinction. Lower and upper limits to the internal extinction may be estimated as follows.
A plausible upper limit to the reddening is derived by assuming that the galaxy at 1 Reff is dustfree. This is perhaps reasonable, since at these radii no structure is seen in the colour maps, and there is a small dispersion in the colour-colour plot. We infer that the central and the colours are reddened by an average of 0.42 0.06 mag, and 0.61 0.11 mag respectively. A lower limit to the reddening can be found if one assumes that the stellar populations are never redder than those of the central Virgo galaxy NGC 4472. Using the data at 5′′ (or 400 pc) from Peletier et al. (1990) for NGC 4472, converted to and as described in the Appendix, we find that the colours would be reddened by on the average 0.37 0.06 mag and by 0.41 0.10 mag. Using the Galactic extinction law (Rieke & Lebofsky 1985) these numbers correspond to an average internal extinction AV between 0.89 and 1.01 mag, if is used, and between 0.56 and 0.78 mag when one uses . The estimates using are somewhat higher than those from , because nuclear star formation in some galaxies makes the radial colour difference in smaller, as is seen in NGC 5838, 5854 and 5475. In the colour map of these galaxies there are blue nuclear features which do not appear in . These patches, presumably caused by young stars, reduce the radial colour variations in blue colours like but not in .
Our upper limits for the amount of dust inferred here are probably somewhat too high, because part of the reddening is caused by stellar population gradients. From the most dustfree galaxies we infer that the colour difference due to stellar populations between center and 1 Reff is 0.1 mag in both and , which implies that colour gradients in the inner parts of bulges are affected much more by dust than by stellar populations.
3.2 Stellar Populations
Apart from providing high resolution, HST also has the advantage that the photometric conditions are very stable, so that accurate colours can be determined. For this reason, and because we have a very large colour-baseline, we can use the colour-colour diagram to infer information about the age-spread in the sample, and about the cause of the stellar population gradients. Studying Fig. 1 carefully, we see that many physical phenomena are playing a role in these galaxies. We observe the combined effects of extinction, recent star formation, and old stellar population gradients. To disentangle them we have displayed the galaxies in Fig. 1 according to their morphological type. Although the type (from de Vaucouleurs et al. 1991) has been given based on low-resolution optical observations, we can see that the properties of the galaxies change smoothly as a function of type. S0 galaxies have small dustlanes, and have rather featureless colour maps. Sb galaxies tend to have strong dustlanes, while the Sbc galaxies are considerably bluer, have lower surface brightness, show patchy dust and star formation together, and are rather different from the rest of the galaxies.
Having established (in Section 3.1) that extinction at 1 Reff is probably negligible, we will now consider what the colours can tell us about the stellar populations. First we note the small scatter amongst the open symbols in Fig. 3a confirming that extinction is not important at 1 Reff. If we exclude the three galaxies with the latest Hubble type (the open crossed symbols in Fig. 3c) the stellar populations at Reff form a rather tight sequence in the vs. plane. Fig. 1e shows that the central regions of our 3 Sbc are full of dust and regions of recent star formation, we will not consider them further in this analysis of stellar populations. In Fig. 3a we also show a set of Single Stellar Population (SSP) models of Vazdekis et al. (1996). The models displayed here have a Salpeter IMF, with a reduced number of low-mass stars, to match better the Scalo (1986) IMF. We see that, independent of the amount of extinction, the tightness of the colour-colour relation shows that the luminosity weighted age of the stars is very similar from bulge to bulge. According to the models the age-spread would be about 1-2 Gyr, although the bluest (and generally faintest) bulges would be somewhat younger. We derive a mean luminosity weighted age of 9 Gyr from these models. While the absolute ages are poorly constrained, the relative ages are much more robust so we can conclude that the age spread amongst bulges in this sample is small. (If we use Worthey (1994)’s models the inferred luminosity weighted age would be implausibly small : 2 Gyr). The galaxy sequence runs parallel to line of constant age suggesting that the colour-variations from galaxy to galaxy are due predominantly to changes in metallicity supporting the view that the colour-magnitude relation for early-type galaxies (e.g. Bower et al. 1992) is mainly driven by changes in metallicity.
Figure 3c shows that the type dependence along the colour-colour relation is very small. The outlying point is NGC 5854 which has a blue central patch (probably of recent star formation). NGC 7457 is a faint S0 galaxy that has bluer and colours than an elliptical of comparable luminosity (Balcells & Peletier 1994) accounting for its rather young inferred age. The bulk of the galaxies of type Sb and earlier occupy a narrow band in vs. . As a comparison we have plotted the colour-colour relation for Coma, determined from the data of Bower etal (1992), converted to our colours as described in the Appendix. We find that the colours of our bulges at 1 Reff are very similar to those of bright Coma galaxies. Our bulges however are somewhat bluer in and redder in , which, according to the stellar population models, could be explained if they are slightly older and somewhat less metal rich. The colour-colour conversion is rather uncertain, however. Also plotted in Fig. 3c are the colour-colour diagrams converted using the theoretical models of Vazdekis et al. (1996) and Worthey (1994). As can be seen in the Figure, the difference between the three colour-colour diagrams in and is quite large. Although we argue (see Appendix) that our empirical calibration can be trusted much more than the theoretical calibrations, one should be careful not to over-interpret the data. What seems safe to conclude is that Coma galaxies are to be found in the shaded area, and that the ages of our bulges are similar to those of the early-type galaxies in Coma.
4 Discussion
In the previous section we have shown that:
-
1.
Centers of bulges of early-type spirals are generally dusty. We find that AV on the average lies between 0.6 and 1.0 mag, which implies that AH should be between 0.1 and 0.2 mag.
-
2.
At 1 Reff Galactic bulges show a very tight vs. relation, implying that the age spread among bulges of early-type spirals is small (at most 2 Gyr).
-
3.
The colours of bulges of early-type spirals at 1 Reff are similar to the colours of early-type galaxies in the Coma cluster. This implies that the age difference between nearby bulges and cluster-ellipticals is small, probably smaller than about 2 Gyr.
Since the extinction observed, is more than a factor 2 (0.76 mag), if the dust is located in or near the center we cannot see through to the other side of the galaxy. The extinction locally will be very large (see Sadler & Gerhard 1985). The fact that this occurs in so many of our galaxies shows that the very central region is almost always optically thick in or . The situation with dust in the centers of spiral bulges is similar to that of elliptical galaxies. Van Dokkum & Franx, analyzing WFPC data of nearby elliptical galaxies, found evidence for central extinction in 75% of their sample. This is more than was previously found from the ground (Ebneter et al. 1988, Véron-Cetty & Véron 1988). Goudfrooij et al. (1994b) detected dust in 41% of the galaxies in their sample of Revised Shapley-Ames (Sandage & Tammann 1981) galaxies. A similar detection rate as found from IRAS fluxes by Knapp et al. (1989). The higher angular resolution of HST allows us to reach much lower detection limits, we have been able to detect dust in 95 5% of our sample of bulges of early-type spirals. This detection rate is higher than for ellipticals, although our method of finding dust, using colour images, is more sensitive than the method of van Dokkum & Franx, who determined their dust masses from one -band image only. Van Dokkum & Franx found an average dust mass of 4 103 M⊙. For the bulges analysed here we find an average dust mass of 104 M⊙, determined using the method of van Dokkum & Franx: for each dust feature the mass is calculated using Mdust = , with the area of the feature, the mean absorption in the area, and the visual mass absorption coefficient (Sadler & Gerhard 1985). is taken to be 6 10-6 mag kpc2 M. Rough values of were determined by taking the difference in or of the feature and the dustfree values at 1 Reff, converted to AV using the Galactic extinction law (Rieke & Lebofsky 1985). If we assume a Galactic gas to dust ratio of 130 (see van Dokkum & Franx 1995) we find the galaxies analysed in this paper have an average of 106 M⊙ of interstellar material in their nuclear regions.
The origin of the nuclear dust is unclear. At larger radii kinematic observations of gas, usually associated with dust, in ellipticals show that it is often decoupled from the stellar velocity field (for a discussion see Goudfrooij et al. 1994b). This is used to imply that large-scale dust lanes are of external origin perhaps being accreted during galaxy mergers or interactions. However, the origin of the small arcsecond-scale dust lanes found in ellipticals, often oriented along the major axis of the stellar body (Goudfrooij et al. 1994b), could well be internal. Scaling from the numbers for stellar mass-loss for bright ellipticals given by Faber & Gallagher, 1976, we estimate that for typical bulges in our sample the mass will be dposited into the bulge at the rate of 0.1 – 1 M⊙ yr-1, so there is no problem accruing the dust we see. The amount of dust, the large detected fraction, and the fact that the dust lanes are found parallel to the major axis indicate an internal origin. The central dust provides a suitable environment for centrally concentrated star formation, probably leading to strong metallicity enhancements in the central 100 pc of bulges. In that regime, it is possible that so much dust is produced that ordinary dust destruction mechanisms are ineffective. Potentially, high resolution spectral observations will show us whether this dust is indeed of internal origin, and what metallicities that are being reached. The dust however could provide some serious observational difficulties for the determination of the inner slope of the stellar surface density profile of bulges, even in the H band.
Several of our bulges have central features which resemble the inner disk in the giant elliptical NGC 4261 (Jaffe et al. 1996). Examples are NGC 5326, NGC 5587, NGC 5838 and NGC 5854. NGC 4261 has a LINER spectrum in the center, Jaffe et al. argue that this inner disk might provide the fuel for the AGN. Only 4 of the objects studied in our paper however are known to be (weakly) active, NGC 5746, NGC 5838, NGC 5879 and NGC 7331, all classified by Ho et al. (1997) as T2, transition objects between LINER and Seyfert, with narrow emission lines. Their colours are however entirely consistent with an extincted stellar population. Furthermore, many of the ellipticals with similar features are not active galaxies. It seems that an inner disk of gas and dust alone is not sufficient to produce an AGN.
No HST colour profiles of bulges of spirals have appeared in the literature up to now. The only paper presenting high-resolution HST colour profiles of ellipticals is Carollo et al. (1997a), who report V and I profiles of 15 galaxies with dynamically decoupled cores using the refurbished WFPC2. They find that their galaxies all have very similar gradients between radii of 1.5′′ and 10′′, while the dispersion is larger between 0.25′′ and 1.5′′, where some galaxies are seen with gradients that are twice as large, while some others are much smaller, or even negative. Clearly the behavior of is different in their inner 1.5′′ as compared to the area further out. Although Carollo et al. (1997a) masked out dusty areas before obtaining the colour profiles by radially averaging the remaining light, this process will probably not have removed all the extinction. The large spread in colour gradient in the inner region might be a confirmation of significant quantities of dust near the center in almost all elliptical galaxies.
What can we learn about the formation of bulges? The fact that the ages of most of the bulges in this paper are so similar and old makes it very difficult to form the bulges of early-type spirals (S0-Sb) through secular evolution of disks. In this scenario it is expected that bulges regularly undergo major bursts of star formation, to convert gas that has been funneled to the central area through the presence of a bar into stars. This would mean that we would expect to find more young bulges and a large spread in bulge ages. Another problem for early-type bulges is that the bulge densities are up to a factor 100 higher than in the center of the disks. To create such high overdensities in the disk, the required star formation rates are such that they could easily disrupt the disk (Ostriker 1990). Late type galaxies (Sbc’s and later types) might be different. We see that the three in our sample have younger ages (crossed circles in Fig. 3), and also the density contrast between bulge and disk is much smaller. For these galaxies in the bulge region spiral arms, blue star formation regions and dust lanes are seen, as in the disk, telling us that the stellar populations of bulge and disk here are very much the same (see Fig. 1e). Although Norman et al. (1996) use the fact that the Fundamental Plane has changed little from a redshift of the order of 0.5 to now as an argument against secular-evolution driven bulge building, it is not clear whether bulges of late-type galaxies really lie on the fundamental plane of ellipticals and early-type bulges, since no data is available at present.
The fact that the ages of our bulges are all so similar supports the idea of a major episode of star formation in the past, in which most of these bulges (and also the bright galaxies in large clusters like Coma) were formed. It is currently thought that cluster ellipticals must have formed at redshifts beyond = 3 (Ellis et al. 1997, Stanford et al. 1997), because of the lack of evolution seen in clusters of intermediate redshift. This corresponds to an age of 10.5 Gyr ( = 0.2, = 0.8, H0 = 70 km s-1 Mpc-1), or 8.4 Gyr ( = 1, = 0, H0 = 70 km s-1 Mpc-1) (Hogg 1999). The fact that the colours of the majority of our bulges are similar to the Coma galaxies indicates that our bulges (except maybe the Sbc’s) are also old, and formed at redshifts beyond = 3. These observations endorse the original model by Eggen et al. (1962) forming bulges in the beginning during a monolithic, or clumpy, collapse. The fact that the colours of bulges and inner disks are very similar (Terndrup et al. 1994, Peletier & Balcells 1996) then implies that the disk formed very gradually from inside out, with the age of the inner disk similar to the age of the bulge. Can we then say something about the age of the disk? Would it be possible that the whole disk formed at the same time as the bulge? At that point a conflict arises with the star formation history of the universe derived e.g. by Madau et al. (1996) on the basis of data of the Hubble Deep Field, which shows a maximum between = 1 and 3. Since our bulges are found in a variety of environments, they are in no way special, and if most early-type spirals would form at redshifts beyond 3 this would also imply that the maximum in the HDF would have to go to larger z. However, this problem would be solved if disks of early-type galaxies on the average would be considerably younger than their bulges. With a sufficiently large age difference between bulge and disk the luminosity-weighted age of the galaxy (which is in general dominated by the disk) can then be young enough. There is nothing in the data of Terndrup et al. 1994 and Peletier & Balcells 1996 preventing this from happening.
Alternatively, Kauffmann (1995) and Governato et al. (1998) have pointed out that in biased models of galaxy formation accelerated evolution can be expected in dense regions. Our observations here show that there is no difference in age between the ellipticals in Coma and our galactic bulges. This would mean that our bulges, except for the latest types, must have formed early, beyond = 3, as well. On the other hand, we also do not find any dependence of bulge age upon environment. The bulges are found in all kinds of environments, ranging from isolated to groups of more than 20 members (see Table 1). Apparently everywhere in the universe these intermediate-size galaxies must have started forming early-on.
It appears that the only feasible solution is that bulges of early-type spirals are old, and disks considerably younger. This is in agreement with Abraham et. al. (1998), who find for the disk galaxies in the HDF that their bulges are significantly older than their disks (up to 50%). One has however to take into account that at z 1 many large spiral galaxies are found (Lilly et al. (1998), whose stellar populations are consistent with a declining activity since at least z=1.5 – 2 (Abraham et al. 1998). Semi-analytic galaxy formation models also support this picture. In Fig. 4 a histogram is shown of the distribution of -band averaged ages of ellipticals and bulges in the simulations of Baugh et al. (1996) (Baugh, private communication). The models find that the large majority of bulges is old. This is independent of the environment, contrary to elliptical galaxies, which are found to be old in rich clusters, and can be 5 Gyrs younger in the field. Bulges are old because the accompanying disk needs time to form without being disrupted.
We have found that bulges of early-type spirals in general are old, that their age-spread is smaller than 2 Gyr, and that their colour gradients are mainly due to metallicity gradients in the stellar populations. These results once more support the idea that bulges and ellipticals are similar objects. The good agreement between the observational results of this paper and models like the semi-analytical models of Baugh et al. (1996) strongly supports the picture that bulges were formed through monolithic or clumpy collapse, and formed much before theier disks. However, one can see that bulges of Sbc galaxies are different in many respects, and it is likely that these differences will be larger for Sc galaxies and later types (see also the recent HST-study of Carollo et al. (1997b, 1998). They are smaller, younger, have lower central surface brightness, and it is not clear whether they fall on the fundamental plane of elliptical galaxies. Since the observations until now are not good enough to establish whether these late type bulges can be made from bars, and in this way the galaxy type can be changed by secular evolution, it is clear that it is very important to study the bulges of late type spirals to understand the formation of bulges.
Acknowledgements
This paper is based on observation with the Hubble Space Telescope The authors acknowledge very useful support from Luis Colina, Massimo Stiavelli, Jeremy Walsh and Doris Daou at the STScI and ST-ECF, and useful discussions with Ian Smail, Harald Kuntschner, Carlton Baugh and Carlos Frenk. RLD is grateful to Durham University for the award of a Sir James Knott Fellowship and to the Leverhulme Trust for the award of a Research Fellowship, these awards contributed significantly to this research.
References
- [] Aaronson, M., Cohen, J.G., Mould, J. & Malkan, M., 1978, ApJ, 223, 824
- [] Aaronson, M., Bothun, G., Mould, J., Huchra, J., Schommer, R.A. & Cornell, M.E., 1986, ApJ, 302, 536
- [] Abraham, R.G., Ellis, R.S., Fabian, A.C., Tanvir, N.R. & Glazebrook, K., 1998, MNRAS, in press (astro/ph 9807140)
- [] Andredakis, Y., Peletier, R.F. & Balcells, M., 1995, MNRAS, 275, 874
- [] Balcells, M. & Peletier, R.F., 1994, AJ, 107, 135
- [] Baugh, C.M., Cole, S. & Frenk, C.S., 1996, MNRAS, 282, L27
- [] Baugh, C.M., Cole, S., Frenk, C.S. & Lacey, C.G., 1998, ApJ, 498, 504
- [] Bender, R., Burstein, D. & Faber, S.M., 1992, ApJ, 399, 462
- [] Bouwens, R., Cayon, L. & Silk, J., 1999, ApJ, in press
- [] Bothun, G.D. & Gregg, M.D., 1990, ApJ, 350, 73
- [] Bower, R.G., Lucey, J.R. & Ellis, R.S., 1992, MNRAS, 254, 589
- [] Carlberg, R.G., 1984, ApJ, 286, 403
- [] Carollo, C.M., Franx, M., Illingworth, G.D. & Forbes, D., 1997a, ApJ, 481, 710
- [] Carollo, C.M., Stiavelli, M., de Zeeuw, P.T. & Mack, J, 1997b, AJ, 114, 2366
- [] Carollo, C.M., Stiavelli, M. & Mack, J., 1998, AJ, 116, 68
- [] Carter, D., 1978, MNRAS, 182, 797
- [] Charlot, S., Worthey, G. & Bressan, A., 1996, ApJ, 457, 625
- [] Colina, L., Holfeltz, S. & Ritchie, C., 1998, in NICMOS and the VLT, ed. W. Freudling and R. Hook, 1998, ESO, p. 36
- [] Combes, F., Debbasch, F., Friedli, D., & Pfenniger, D., 1990, A&A, 233, 82
- [] Davies, R.L., Efstathiou, G., Fall, S.M., Illingworth, G. & Schechter, P.L., 1983, ApJ, 266, 41
- [] de Vaucouleurs, G., de Vaucouleurs, A., Corwin, H.G., Buta, R.J., Paturel, G., Fouqué, P. 1991, 3rd Reference Catalogue of Bright Galaxies (RC3), Springer, New York
- [] Djorgovski, S. & Davis, M., 1987, ApJ, 313, 59
- [] Dressler, A., Lynden-Bell, D., Burstein, D., Davies, R.L., Faber, S.M., Terlevich, R. & Wegner, G., 1987, ApJ, 313, 42
- [] Ebneter, K., Davis, M. & Djorgovski, S., 1988, AJ, 95, 422
- [] Ellis, R., Smail, I., Dressler, A., et al., 1997, ApJ, 483, 582 et al., ESA Publications (astro/ph 9808025)
- [] Faber, S.M. & Gallagher, J.S. III, 1976, ApJ, 204, 365
- [] Garcia, A., A& AS, 100, 47
- [] Goudfrooij, P., Hansen, L., Jørgensen, H.E., Nørgaard-Nielsen, H.U., de Jong, T & van den Hoek, L.B., 1994a, A&AS, 104, 179
- [] Goudfrooij, P., Hansen, L., Jørgensen, H.E. & Nørgaard-Nielsen, H.U., 1994b, A&AS, 105, 341
- [] Governato, F. et al., 1998, Nature, 392, 359
- [] Ho, L., Filippenko, A.V. & Sargent, W.L.W., 1997, ApJS, 112, 315
- [] Hogg, D.W., astro-ph/9905116
- [] Holtzmann, J.A., Burrows, C.J., Casertano, S., Hester, J.J., Trauger, J.T., Watson, A.M. & Worthey, G., 1995, PASP, 107, 1065
- [] Jaffe, W., Ford, H., Ferrarese, L., van den Bosch, F. & O’Connell, R.W., 1996, ApJ, 460, 214
- [] Kauffmann, G., 1995, MNRAS, 274, 153
- [] Kauffmann, G., 1996, MNRAS, 281, 487
- [] Knapen, J.H., Beckman, J.E., Shlosman, I., Peletier, R.F., Heller, C.H. & de Jong, R.S., 1995, ApJ, 443, L73
- [] Knapp, G.R., Guhathakurta, P., Kim, D.-W. & Jura, M., 1989, ApJs70, 329
- [] Kormendy, J. & Illingworth, G.D., 1982, ApJ, 256, 460
- [] Krist, J. 1992, Tinytim v2.1 User’s Manual (STScI)
- [] Larson, R.B., 1975, MNRAS, 173, 671
- [] Leitherer, C., et al., 1996, PASP, 108, 996
- [] Lilly, S., et al., 1998, ApJ, 500, 75
- [] Madau, P., Ferguson, H.C., Dickinson, M. et al., 1996, MNRAS, 283, 1388
- [] Norman, C., Sellwood, J.A. & Hasan, H., 1996, ApJ, 462, 114
- [] Ostriker, J.P., 1990, in Evolution of the Universe of Galaxies, ASP Conf. Ser. 10, ed. R. Kron (ASP, San Francisco), p. 25
- [] Peletier, R.F., Valentijn, E.A. & Jameson, R.F., 1990, A&A, 233, 62
- [] Peletier, R.F. & Balcells, M., 1996, AJ, 111, 2238
- [] Peletier, R.F. & Balcells, M., 1997, NewA, 1, 349
- [] Persson, S.E., Frogel, J.A. & Aaronson, M., 1979, ApJs39, 61
- [] Pfenniger, D., 1992, in Proc. IAU Symp. 153, Galactic Bulges, ed. H. Dejonghe & H.J. Habing, Kluwer, Dordrecht, p. 387
- [] Pfenniger, D. & Norman, C., 1990, ApJ, 363, 391
- [] Prada, F., Gutiérrez, C., Peletier, R.F. & McKeith, C.D., 1996, ApJ, 463, L9
- [] Rieke, G. & Lebofsky, M.J., 1985, ApJ, 288, 618
- [] Sadler, E.M. & Gerhard, O.E., 1985, MNRAS, 214, 177
- [] Sandage, A.R., Tammann, G., 1981, A Revised Shapley-Ames Catalog of Bright Galaxies, Carnegie Institute of Washington
- [] Scalo, J.M., 1986, Fund. Cosmic Phys, 11, 1
- [] Schlegel, D.J, Finkbeiner, D.P. & Davis, M., 1998, ApJ, in press
- [] Stanford, S.A., Eisenhardt, P.R. & Dickinson, M., 1997, ApJ, 492, 461
- [] Terndrup, D.M., Davies, R.L., Frogel, J.A., Depoy, D.L. & Wells, L.A., 1994, ApJ, 432, 518
- [] van Dokkum, P.G. & Franx, M., 1995, AJ, 110, 2027
- [] Vazdekis, A., Casuso, E., Peletier, R.F. & Beckman, J.E., 1996, ApJs, 106, 307
- [] Véron-Cetty, M.P. & Véron, P., 1988, A&A, 204, 28
- [] Wyse, R.F.G., Gilmore, G. & Franx, M., 1997, ARAA, 35, 637
- [] Worthey, G., 1994, ApJs, 95, 107


Appendix A Colour transformations for the colour-colour diagram of the Coma cluster
In this appendix we describe how a colour-colour relation for the Coma cluster was obtained in and . We started with the excellent data of Bower et al. (1992) in , and . As a first attempt we tried to make the colour conversions using single burst theoretical models for old stellar populations using the Salpeter IMF. A fit to the models of Vazdekis et al. (1996) gives
and
was finally converted to using the new GISSEL96 models of Bruzual & Charlot (see Leitherer et al. 1996) using
since the Vazdekis’ models do not tabulate the -band. Alternatively, a fit to Worthey (1994)’s models gives:
and
using a very similar transformation from to :
There are several reasons to be wary of this approach. In the first place one knows (e.g. Charlot et al. 1996) that the infrared colours of the Worthey models for large metallicities are too red by as much as a magnitude. Secondly, the model colours of Vazdekis et al. in the infrared, just like those of Bruzual & Charlot (Leitherer et al. 1996) do not appear to be very accurate either, since they show abrupt jumps as a function of age and metallicity, due to the rather unknown contribution from stars in their late stages of evolution. The conversion between and is only of minor importance. When one compares the results of both methods, one finds that the difference in the colour-colour diagram of Coma, when using two independent models, is quite large (see Fig. 3c). This shows that a different, independent way to convert the colours would be very useful, and for that reason we attempted to derive an empirical conversion.
In the search of data in or of the Coma cluster to combine with Bower et al.’s dataset, we have found the data of Jørgensen et al. (1994), with photometry in and Gunn , and the Ph.D. thesis of Steel (1998), with and . Since there is no -band photometry available, we decided to determine a conversion from to , a band with information very similar to , and then convert to using published stars. It was also found that if one determines a colour of a galaxy using its integrated magnitudes, the observational error would be much larger than if the same aperture was used both times. For that reason we preferred to use the data inside 20′′ of Steel (1998), for which the dispersion in the vs. was only 0.02 mag, rather than the total colours of Jørgensen etal. (1994). Combining the data of Steel (1998) with those of Bower et al. (1992) one obtains
with a scatter in of 0.03 mag. To convert to we fitted a least squares relation to all the Landolt (1992) standard stars. We find a very tight relation
with negligible scatter. The validity of this conversion between and can be for example be established by looking at the - magnitude relation for the elliptical galaxies of Goudfrooij et al. (1994a). This comparison gives satisfactory results. Finally, we need to obtain a relation between and . Since here also there is quite a difference between the theoretical models, we have determined a least squares relation between the observed and Jørgensen’s , which we first converted to using the conversion given in Jørgensen (1995):
to get:
Errors are difficult to determine. We can get an estimate by comparing the data of Goudfrooij et al. (1994a) with the data of Bower et al. converted to (Figure 5). Plotted on the x-axis for the data of Bower et al. are absolute -band magnitudes, obtained using a distance modulus of 30.82 for Virgo and 34.51 for Coma (Aaronson et al. 1986), to which a correction of 0.76 mag has been applied to convert them to integrated magnitudes. For the data of Goudfrooij et al. (1994a) we plot their MV values. There are three galaxies in common between the 2 samples, for which the MV values agree within 0.10 mag. Comparing the two samples we find that for the galaxies between MV = –21 and –24 is redder by 0.032 mag on the average in the data of Goudfrooij et al. (1994a). This shows that our conversion from to is probably reasonable, and based on this, and on the tightness of individual relations, we believe that the error in is at most 0.06 mag, the same for or , and 0.05 mag in , resulting in 0.08 mag in . We not only applied these transformation to the mean relation for the Coma cluster, but also for the giant elliptical NGC 4472 (see Fig. 3).