Near–infrared line imaging of the circumnuclear starburst rings in the active galaxies NGC 1097 and NGC 6574
Abstract
We present high spatial resolution near–infrared broad–band and Br 2.166 m and H2 1–0 S(1) 2.121 m emission line images of the circumnuclear star formation rings in the LINER/Seyfert 1 galaxy NGC 1097 and in the Seyfert 2 galaxy NGC 6574. We investigate the morphology, extinction, and the star formation properties and history of the rings, by comparing the observed properties with an evolutionary population synthesis model.
The clumpy morphology in both galaxies varies strongly with wavelength, due to a combination of extinction, emission from hot dust and red supergiants, and the age of the stellar populations in the rings. The near–infrared and radio morphologies are in general agreement, although there are differences in the detailed morphology. From the comparison of Br and H fluxes, we derive average extinctions toward the hot spots AV = 1.3 for NGC 1097 and AV = 2.1 for NGC 6574. The observed H2/Br ratios indicate that in both rings the main excitation mechanism of the molecular gas is UV radiation from hot young stars, while shocks can contribute only in a few regions.
The starburst rings in both galaxies exhibit small Br equivalent widths. Assuming a constant star formation rate with Mu = 100 M⊙ results in extremely long ages (up to 1 Gyr), in disagreement with the morphology and the radio spectral index of the galaxies. This situation is only slightly remedied by a reduced upper mass cutoff (Mu = 30 M⊙). We prefer a model of an instantaneous burst of star formation with Mu = 100 M⊙ occurring 6–7 Myr ago. Gaseous nuclear bars parallel to the stellar nuclear bar were detected in both galaxies, and we derive M 100 M⊙ for the mass of the excited nuclear H2 emission. Finally, we briefly discuss the connection between the rings, bars and the fuelling of nuclear activity.
Key Words.:
Galaxies: individual: NGC 1097 – Galaxies: individual: NGC 6574 – Galaxies: Seyfert – Galaxies: starburst – Infrared: galaxies – Stars: formation1 Introduction
Bright hot spots of star formation (SF) in the circumnuclear regions of spiral galaxies are often closely connected to the existence of a bar. In many cases, these hot spots make up a kpc–size ring or spiral pattern (e.g. Buta & Crocker 1993). Multiwavelength studies have shown that these starburst rings have high SF and supernova rates (e.g. Hummel, van der Hulst & Keel 1987, hereafter H87; Genzel et al. 1995).
The circumnuclear SF rings are thought to arise as a consequence of a bar–driven gas inflow and dynamical resonances in the bar (e.g. Combes & Gerin 1985; Friedli & Martinet 1993; Piner, Stone & Teuben 1995). Dense gas accumulates in shocked regions of orbit crowding along the leading edges of the bar, loses angular momentum and flows inward. The gas accumulates in a ring between the two inner Lindblad resonances (ILR) and experiences a starburst, either through collisions of molecular clouds or by gravitational collapse of the ring into dense fragments (e.g. Combes & Gerin 1985; Elmegreen 1994). If no ILRs exist, the gas may continue to flow inward, resulting in a nuclear starburst without a ring (Telesco, Dressel & Wolstencroft 1993).
Although there are plenty of examples of nuclear ring galaxies without nuclear activity, suggesting that the nuclear rings and active galactic nuclei (AGN) are not necessarily intimately related, there is, however, an indicative statistical correlation between the existence of nuclear rings and AGN in barred galaxies (Knapen et al. 1999). One of the most important questions concerning the nuclear rings is, therefore, that of fuelling of the AGN in their centers. Since the large–scale flow slows down substantially at the ILR ring, additional mechanisms, such as bar instability within a central gas disk (′bars within bars′; Shlosman, Frank & Begelman 1989), have been suggested to fuel the AGN.
Multiwavelength studies of AGN with circumnuclear rings can provide insights into how the massive star clusters in the rings and nuclear activity are related. The relatively unobscured near–infrared (NIR) emission provides a better handle than optical emission to quantify the properties of SF in galaxies. In this paper we present high resolution broad–band images and the first NIR Br and H2 1–0 S(1) emission line images of two active galaxies with a circumnuclear SF ring, NGC 1097 and NGC 6574. Because of their brightness, large angular size and relatively face–on orientation, they provide excellent targets for studying these phenomena. Br originates from H II regions surrounding hot young OB star clusters, while H2 arises from hot molecular gas and traces the material available for SF.
NGC 1097 is a nearby (vsys = 1275 km s-1; Mpc; 1′′ = 90 pc; H 70 km s-1 Mpc-1) SBb galaxy with a strong bar (), inclined at 46∘ (Storchi–Bergmann, Wilson & Baldwin 1996). Non–thermal emission due to shock compression of gas and dust associated with the smooth thin dust lanes at the leading edges of the bar is clearly visible in radio continuum (Ondrechen & van der Hulst 1983). NGC 1097 has an elliptical companion galaxy, NGC 1097A, which influences the western spiral arm by tidal interaction (e.g. Ondrechen, van der Hulst & Hummel 1989). NGC 1097 contains a nuclear stellar bar (; Quillen et al. 1995), almost perpendicular to the primary bar. Based on optical emission line ratios, the nucleus of NGC 1097 is usually classified as a LINER (Phillips et al. 1984) although the detection of broad, double peaked H emission (Storchi–Bergmann et al. 1993) suggests a revised classification as a Seyfert 1.
The most intriguing feature of NGC 1097 is the bright, almost circular circumnuclear SF ring (diameter 18′′ = 1.6 kpc), which actually consists of two tightly wound clumpy spiral arms. It has been the target of extensive multiwavelength studies (e.g. H87; Gerin, Nakai & Combes 1987: Telesco et al. 1993; Barth et al. 1995; Quillen et al. 1995; Pérez–Olea & Colina 1996; Storchi–Bergmann et al. 1996). According to Storchi–Bergmann et al. (1996), the ring of NGC 1097 is situated between the two ILRs associated with the primary bar potential, in agreement with numerical simulations (Piner et al. 1995).
NGC 6574 is a little studied SABbc spiral galaxy at vsys = 2282 km s-1 ( Mpc; 1′′ = 160 pc). It is inclined at 40∘ and is not strongly interacting with any other major galaxy, as evidenced by the symmetric rotation curve (Demoulin & Chan 1969). Its nucleus is classified as a Seyfert 2. Around the nucleus, there is an SF region consisting of spiral arms in the form of a wide pseudoring. This ring contains 30 H emission regions (González–Delgado et al. 1997).
This paper is arranged as follows. In Section 2 we discuss the observations, data reduction and the evolutionary model used. In Sections 3 and 4 we discuss the morphology of the circumnuclear rings, determine the extinctions to the SF complexes from comparison of the recombination line strengths, and constrain their SF properties, stellar populations and SF history by a detailed comparison among the NIR tracers and with the radio emission. We also discuss the origin of the H2 emission in the ring. General discussion and conclusions are presented in Section 5.
2 Observations, data reduction and the evolutionary model
2.1 Observations
The observations of the Br 2.1661 m and H2 1–0 S(1) 2.121 m emission lines and the bands were carried out in September 1998 with the 3.8 m United Kingdom Infrared Telescope (UKIRT) on Mauna Kea, Hawaii, under FWHM 06–07 seeing. We used the 256256 px IRCAM3 camera, with pixel size 0281 px-1 and field of view . For the emission line observations, we used cooled ( 77 K) narrow–band filters and a Fabry–Perot (F–P) etalon with spectral resolution 400 km s-1 and equivalent width (EW) 0.0038 m.
For both emission lines, five 60 sec observations were made at each on–line (OL) wavelength and at the nearby blue (BC) and red (RC) continuum, shifted with respect to the line centre by km s-1, following the sequence OL–BC–OL–RC and moving the telescope by 10′′ in a five point grid between the individual integrations for sky subtraction. This sequence was repeated until a sufficent on–line integration time was achieved. For the –bands, five 30 sec integrations were made both centered on the galaxy and on sky 5′ east. The total integration times for the –bands and for the Br and H2 emission lines are 150, 1800 and 2400 sec (NGC 1097) and 150, 2400 and 2400 sec (NGC 6574). Faint standard stars were observed in both broad–band and narrow–band filters immediately after the galaxy observations at similar airmass.
2.2 Data reduction
IRAF111IRAF is distributed by the National Optical Astronomy Observatories, which are operated by the Association of Universities for Research in Astronomy, Inc., under cooperative agreement with the National Science Foundation. was used to reduce the observations. The line images were divided by a flatfield made from linearized galaxy images, and sky–subtracted using the median of the five images at the same wavelength. These images were then aligned by using the nuclear position as reference, and merged into one on–line image and two continuum images. The alignment of the images is accurate to within a fraction of a pixel. Finally, the continuum images were scaled with the continuum/line ratio measured from a standard star, combined, and subtracted from the on–line images, and the final line images were flux calibrated against the spectral type A standard stars HD 1160 (MK = 7.040) and HD 201941 (MK = 6.626). The reduction of the broad–band images consisted of linearization, flatfielding using a sky flat, and sky subtraction using the median of five sky images. UKIRT faint standard stars FS 29 and FS 35 were used to flux calibrate the broad–band images.
The sensitivity of the F–P is a function of both the line–of–sight (l.o.s.) velocity of the galaxy and the shift in the transmitted wavelength of the F–P over the field of view. These effects were corrected for by dividing the measured fluxes by an inverse Airy function (see e.g. Bland–Hawthorn 1995). For NGC 1097, a high resolution l.o.s. velocity field exists (Storchi–Bergmann et al. 1996). The only available l.o.s. velocity data for NGC 6574 were published by Demoulin & Chan (1969), who find the velocity to be constant to within 20 km s-1 at distances 6′′–18′′ from the nucleus, i.e. encompassing the ring. Therefore, we have assumed that the velocity depends only on the angle with respect to the line of nodes and the inclination. According to Demoulin & Chan (1969), the rotational amplitude is 240 km s-1, inclination 40∘ and the position angle PA = 159∘. Using these values, we have estimated the velocity field in the SF ring. In the nucleus, we assumed the l.o.s. rotational velocity to be 0 km s-1.
The emission linewidths would also need to be considered. This would, however, require information about the line profiles in different parts of the rings, which is not available. However, usually the spectral lines are rather narrow, and this correction is likely to be small. In this paper, the emission line images have not been corrected for by the inverse Airy function, because then noise would depend on the position in the image. However, the observed emission line fluxes have been corrected for this effect. The observed line emission is weak, so to enhance the S/N, all images were smoothed to 1′′ resolution.
Photometry in all bands was performed at the location of the detected Br emission regions. The aperture used for each region was selected to include as much as possible of the radiation, while avoiding overlap with neighbouring regions. The smallest distance between the nearest emission regions in these galaxies is 2′′, which is larger than the resolution of the smoothed images (1′′) and much larger than the seeing during the observations (06). The observed fluxes were corrected for Galactic extinction (de Vaucouleurs et al. 1991) and redshift (K–correction). We estimate a photometric accuracy in the magnitudes of 0.03 mag, in the colours of 0.05 mag, and in the emission line fluxes of 10 %.
2.3 Extinction
Optical observations of starburst regions are much more hampered by the large and spatially variable extinction than observations in the NIR (AK 0.1 AV). The derived extinction depends on the assumed geometry of the absorbing dust with respect to the emission region. In this paper we assume for the sake of simplicity and for easy comparison with previous determinations, the case of a foreground screen of dusty cloud filaments. The true dust distribution is, however, probably clumpy and mixed with the star clusters, resulting in a somewhat larger extinction. Therefore, the derived extinction values should be treated as approximations only. Note that the exact value of extinction does not affect the EWs of the emission lines, if the differential extinction between the lines and the continuum is small, as is usually the case in the NIR (Calzetti 1997 and references therein). Assuming standard interstellar dust properties, case B recombination (intrinsic ; Osterbrock 1989), and the Landini et al. (1984) interstellar extinction curve, , extinction towards the ionized sources can be determined from the observed Br and H fluxes.
This extinction strictly refers only to the ionized gas. The extinction experienced by the continuum can be estimated by comparing the observed broad–band colours of the emission regions to the average colours of normal unobscured spiral galaxies ( = 0.75, = 0.22; Glass & Moorwood 1985). This method, however, may be biased toward low extinction regions, as the most heavily reddened regions may not be detectable in the images. Also, the intrinsic colours of the galaxies may be bluer than in normal galaxies, leading to an underestimation of the continuum extinction.
2.4 The evolutionary Model
To interpret the SF properties, we have used the stellar population synthesis model of Leitherer et al. (1999; hereafter L99), which employs the latest stellar evolutionary tracks (e.g. Charbonnel et al. 1999) and stellar atmosphere models (e.g. Lejeune, Buser & Cuisinier 1997). It predicts the evolution of a large number of NIR, optical and UV spectral features as a function of the burst age, metallicity, and the initial mass function (IMF) with lower and upper mass cutoff and slope , for the limiting cases of instantaneous burst of SF (ISF) and constant SF rate (CSFR).
The EW of Br, which is sensitive to the age of the starburst, was estimated by subtracting a de Vaucouleurs bulge model (depicting the old stellar population) from the –band image and dividing the Br fluxes with the remaining –band fluxes. The L99 models predict the number of ionizing photons below 912 Å, N(H0), which can also be estimated from the Br flux as N(H0) = 7.63 1013LBrγ[erg s. N(H0) allows us to evaluate the mass of recently formed stars (in ISF) or the SF rate (SFR) via an assumed IMF (in CSFR). N(H0) can also be estimated from the thermal radio emission (Condon & Yin 1990): N(H0) = 7.1 1049 D2 T Sth, where D is the distance in Mpc, is the frequency in GHz, is the electron temperature in 104 K and is the thermal radio flux density in mJy. The supernova (SN) rate predicted by the L99 models can be compared with the rate derived from non–thermal radio emission (Condon & Yin 1990; based on Galactic SNe): LNT 1.31023 vSN, where is the non–thermal radio luminosity in W Hz-1, is the frequency in GHz, is the spectral index of non–thermal radiation and vSN is the SN rate in yr-1.
Since we do not have enough data for more detailed modelling, and to allow an easy comparison with properties derived by previous authors, we assume solar metallicity, = 2.35, and consider two models in what follows: (1) ISF with = 100 M⊙ and (2) CSFR with = 30 M⊙. Note that our general conclusions remain unchanged if one uses other evolutionary models, e.g. those of Cervino & Mas–Hesse (1994) or Lancon & Rocca–Volmerange (1996). However, the exact age of the starburst strongly depends on the chosen burst duration and IMF.
3 Results
3.1 NGC 1097
3.1.1 Morphology
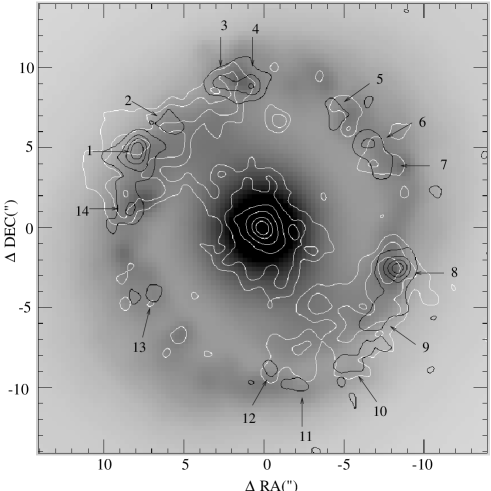
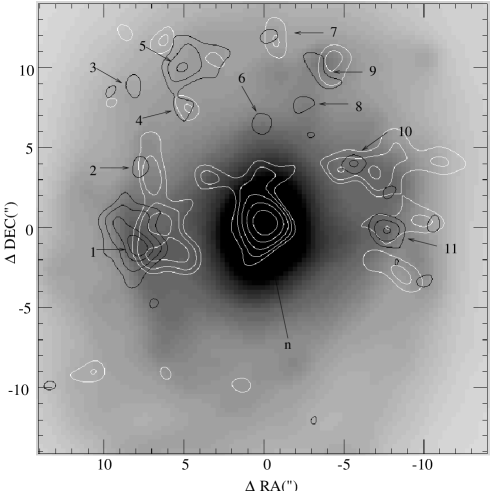
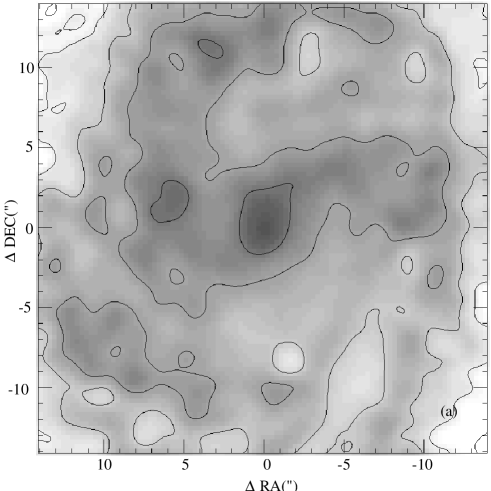
We have detected 14 emission regions at higher than 3 level in the Br emission line image of NGC 1097 (Fig. 1). There is quite good spatial correspondence between the brightest regions in the Br and radio emission (H87; their Fig. 3). Because the non–thermal radio emission is believed to arise in SN remnants and the thermal radio emission to be reradiated UV emission from OB stars (e.g. Condon 1992), this correspondence is not surprising. The detailed differences between radio and Br can be explained as a difference in the ages of the emitting regions, indicating several SF generations (see also e.g. NGC 7771, Reunanen et al. 1999). In the – colour map (Fig. 2), the radio peaks correspond quite well to the reddest – colours. The ring is considerably redder than its surrounding region. Possible explanations for this are emission from hot dust and red supergiants (RSG), or spatially variable extinction. The nucleus is also redder than the galaxy.
There is quite good spatial correlation between the H (H87; their Fig. 5) and the Br emission, indicating that the effect of extinction is not severe in NGC 1097 (see also Section 3.1.2). The worst correspondence is toward southeast of the nucleus. Based on radio and H, one would expect a Br emission region between the regions 12 and 13, which is, however, not detected. This region has the largest F–P correction factors, and it is possible that a Br emission region exists there, but such a large fraction of the emission is shifted outside the F–P filter that it remains below our detection limit.
The correspondence between the H2 and the Br emission (Fig. 1) is not as good as between H and Br. The clearest difference is in the nucleus, which has strong resolved H2 emission, but no detected Br emission (see Section 3.1.3). We derive a nominal upper limit to the nuclear Br emission of erg s-1 cm-2 in a 4′′ diameter aperture. In the circumnuclear region, the H2 emission defines a broadly similar ring to Br, but there are differences in the detailed morphology.
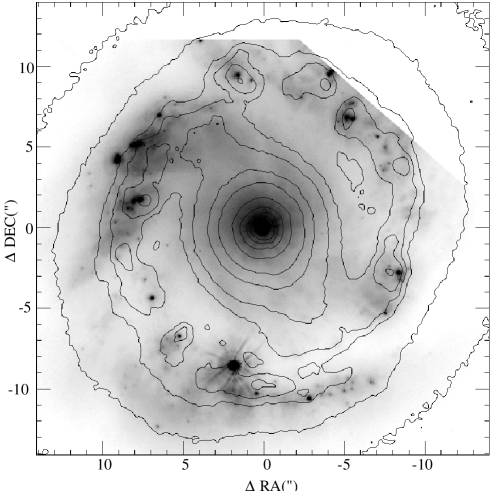
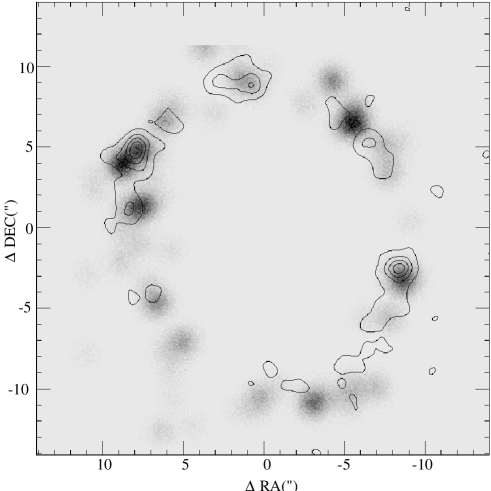
Barth et al. (1995) observed NGC 1097 with the Hubble Space Telescope (HST) and resolved the hot spots in the ring into 88 star clusters. In Fig. 3 we show their –band image overlaid in contours by our –band image, and in Fig. 4, the Br emission in contours is overlaid on the –band image, which was Gaussian smoothed to the same resolution as Br . The effective radius of the brightest star clusters in the –band, = 3–7 pc, indicates that they represent individual SF regions. There is no perfect correlation between them and the Br regions, although most Br regions have a reasonably nearby –band counterpart. There are differences especially in the north, where some Br regions are situated in the –band minima. Neither is there a perfect spatial correspondence between Br and –band (Fig. 1), although some Br regions (e.g. region 8) have a clear counterpart in the –band. In many regions, however, there is overlap between the – and –bands and the Br .
The differences between Br, radio, – and –bands can be explained by differences in the age of the emission regions. The –band peaks are probably younger than those in the –band, since it takes 3–4 Myr before the emergence of the first RSGs that dominate the –band emission. Less likely, the –band peaks may either be regions of low extinction, or young dusty SNe.
3.1.2 Star formation properties
| Observed emission | Dereddened emission | |||||||||||
|---|---|---|---|---|---|---|---|---|---|---|---|---|
| n | ap | corra | Br | H2 | J–H | H–K | AVb | Br | H2 | J–H | H–K | |
| ′′ | 10-15 ergs s-1 cm-2 | mag | mag | mag | 10-15 ergs s-1 cm-2 | mag | mag | |||||
| 1 | 3.4 | 1.12 | 4.43 | 2.68 | 0.69 | 0.28 | 1.0 | 4.76 | 2.88 | 0.61 | 0.58 | 0.23 |
| 2 | 2.0 | 1.01 | 0.68 | 0.72 | 0.70 | 0.26 | 1.1 | 0.74 | 0.78 | 1.05 | 0.58 | 0.20 |
| 3 | 1.7 | 1.62 | 1.59 | 0.67 | 0.74 | 0.34 | 1.3 | 1.75 | 0.74 | 0.42 | 0.60 | 0.27 |
| 4 | 1.7 | 1.69 | 1.87 | 0.46 | 0.72 | 0.37 | 1.3 | 2.06 | 0.50 | 0.25 | 0.59 | 0.30 |
| 5 | 2.0 | 1.71 | 0.90 | 0.51 | 0.74 | 0.30 | 1.2 | 0.98 | 0.56 | 0.58 | 0.61 | 0.23 |
| 6 | 1.4 | 1.75 | 1.05 | 0.34 | 0.72 | 0.30 | 1.5 | 1.31 | 0.37 | 0.32 | 0.57 | 0.22 |
| 7 | 1.4 | 1.81 | 0.78 | 0.51 | 0.74 | 0.31 | 1.5 | 0.87 | 0.57 | 0.63 | 0.58 | 0.23 |
| 8 | 3.4 | 1.17 | 2.96 | 2.68 | 0.79 | 0.32 | 1.8 | 3.39 | 3.06 | 0.91 | 0.61 | 0.22 |
| 9 | 3.4 | 1.06 | 1.09 | 1.84 | 0.78 | 0.31 | 1.5 | 1.22 | 2.06 | 1.70 | 0.62 | 0.23 |
| 10 | 3.4 | 1.06 | 0.85 | 1.16 | 0.79 | 0.33 | 1.2 | 0.93 | 1.27 | 1.36 | 0.66 | 0.27 |
| 11 | 2.0 | 2.04 | 0.81 | 0.43 | 0.78 | 0.33 | 0.1 | 0.82 | 0.43 | 0.52 | 0.74 | 0.32 |
| 12 | 2.0 | 1.98 | 0.71 | 0.73 | 0.81 | 0.37 | 0.3 | 0.73 | 0.75 | 1.04 | 0.76 | 0.35 |
| 13 | 3.4 | 3.29 | 2.86 | 1.01 | 0.76 | 0.34 | 2.2 | 3.37 | 1.20 | 0.36 | 0.55 | 0.21 |
| 14 | 3.4 | 1.79 | 3.57 | 2.74 | 0.70 | 0.27 | 2.2 | 4.21 | 3.24 | 0.77 | 0.48 | 0.15 |
| nucl | 1.7 | 1.07 | 0.15 | 2.68 | 0.84 | 0.34 | 17.9 | |||||
a: Correction factor for the velocity field and the change of wavelength
across the array.
b: Determined from the H/Br ratio, assuming (Landini et al. 1984).
In Table 1 we give for the 14 Br emission regions the aperture diameter in arcsec, the calibration coefficient from the Airy function, the Br and H2 fluxes, and the colours. The smallest values of FWHM correspond to a size of the emitting region of 08 (70 pc). Therefore, the emission regions detected in the NIR actually are conglomerates of several OB associations and giant molecular clouds (c.f. pc; Barth et al. 1995), probably similar to scaled–up versions of the 30 Dor H II region in the LMC (e.g. Walborn et al. 1999).
Evans et al. (1996) gave for the H emission regions in NGC 1097 the fluxes in instrumental units, but did not report the transformation coefficient into physical units. We have, therefore, calibrated the Evans et al. image using the lower resolution H image (H87) which, however, partly includes upper limits. Following the method outlined in Section 2.3., we derive for the emission regions in NGC 1097 extinctions = 0.1–2.2 (average = 1.3). H87 derived, based on HH, for the eastern ( region 1) and western ( region 8) parts of the ring extinctions and , respectively. Other extinction determinations for NGC 1097 include average AV = 1.1 for the ring (Barth et al. 1995), and AV = 0.6–3.0 for various parts of the ring (Walsh et al. 1986). Our extinction determination is in good agreement with previous results, while the large spread between the emission regions indicates large spatial variation in the extinction within the ring. The extinction–corrected fluxes of the Br emission regions are given in Table 1.
The H2/Br ratio gives important clues about the excitation mechanism(s) of the hot molecular gas (Puxley, Hawarden & Mountain 1990). The main mechanisms suggested are thermal excitation in hot gas by low velocity shocks (e.g. Draine, Roberge & Dalgarno 1983) or by intense X–ray radiation (e.g. Maloney, Hollenbach & Tielens 1996), and fluorescent excitation by strong UV radiation (e.g. Black & van Dishoeck 1987). The observed H2/Br ratios for NGC 1097 (0.25–1.70, average 0.75) can mainly be explained with UV excitation by young stars (H2/Br; Puxley et al. 1990). In the regions where the ratio is larger than 0.9, the density of the gas clouds may be greater, the upper mass cutoff higher, or there may be a contribution from shock excitation, possibly due to supernovae. In fact, the regions with the largest H2/Br ratio (regions 2 and 9), are located at the opposite ends of the bar. This agrees well with the idea of a propagating starburst (e.g. Rieke et al. 1993), where SF begins in the nucleus and propagates into the ends of the bar and into the circumnuclear ring through shocks in the bar. Further data, e.g. [FeII] 1.644 m, are required to confirm the excitation mechanism(s).
| instantaneous star formation | constant star formation rate | |||||||||
|---|---|---|---|---|---|---|---|---|---|---|
| n | N(H0) | EW | age | mass | SFRa | vSN | age | massb | SFR | vSN |
| 1052 s-1 | Å | Myr | 106 M⊙ | M⊙ yr-1 | 10-3 yr-1 | Myr | 106 M⊙ | M⊙ yr-1 | 10-3 yr-1 | |
| 1 | 2.82 | 30.3 | 6.23 | 6.56 | 0.95 | 6.4 | 9.56 | 3.0 | 0.31 | 1.0 |
| 2 | 0.44 | 8.5 | 6.63 | 1.74 | 0.26 | 1.6 | 49.2 | 2.3 | 0.05 | 1.0 |
| 3 | 1.04 | 19.8 | 6.36 | 3.06 | 0.48 | 2.9 | 11.4 | 1.3 | 0.11 | 0.6 |
| 4 | 1.22 | 20.2 | 6.35 | 3.53 | 0.56 | 3.3 | 11.3 | 1.5 | 0.13 | 0.6 |
| 5 | 0.58 | 11.7 | 6.53 | 2.08 | 0.32 | 1.8 | 24.9 | 1.6 | 0.07 | 0.9 |
| 6 | 0.78 | 18.9 | 6.37 | 2.33 | 0.37 | 2.2 | 11.7 | 1.0 | 0.09 | 0.5 |
| 7 | 0.52 | 12.3 | 6.51 | 1.82 | 0.28 | 1.6 | 22.6 | 1.3 | 0.06 | 0.7 |
| 8 | 2.01 | 16.8 | 6.40 | 6.39 | 1.00 | 6.0 | 12.8 | 2.8 | 0.22 | 1.3 |
| 9 | 0.72 | 8.1 | 6.65 | 2.99 | 0.45 | 2.8 | 56.2 | 4.4 | 0.08 | 1.5 |
| 10 | 0.55 | 8.1 | 6.65 | 2.29 | 0.34 | 2.1 | 56.2 | 3.4 | 0.06 | 1.1 |
| 11 | 0.49 | 10.6 | 6.57 | 1.79 | 0.27 | 1.6 | 30.0 | 1.6 | 0.05 | 0.8 |
| 12 | 0.43 | 12.1 | 6.52 | 1.72 | 0.26 | 1.5 | 23.3 | 1.1 | 0.05 | 0.6 |
| 13 | 2.00 | 19.8 | 6.36 | 5.89 | 0.93 | 5.6 | 11.4 | 2.5 | 0.22 | 1.1 |
| 14 | 2.50 | 14.3 | 6.46 | 8.51 | 1.32 | 7.8 | 16.0 | 4.4 | 0.28 | 2.2 |
| total | 51.0 | 7.8 | 47.0 | 32.2 | 1.8 | 10.0 | ||||
a: Mass divided by age
b: SFR multiplied by age
We have determined the SF properties of NGC 1097 by comparing the observed quantities with the L99 models (Table 2). The Br EWs are small (8.1–30 Å, average 15 Å). Assuming the CSFR model with M M⊙, we derive very long ages for the burst, up to 1 Gyr, which are inconsistent with the clumpy –band morphology of NGC 1097. During such a long time, these irregularities would have had time to smooth out. Also, the lifetime of individual giant molecular clouds in our Galaxy is only 20–40 Myr, after which turbulence and heating from SNe disrupt them and inhibit further SF (Blitz 1991). Finally, gas consumption during such a long time with high mass SF would by far exceed the theoretical mass inflow rate into a circumnuclear ring (Piner et al. 1995). On the other hand, assuming a reduced upper limit to the mass function, M M⊙, we derive a much lower duration, 9.6–56 Myr, for the SF. The corresponding SFR is 0.05–0.31 M⊙ yr-1 (average 0.13 M⊙ yr-1, total within the ring 1.8 M⊙ yr-1) and SN rate is 0.5–2.2 yr-1 (average 1.0 yr-1, total within the ring 1.4 yr-1).
Assuming the ISF model, we derive even shorter ages, 6.2–6.7 Myr. The corresponding masses of the emission regions are 1.7–8.5 M⊙ (average 3.6 M⊙, total within the ring 5.1 M⊙) and the SN rate is = 1.5–7.8 yr-1 (average 3.4 yr-1, total 4.7 yr-1). The total mass of the hot gas, although large, is still only a small fraction of both the total stellar mass in the ring, 1 109 M⊙ (Quillen et al. 1995) and the total molecular gas mass, M(H2) = 1.3 109 M⊙ (Gerin et al. 1987).

The reliability of conclusions based on colours is reduced by our incomplete knowledge of the evolution and properties of RSGs (Origlia et al. 1999). The hot spots in the SF ring of NGC 1097 are much redder than their environment, although young stars ( Myr) should be blue. Only when the RSGs appear ( Myr), the colours become redder. Fig. 5 shows the – and – colour diagram of the Br emission regions in NGC 1097, including the average – and – colours of normal unobscured spiral galaxies, and the effect of emission from hot dust at various temperatures. The extinction–corrected colours agree rather well with the L99 evolutionary model. The differences of the – colour with respect to the L99 model can be explained by assuming on average 20 % fractional contribution to the –band emission from moderately hot dust. The – colour resembles the colour of a 8–9 Myr, not 6 Myr, old ISF model. These ages, however, agree quite well, because the ISF model gives in fact a lower limit to the age of the burst, as the burst is not instantaneous, but it has a short, finite duration (shorter than the lifetime of the forming stars; a few 106 yr). Furthermore, the NIR colours may be contaminated by older starburst generations.
| na | nb | S4.885GHz | Sth/Stot | Sth | vSN | N(H0)c | |
|---|---|---|---|---|---|---|---|
| mJy | mJy | 10-3 yr-1 | 1052 | ||||
| 1 | 3 4 | 5.36 | -0.46 | 0.56 | 3.0 | 2.4 | 8.3 |
| 2d | 2 | 2.66 | -0.58 | 0.37 | 1.1 | 1.7 | 2.7 |
| 3 | 1 | 3.34 | -0.58 | 0.37 | 1.1 | 2.2 | 3.4 |
| 4d | 14 | 1.76 | -0.97 | 1.8 | – | ||
| 5 | 13 | 5.36 | -0.54 | 0.44 | 2.3 | 3.1 | 6.5 |
| 6 | – | 5.44 | -0.62 | 0.30 | 1.5 | 3.9 | 4.6 |
| 7 | 12 | 3.86 | -0.67 | 0.21 | 0.8 | 3.1 | 4.6 |
| 8 | 8 | 5.74 | -0.53 | 0.45 | 2.6 | 3.3 | 7.1 |
| 9d | – | 2.66 | -0.76 | 0.02 | 2.8 | – | |
| 10 | 6 7 | 4.31 | -0.51 | 0.48 | 2.3 | 2.3 | 5.7 |
| total | 26.6 | 43 |
a: Labeling by Hummel et al. (1987)
b: The nearest Br emission region
c: Determined assuming
d: Between the 1.465 GHz radio emission regions
Table 3 gives information about the radio emission in NGC 1097 (from H87), from which we have estimated the number of ionizing photons N(H0) and the SN rate . Most radio emission regions in NGC 1097 are dominated by non–thermal emission (on average 2/3 of the total). The total SN rate derived from the non–thermal radio emission is 0.053 yr-1, which is in reasonable agreement with the value derived from Br, 0.099 yr-1. The latter value depends, however, on the adopted IMF parameters and . The N(H0) derived from the Br emission is s-1, whereas N(H0) derived from the thermal 4.885 GHz radio emission is s-1. Note that an even larger difference between the N(H0) derived from radio and Br was found for the starburst galaxy with a circumnuclear ring, NGC 7771 (Reunanen et al. 1999). For NGC 7771, we suggested that the fraction of the thermal radio emission had been overestimated, and the same may be applicable to NGC 1097.
The radio spectral index of NGC 1097 is between –0.46 and –0.97 within the ring (H87). According to the model of Mas–Hesse & Kunth (1991), the spectral indices observed for NGC 1097 are typical for an ISF of 5–9 Myr age. For the CSFR model, the steepest possible spectral index is –0.25. This strongly supports the conclusion that the ISF model is more likely to be applicable to NGC 1097. Further support for this comes from the clumpy –band morphology (see above).
3.1.3 Nuclear emission
No Br emission was detected in the nucleus of NGC 1097, suggesting that it does not contain large amounts of massive young stars. The nucleus, however, is a strong source of H2 emission (L(H2) = 1.3 105 L⊙ in 10′′ aperture), implying abundant fuel for SF. This is supported by the nuclear colours, which are much redder than the colours of the bulge and resemble the colours of the ring. The simplest explanation for these colours is the presence of hot dust coexisting with the dense molecular gas.
The nuclear source of H2 emission in NGC 1097 (Fig. 1) has a FWHM 094 (85 pc). Comparing this with the Gaussian FWHM resolution of the image (065), we derive for the true extent of the resolved nuclear source 07 (65 pc). The PA of the resolved H2 emission is 50∘, whereas the PA of the stellar –band bar is . Therefore, the H2 emission is nearly elongated along but leading the stellar bar. Although kinematical data are required to verify its reality, the H2 emission probably is in the form of a gaseous nuclear bar, and it appears that gas is flowing into the nucleus along the nuclear bar. Since the ellipticity of the isophotes is much larger in the H2 than in the –band, the gaseous H2 bar is narrower than the stellar bar.
The average surface brightness of the nuclear H2 emission in a 4′′ (360 pc) aperture is 2.1 10-8 W cm-2 sr-1. Following the method of Meaburn et al. (1998), we derive 120 M⊙ for the mass of the excited H2. This value should be multiplied by an unknown but probably small factor for the linewidth, which may be broader than the width of the F–P passband (see Section 2.2). The resulting mass, M 120 M⊙, is similar to those derived for the Seyfert galaxies NGC 3079 (800 M⊙; Meaburn et al. 1998) and NGC 3227 (250 M⊙; Fernandez et al. 1999). In all cases, the mass of the excited H2 is only a small fraction of the available molecular gas mass.
Because the smallest Br EWs (oldest ages) are found near the ends of the nuclear bar, SF may have commenced in the nucleus (where it has already ended) and propagated into the ring through the nuclear bar. This possibility is also supported by the H2/Br ratios in the ring, which indicate that shocks dominate the excitation of H2 near the ends of the nuclear bar (Section 3.1.2). Similarly, the SN rate/SFR ratio is largest in the hot spots at the ends of the nuclear bar, suggesting that SF there is decaying (i.e. fewer massive stars are produced, while the SN rate continues unchanged). Against the idea of a propagating starburst, we note that there is no strong evidence for recent star formation in the region between the nucleus and the ring either in Br (this work) or in radio and H emission (H87). However, as studies of collisional ring galaxies (e.g. Appleton & Struck-Marcell 1996) and HI supershells (e.g. Ryder et al. 1995 and references therein) have shown, evidence of triggered bursts of massive star formation (e.g. X-rays or [S II] emission from SN remnants) can fade quickly.
Alternatively, the nuclear gaseous/stellar bar found in this study may be driving gas toward the nucleus to fuel the Seyfert. This is suggested by the models of e.g. Pfenniger & Norman (1990) and Friedli & Martinet (1993), in which the nuclear bar decouples from the primary bar and has a higher pattern speed. Such a short–lived (108 yr) nuclear bar would shock the circumnuclear gas at its leading edges, resulting in further gas inflow. The gaseous nuclear bar in NGC 1097 (and in NGC 6574, see Section 3.2.1) adds to the increasing number of such cases known in literature (e.g. NGC 3351, Devereux, Kenney & Young 1992; NGC 1808, Kotilainen et al. 1996; NGC 1068, Davies et al. 1998).
3.2 NGC 6574
3.2.1 Morphology
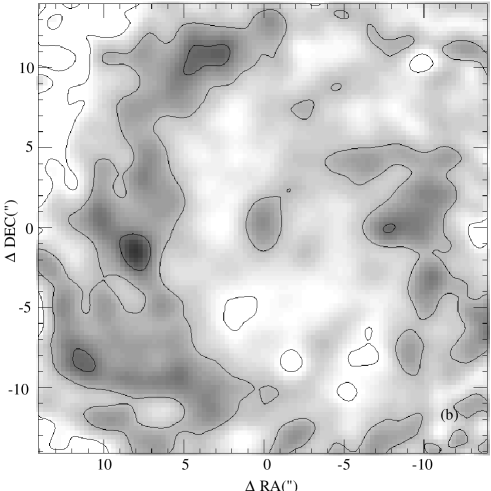
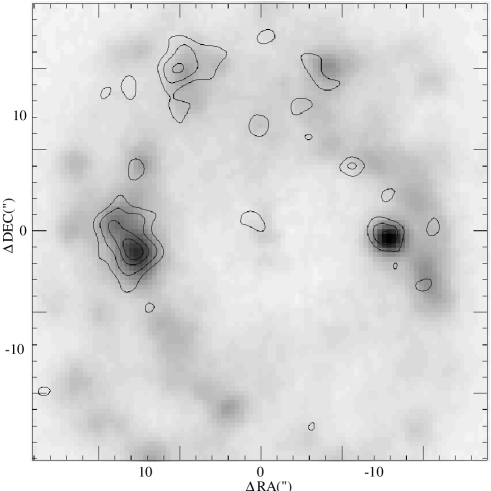
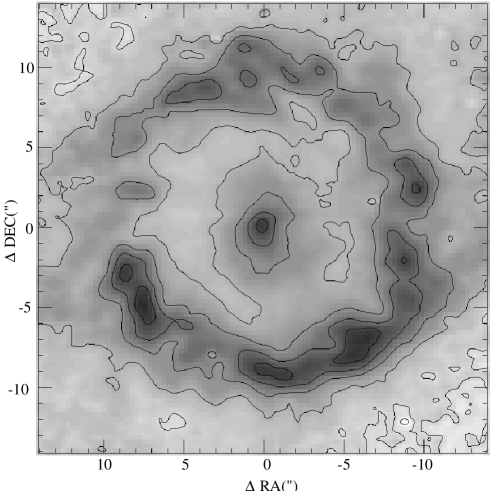
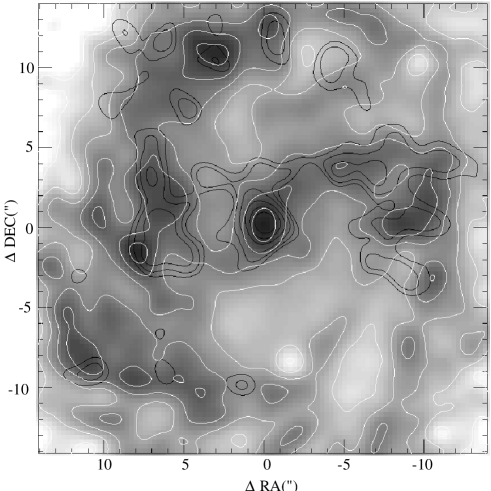
The –band, Br and H2 images of the nuclear region of NGC 6574 are shown in Fig. 6. We have detected 12 regions (including the nucleus) at higher than 3 level in the Br emission. The spiral arms of NGC 6574 are clearly visible in the –band, while the outer bar (PA 105∘) can be seen in the – colour map, but not in the – map (Fig. 7). Fig. 8 shows the H image (from González–Delgado et al. 1997), overlaid in contours with the Br image. Both the Br and H emission regions are located in the spiral arms. Due to the higher S/N, H emission regions are visible all along the spiral arms, whereas only the brightest Br regions can be seen. Many emission line regions have a counterpart in the –band (Fig. 6), but the spatial correspondence is not perfect.
The morphology of the H2 emission is different from that of Br (Fig. 6). East of the nucleus, near the end of the bar, there is the strongest region in both H2 and Br, but the H2 peak is closer to the nucleus. In northeast, Br is strong whereas H2 is weak and diffuse. In the west, both emission lines are situated in the same regions, but H2 is more broadly distributed. To the south of the nucleus there is neither H2 nor Br emission, but this may be an artifact due to the narrow bandwidth of the F–P. The H2 emission is elongated at the ends of the bar perpendicular to the bar. The nucleus is a strong source of H2 emission (L(H2) = 4.6 104 L⊙ in 10′′ aperture), but there is only weak Br emission. The FWHM of the nuclear H2 source is 18 (290 pc), much larger than the seeing FWHM 07. This resolved nuclear H2 emission (Fig. 6) is closely parallel to but leading the nuclear stellar bar visible in the –band (PA 150∘), and probably forms a gaseous nuclear bar. To the northwest and west of the nucleus there is an arc–like region of H2 emission.
The average surface brightness of the nuclear H2 emission in a 5′′ (800 pc) aperture is 2.6 10-9 W cm-2 sr-1. Following the method described in Section 3.1.2, we derive 80 M⊙ for the mass of the excited H2, similar to that derived for NGC 1097 above.
We show the – and – colour maps of NGC 6574 in Fig. 7. Most, but not all, Br emission regions are situated close to the reddest colours. Both colour maps reveal the existence of a small spiral or bar structure around the nucleus. It is situated inside the spiral arms, but does not perfectly follow the morphology of the primary or nuclear stellar bar or the gaseous nuclear bar. In Fig. 9, we show the – colour map, overlaid in black contours by the H2 image. The H2 emission follows the morphology in the – colour map, and it is likely that the spiral/bar structure delineates the inflow route of the gas to the nucleus.
3.2.2 Star formation properties
| Observed emission | Dereddened emission | |||||||||||
|---|---|---|---|---|---|---|---|---|---|---|---|---|
| n | ap | corra | Br | H2 | J–H | H–K | AVb | Br | H2 | J–H | H–K | |
| ′′ | 10-15 ergs s-1 cm-2 | mag | mag | mag | 10-15 ergs s-1 cm-2 | mag | mag | |||||
| 1 | 6.7 | 1.09 | 3.40 | 0.73 | 0.76 | 0.31 | 0.95 | 3.65 | 0.79 | 0.43 | 0.65 | 0.27 |
| 2 | 1.7 | 1.05 | 0.19 | 0.36 | 0.76 | 0.32 | 0.86 | 0.21 | 0.38 | 1.84 | 0.67 | 0.28 |
| 3 | 1.7 | 1.29 | 0.24 | 0.11 | 0.75 | 0.29 | 3.2 | 0.31 | 0.14 | 0.47 | 0.44 | 0.12 |
| 4 | 1.7 | 1.35 | 0.27 | 0.16 | 0.76 | 0.31 | 2.1 | 0.32 | 0.19 | 0.60 | 0.56 | 0.20 |
| 5 | 3.4 | 1.45 | 1.94 | 0.40 | 0.77 | 0.33 | 2.7 | 2.37 | 0.68 | 0.21 | 0.50 | 0.19 |
| 6 | 1.7 | 1.64 | 0.37 | 0.39 | 0.73 | 0.27 | 3.0 | 0.46 | 0.49 | 1.05 | 0.45 | 0.12 |
| 7 | 1.7 | 1.79 | 0.31 | 0.64 | 0.78 | 0.31 | 3.5 | 0.40 | 0.84 | 2.08 | 0.45 | 0.13 |
| 8 | 1.7 | 1.76 | 0.35 | 0.07 | 0.73 | 0.29 | 2.4 | 0.41 | 0.08 | 0.22 | 0.50 | 0.17 |
| 9 | 3.4 | 1.83 | 1.03 | 0.20 | 0.71 | 0.26 | 1.6 | 1.16 | 0.23 | 0.19 | 0.55 | 0.18 |
| 10 | 2.2 | 1.53 | 0.48 | – | 0.78 | 0.30 | 1.8 | 0.55 | – | – | 0.59 | 0.21 |
| 11 | 2.8 | 1.15 | 0.80 | 0.13 | 0.76 | 0.31 | 0.51 | 0.83 | 0.14 | 0.16 | 0.69 | 0.30 |
| nucl | 2.2 | 1.01 | 0.33 | 0.51 | 0.83 | 0.31 | 2.6 | 0.40 | 0.62 | 1.56 | 0.58 | 0.18 |
a: Correction factor for the velocity field and the change of wavelength
across the array.
b: Determined from the H/Br ratio.
The observed results for the Br emission regions in NGC 6574 are given in Table 4. Note that the region marked with nucl is close to but not coincident with the nucleus. Using the H image of NGC 6574 (González–Delgado et al. 1997) and the Br image, we derived extinctions of AV = 0.51–3.5 (average AV = 2.1) for the emission regions. To our knowledge, there are no previous determinations of extinction for the ring of NGC 6574. The observed fluxes of the emission regions were corrected for the extinction, resulting in values listed in Table 4.
The observed H2/Br ratios (0.16–2.1, average 0.73) are very similar to those found for NGC 1097 (Section 3.1.2). In most regions, the dominant excitation mechanism of the molecular gas is UV radiation from hot young stars (Puxley et al. 1990). Only in a few regions, the line ratio can be explained better by shocks.
| instantaneous star formation | constant star formation rate | |||||||||
|---|---|---|---|---|---|---|---|---|---|---|
| n | N(H0) | EW | age | mass | SFRa | vSN | age | massb | SFR | vSN |
| 1052 s-1 | Å | Myr | 106 M⊙ | M⊙ yr-1 | 10-3 yr-1 | Myr | 106 M⊙ | M⊙ yr-1 | 10-3 yr-1 | |
| 1 | 6.94 | 22.54 | 6.32 | 18.79 | 2.97 | 19.3 | 10.71 | 8.20 | 0.77 | 3.2 |
| 2 | 0.39 | 14.81 | 6.44 | 1.31 | 0.20 | 1.2 | 15.02 | 0.64 | 0.04 | 0.3 |
| 3 | 0.58 | 37.36 | 6.15 | 1.20 | 0.20 | 1.1 | 9.01 | 0.58 | 0.07 | 0.2 |
| 4 | 0.60 | 30.91 | 6.22 | 1.37 | 0.22 | 1.3 | 9.51 | 0.63 | 0.07 | 0.2 |
| 5 | 4.50 | 72.24 | 5.81 | 5.82 | 1.00 | 4.9 | 7.93 | 4.01 | 0.51 | 0.9 |
| 6 | 0.88 | 28.04 | 6.26 | 2.14 | 0.34 | 2.1 | 9.82 | 0.96 | 0.10 | 3.3 |
| 7 | 0.76 | 59.36 | 5.89 | 1.17 | 0.20 | 1.0 | 8.21 | 0.70 | 0.09 | 0.2 |
| 8 | 0.79 | 27.66 | 6.26 | 1.92 | 0.31 | 1.9 | 9.87 | 0.86 | 0.09 | 0.3 |
| 9 | 2.20 | 22.12 | 6.33 | 6.08 | 0.96 | 5.8 | 10.82 | 2.63 | 0.24 | 1.0 |
| 10 | 1.04 | 35.21 | 6.18 | 2.24 | 0.36 | 2.1 | 9.15 | 1.06 | 0.12 | 0.4 |
| 11 | 1.58 | 30.49 | 6.23 | 3.67 | 0.59 | 3.6 | 9.54 | 1.67 | 0.17 | 0.6 |
| total | 20.3 | 45.7 | 7.4 | 44.3 | 21.9 | 2.3 | 10.6 | |||
a: Mass divided by age
b: SFR multiplied by age
The Br EWs of NGC 6574 are small (15–72 Å, average 35 Å). Although the EWs are slightly larger than in NGC 1097, even for NGC 6574 a CSFR model with Mu = 100 M⊙ results in unreasonably large ages for the SF (up to 1 Gyr; Table 5). These ages are much smaller (7.9–15 Myr) assuming the CSFR model with a reduced upper limit of the mass function (Mu = 30 M⊙). In this model, the SFR is 0.04–0.8 M⊙ yr-1 (average 0.21 M⊙ yr-1; total within the ring 2.3 M⊙ yr-1) and the SN rate is 0.2–3.3 yr-1 (average 1.0 yr-1; total within the ring 1.1 yr-1). On the other hand, assuming an ISF model with Mu = 100 M⊙, the derived ages are even lower with a small spread, 5.8–6.4 Myr, very similar to those found for NGC 1097. The small range of these ages supports preferring the ISF model, but an unambiguous separation of the models is not possible with the current data. Assuming the ISF model, we derive for the masses of the Br emission regions 1.2–19 M⊙ (average M⊙, total within the ring M⊙) and for the SN rate 1.1–19 yr-1 (average yr-1; total within the ring yr-1). Note that in Table 5, we do not list the values for the nucleus, since due to the weakness of the nuclear Br emission, we could not derive a realistic EW for it after the subtraction of the bulge model.

Fig. 10 shows the – and – colour diagram of the Br emission regions in NGC 6574. The observed – colours are similar to normal unobscured spiral galaxies, but the – colour is slightly redder, probably due to the contribution of hot dust emission. The extinction–corrected colours agree well with the L99 model but, as was found for NGC 1097, they indicate a slightly older population (7.5–8.5 Myr) than that derived from Br. A more physical model (e.g. a short duration or a decaying burst) would probably lead to a better agreement.
4 Discussion
We have studied two active galaxies with circumnuclear SF. NGC 1097 has a clear SF ring, the diameter of which, 1.6 kpc, is typical for the nuclear rings surrounding galactic nuclei (Buta & Crocker 1993). In NGC 6574, the Br emission regions are located in spiral arms, forming a pseudoring. The morphology of the galaxies changes with wavelength. There is a generally good, but not perfect, agreement between the –band and the Br emission. The small differences probably reflect the existence of several SF episodes. Similarly, there is good but not perfect correlation between the H2 and Br morphologies.
For both galaxies, we derived low Br EWs in the cirumnuclear rings. Interpreting these values with a CSFR model and a high upper mass cutoff ( M⊙) of the IMF leads to very old stellar population ages, up to 1 Gyr. Reducing the upper mass cutoff in the CSFR model to M⊙ leads to more physically reasonable ages (9–50 Myr). The ISF model gives similar ages (6–7 Myr) for both galaxies, although there is a large scatter in the masses and SN rates of the emission regions. The small spread in the derived age both between the galaxies and within the emission regions is due to the very rapid decrease in the EW as a function of time in the L99 model at around 6–7 Myr, reflecting the fast evolution of the most massive stars away from the main sequence. It is possible that this similarity is a selection effect, as Br can only reveal SF rings of a certain age. In NGC 1097, the observed radio spectral indices can not be explained in any CSFR model, so in this galaxy SF has already ended. A similar short duration (t 106 yr) SF episode has previously been suggested for e.g. the Seyfert 2 NGC 1068 (Davies et al. 1998), the starburst M82 (Rieke et al. 1993) and for the Galactic center (Genzel, Hollenbach & Townes 1994). Further support for the short ages comes from the NIR broad–band morphology. The –band morphology of NGC 1097 is clumpy, indicating relatively young age as the irregularities have not yet had time to smooth out, and suggesting the presence of RSGs.
NGC 6574 has only a weak source of Br emission in the nucleus, while no Br was detected in the nucleus of NGC 1097. Either there is no SF in the nucleus, or it is too old to be detectable in Br. This situation agrees with the model of a propagating starburst, which has been suggested for e.g. Circinus (Maiolino et al. 1998), M82 (Satyapal et al. 1997) and IC 342 (Böker, Förster–Screiber & Genzel 1997). In this model, SF has either commenced from the nucleus, and propagated into the ring through shocks in the bar, or it has started at the ends of the bar and propagated elsewhere into the ring. Both galaxies have strong resolved nuclear H2 emission. It is thus also conceivable that SF in the nucleus is prohibited and gas falls directly to the nucleus to fuel and obscure the AGN. Finally, a possible selection effect may explain the lack of observed SF in the nucleus, since if all rings are of roughly similar age, the nucleus may always be either too young or too old to produce a detectable amount of Br emission.
The observed H2/Br ratios in both galaxies show a large spread. The dominant excitation mechanism of the gas appears to be UV radiation from hot young stars. The largest ratios in NGC 1097 are found at the ends of the bar, indicating a contribution from shock excitation and supporting the model of a propagating starburst.
The number of ionizing photons N(H0) derived for NGC 1097 from thermal radio emission is much larger than that derived from Br . This difference is unlikely to be caused by an incorrect determination of the radio spectral index, since the SN rate derived from non–thermal radio emission is in good agreement with that predicted by the L99 model. Either there exists thermal radio emission independently of SF, or the optical depth of Br is large enough to allow the escape of only 10%–20% of the radiation from the emission regions. This would, however, indicate very large values of extinction AV, which are not supported by the colours.
Smith et al. (1999) proposed that the morphology of the circumnuclear ring reflects the mechanism which fuels the active nucleus. It is therefore instructive to compare the results found for NGC 1097 and NGC 6574 with other galaxies with circumnuclear rings with published Br imaging. These include NGC 7771 (Reunanen et al. 1999), NGC 1808 (Kotilainen et al. 1996), NGC 7552 (Schinnerer et al. 1997), NGC 1068 (Davies et al. 1998) and NGC 7469 (Genzel et al. 1995). There is no strong correlation between the ring morphology and the strength of the nucleus. The circumnuclear morphology of NGC 7771 is much clumpier than that of NGC 7552, while neither contains an AGN, but a nuclear starburst. NGC 1808 has a nuclear starburst with a possible weak Seyfert, and its morphology is rather smooth. The circumnuclear ring of NGC 1097 with a weak Seyfert/LINER nucleus is very clumpy, while the rings in the strong Seyferts NGC 6574 and NGC 7469 are rather smooth. Finally, NGC 1068 with a strong Seyfert nucleus has a clumpy ring morphology.
A stronger inverse correlation is, on the other hand, found between the strength of the AGN and the strength of the bar. All three galaxies with a strong AGN (NGC 1068, NGC 6574 and NGC 7469) have a rather weak primary bar, whereas the four galaxies with a strong bar (NGC 1097, NGC 1808, NGC 7552 and NGC 7771) have either a weak or no AGN. This relationship agrees with the paucity of strong nuclear bars in AGN (Regan & Mulchaey 1999) and argues against the ′bars within bars′ scenario (Shlosman et al. 1989) as the primary fuelling mechanism of nuclear activity. However, Seyfert galaxies have large–scale bars more often than non–active galaxies (Knapen et al. 1999), therefore a much larger sample of barred galaxies with circumnuclear rings is needed to study the implications of this correlation for the fuelling of AGN.
Acknowledgements.
The United Kingdom Infrared Telescope is operated by the Joint Astronomy Centre on behalf of the U.K. Particle Physics and Astronomy Research Council. Thanks are due to Tom Geballe and Thor Wold for assistance during the observations, and to Rosa González–Delgado for kindly making the NGC 6574 H image available to us. This research has made use of the NASA/IPAC Extragalactic Database (NED), which is operated by the Jet Propulsion Laboratory, California Institute of Technology, under contract with the National Aeronautics and Space Administration.References
Appleton P.N., Struck-Marcell C., 1996, Fund. Cosmic Phys. 16, 111
Barth A.J., Ho L.C., Filippenko A.V., Sargent W.L.W., 1995, AJ 110, 1009
Black J.H., van Dishoeck E.F., 1987, ApJ 322, 412
Bland–Hawthorn J., 1995, In: Comte G., Kylafis N. (eds.) ASP Conf. Ser. 71, Tridimensional optical spectroscopic methods in astrophysics, ASP, San Francisco, p. 72
Blitz L., 1991, In: Lada C., Kylafis N. (eds.) ASI Series 342, The Physics of Star Formation and Early Stellar Evolution, Kluwer Academic Publishers, Dordrecht, p. 3
Buta R., Crocker D.A., 1993, AJ 105, 1344
Böker T., Förster–Schreiber N.M., Genzel R., 1997, AJ 114, 1883
Calzetti D., 1997, AJ 113, 162
Cervino M., Mas–Hesse J.M., 1994, A&A 284, 749
Charbonnel C., Däppen W., Schaerer D. et al., 1999, A&AS 135, 405
Combes F., Gerin M., 1985, A&A 150, 327
Condon J.J., 1992, ARA&A 30, 575
Condon J.J., Yin Q.F., 1990, ApJ 357, 97
Davies R.I., Sugai H., Ward M.J., 1998, MNRAS 300, 388
Demoulin M.–H., Chan Y., 1969, ApJ 156, 501
de Vaucouleurs G., de Vaucouleurs A., Corwin H.G. et al., 1991, 3rd Reference Catalogue of Bright Galaxies, Springer–Verlag
Devereux N.A., Kenney J.D., Young J.S., 1992, AJ 103, 784
Draine B.T., Roberge W.G., Dalgarno A., 1983, ApJ 264, 485
Elmegreen B.G., 1994, ApJ 425, L73
Evans I.N, Koratkar A.P., Storchi–Bergmann T. et al., 1996, ApJS 105, 93
Fernandez B.R., Holloway A.J., Meaburn J., Pedlar A., Mundell C.G., 1999, MNRAS 305, 319
Friedli D., Martinet E., 1993, A&A 277, 27
Genzel R., Hollenbach D., Townes C.H., 1994, Rep. Prog. Phys. 57, 417
Genzel R., Weitzel L., Tacconi–Garman L.E. et al., 1995, ApJ 444, 129
Gerin M., Nakai N., Combes F., 1987, A&A 203, 44
Glass I.S., Moorwood A.F.M., 1985, MNRAS 241, 429
González–Delgado R.M., Pérez E., Tadhunter C., Vilchez J.M., Rodríguez–Espinosa J.M., 1997, ApJS 108, 155
Hummel E., van der Hulst J.M., Keel W.C., 1987, A&A 172, 32 (H87)
Knapen J.H., Shlosman I., Peletier R.F., 1999, ApJ, in press (astro-ph/9907379)
Kotilainen J.K., Forbes D.A., Moorwood A.F.M, van def Werf P.P, Ward M.J., 1996, A&A 313, 771
Lancon A., Rocca–Volmerange B., 1996, New Astr. 1, 215
Landini M., Natta A., Oliva E., Salinari P., Moorwood A.F.M., 1984, A&A 134, 284
Leitherer C., Schaerer D., Goldader J. et al., 1999, ApJS 123, 3 (L99)
Lejeune T., Buser R., Cuisinier F., 1997, A&AS 125, 229
Maiolino R., Krabbe A., Thatte N., Genzel R., 1998, ApJ 493, 650
Maloney P.R., Hollenbach D.J., Tielens A.G.G.M., 1996, ApJ 466, 561
Mas–Hesse J.M., Kunth D., 1991, A&AS 88, 399
Meaburn J., Fernandez B.R., Holloway A.J., et al., 1998, MNRAS 295, L45
Ondrechen M.P., van der Hulst J.M., 1983, ApJ 269, L47
Ondrechen M.P., van der Hulst J.M., Hummel E., 1989, ApJ 342, 39
Origlia L., Goldader J.D., Leitherer C., Schaerer D., Oliva E., 1999, ApJ 514, 96
Osterbrock D.E., 1989, Astrophysics of Gaseous Nebulae and Active Galactic Nuclei, University Science Books
Pérez–Olea D.,E., Colina L., 1996, ApJ 468, 191
Pfenniger D., Norman C., 1990, ApJ 363, 391
Phillips M.M., Pagel,B.E., Edmunds,M.G., Diaz,A., 1984, MNRAS 210, 701
Piner B.G., Stone J.M, Teuben P., 1995, ApJ 449, 508
Puxley P.J., Hawarden T.G., Mountain C.M., 1990, ApJ 364, 77
Quillen A.C., Frogel J.A., Kuchinski L.E., Terndrup D.M., 1995, AJ 110, 156
Regan M.W., Mulchaey J.S., 1999, AJ 117, 2676
Reunanen J., Kotilainen J.K., Laine S., Ryder S.D., 1999, ApJ, in press (astro-ph/9909140)
Rieke G.H., Loken K., Rieke M.J., Tamblyn P., 1993, ApJ 412, 99
Ryder S.D., Staveley-Smith L., Malin D., Walsh W., 1995, AJ 109, 1592
Satyapal S., Watson D.M., Pipher J.L. et al., 1997, ApJ 483, 148
Schinnerer E., Eckart A., Quirrenbach A. et al., 1997, ApJ 488, 174
Shlosman I., Frank J., Begelman M.C., 1989, Nat 338, 45
Smith D.A., Herter T., Haynes M.P., Neff S.G., 1999, ApJ 510, 669
Storchi–Bergmann T., Baldwin J., Wilson A.S., 1993, ApJ 410, L11
Storchi–Bergmann T., Wilson A.S., Baldwin J., 1996, ApJ 460, 252
Telesco C.M., Dressel L.L., Wolstencroft R.D., 1993, ApJ 414, 120
Walborn N.R., Barba R.H., Brandner W. et al., 1999, AJ 117, 225
Walsh J.R., Nandy K., Thompson G.I., Meaburn J., 1986, MNRAS 220, 453