The orbital period of the recurrent X-ray transient in Terzan 6
Abstract
Four or five new outbursts were detected of the bright X-ray transient GRS 1747-312 in the globular cluster Terzan 6 between 1996 and 1999, through monitoring campaigns with the Wide Field Cameras (WFCs) on BeppoSAX and the Proportional Counter Array (PCA) on RossiXTE. This is the first time that the source is seen to exhibit recurrent outbursts after the discovery in September 1990 with ART-P on Granat. Three target-of-opportunity observations in 1998 and 1999, with the narrow-field instruments on BeppoSAX and the PCA, revealed one sharp drop in the flux which we identify as an eclipse of the compact X-ray source by the companion star. A detailed analysis of WFC data identifies further eclipses and we measure the orbital period at 12.3600.009 hr. This is consistent with an identification as a low-mass X-ray binary, as suggested already by the association with a globular cluster. The eclipse duration is hr. This implies that the inclination angle is larger than 74°. The 0.1-200 keV unabsorbed peak luminosity is erg s-1. The nature of the compact object is unclear.
Key Words.:
stars: individual: GRS 1747-312– stars: neutron – globular clusters: individual: Terzan 6 – X-rays: stars1 Introduction
Currently, 12 bright X-ray sources are known in 12 different globular clusters. Presumably they are all low-mass X-ray binaries (LMXBs) but orbital periods have so far been determined for only four of them (NGC 6441, NGC 6624, NGC 6712 and NGC 7078). These four periods range between 0.19 hr (for NGC 6624, Stella et al. 1987) and 17.10 hr (for NGC 7078, Ilovaisky et al. 1993). An interesting characteristic of these is that a high percentage (11 out of 12) exhibit type-I X-ray bursts which are thought to originate on the surfaces of neutron stars. For the bright LMXBs in the Galactic plane this is only 30%. This paper deals with the sole bright X-ray source in a globular cluster that has so far not exhibited bursts, namely GRS 1747-312 in Terzan 6.
Terzan 6 (Terzan 1968) is a metal-rich globular cluster at a distance of 7 kpc and highly reddened, with E(B-V)=2.24 (Barbuy et al. 1997). The cluster has undergone core collapse, its core and tidal radii are 3.3″ and 316″ respectively (Trager et al. 1995).
The transient X-ray source GRS 1747-312 was first detected in early September, 1990, both with the X-ray telescope ART-P on Granat (Pavlinsky et al. 1994) and with ROSAT (Predehl et al. 1991). The ART-P spectrum was compatible with 5.8 keV thermal bremsstrahlung and absorption by cold gas of cosmic abundances with cm-2. The flux was erg cm-2s-1 between 4 and 12 keV or 0.03 Crab flux units between 2 and 10 keV. The ROSAT all-sky survey measurement reveals the most accurate X-ray position so far: R.A. = 17h50m46.6s, Decl. = -31∘16′40″ (Eq. 2000.0, 1 error radius 20″, Verbunt et al. 1995). This is 0.9 core radii from the center of Terzan 6 as published by Barbuy et al. (1997). Furthermore, this ROSAT measurement is compatible with the hard bremsstrahlung spectrum of 5.8 keV, but the absorption column is rather lower at cm-2 (Verbunt et al. 1995). We have re-analyzed this spectrum, and find that a higher column, more in line with what was found from ART-P data, is not acceptable.
No other outbursts by GRS 1747-312 have been reported. However, Terzan 6 was not observed with either the sensitive X-ray instruments on Einstein or EXOSAT. Rappaport et al. (1994) observed Terzan 6 with the HRI on ROSAT on March 16-17, 1992, and found no source within 10 core radii. Thus, they confirmed that the source is a transient. Their HRI upper limit extrapolates to a PSPC upper limit which is a factor of 150 lower than the PSPC detection in September 1990 (Verbunt et al. 1995).
In this paper five new X-ray data sets are discussed which were obtained since 1996. The nature of the data is twofold. Monitoring observations were obtained with the Wide Field Cameras (WFCs) on BeppoSAX between August 1996 and April 1999, and with the Proportional Counter Array (PCA) on RossiXTE since February 1999. Sensitive target-of-opportunity observations (TOOs) were carried out with the narrow-field instruments (NFI) on BeppoSAX in September 1998 and with the PCA in September 1998 and in June 1999. We present an analysis of all these observations and speculate on the nature of the source.


2 Monitoring observations with the WFCs
The WFCs (Jager et al. 1997) on the BeppoSAX satellite (Boella et al. 1997a) carry out a long-term program of monitoring observations of the 40 field around the Galactic center. One of the goals is to detect X-ray transient activity from LMXBs whose Galactic population exhibits a strong concentration in this field (e.g., Heise 1998 and Ubertini et al. 1999). With respect to the monitoring observations with the All-Sky Monitor on RossiXTE the WFC monitoring observations are not as much source confused so close to the Galactic center and are five times as sensitive for 1-day time spans.
The program consists of campaigns during the spring and fall of each year. Each campaign lasts about two months and typically comprises weekly observations. Up to mid 1999, a total net exposure time of 2.6 million seconds was accumulated during 6 campaigns.
Terzan 6 is only 26 distant from the direction of the Galactic Center which is the pointing direction of the monitoring program. Therefore, Terzan 6 is observed near to the optimum sensitivity. Fig. 1 presents the light curve. At least three outbursts are recognized with first detections at MJD 50316, 50697 and 51047. The sampling is far from complete. There is a gap between MJD 50732 and MJD 50869 during which two dates the source was active. If the source returned to quiescence in this gap, which seems likely given the durations of other outbursts, we have detected four outbursts. The incomplete sampling makes it difficult as well to assess the peak flux of each outburst. The maximum intensity over all accurate detections is about 30 mCrab in the 2 to 26 keV band. This happens to be quite close to the flux measured with ART-P in the 1990 outburst (Pavlinsky et al. 1994).
For each of the seven observations where GRS 1747-312 was detected above a signal-to-noise ratio of 20 we determined the position. The average of these is R.A. = 17h 50m 46.3s, Decl. = –31° 16′ 42″ (Eq. 2000.0) and the 99% confidence level error radius 07. This position is only 4″ (nominally) from the ROSAT position of the source detected in 1990 and on top of Terzan 6.
3 Monitoring observations with the PCA
Since February 1999, scanning observations are carried out with the PCA on RossiXTE of a rectangular region surrounding the Galactic center, of approximately 16°18° in size and on a semi-weekly basis. In addition to the known persistently bright X-ray sources, of which about 20 are detected, old and new transient sources are found. The sensitivity of these scan observations is about 1 mCrab over the whole region. This is one to two orders of magnitude more sensitive than the observations with the All-Sky Monitor on RossiXTE. Thanks to the high frequency of the observations and the high duty cycle throughout the year (%), it is possible to uniformly sample outburst light curves of relatively faint transients. In contrast, the WFC observations have a lower duty cycle of % and an observation frequency at least twice as low. Terzan 6 is covered by all scan observations. It was found to go into outburst starting May 5, 1999, at MJD 51303.97. The light curve is presented in Fig. 2 (upper panel). The observations appear to sample the light curve well, there is no strong variability from data point to data point. Therefore, the peak flux can be confidently measured. The profile is a fast-rise exponential-decay function which is so typical of many other LMXB transients. The rise time was observed to be shorter than 1 week and could well have been much shorter. The peak intensity is 350.16.5 cts s-1 per 5 proportional counter units and occurred on MJD 51308.9, or 34.01.1 mCrab (this includes a systematic uncertainty of 0.9 mCrab for the quiescent level which may be contaminated by diffuse Galactic emission). The outburst intensity dropped to below the detection limit somewhere between MJD 51338 and 51343. The activity was seen for a 35 day period. The e-folding decay time is d, if one fits an exponential function to all data beyond and including the time of peak intensity. Until mid 1999 this is the only outburst of GRS 1747-312 seen in about 160 days of PCA scan observations. The other outbursts (i.e., measured with WFC and ART-P) have not shown fluxes that are significantly higher than the peak flux measured in this outburst.
The decay time of 18 d is reasonably consistent with the rate of decay of the latter two WFC-detected outbursts. The situation is unclear for the former two outbursts due to incomplete sampling.
The evolution of the 6–30 to 2–6 keV hardness ratio is also presented in Fig. 2 (lower panel). This shows that the spectrum is significantly harder during the rise than during the decay, and that there is no measurable spectral change during the decay (there is only a hint of a slight hardening during decay).
4 Broad-band spectral measurements with BeppoSAX-NFI
4.1 Observation and data reduction
The NFI include 2 imaging instruments that are sensitive at photon energies below 10 keV: the Low-Energy and the Medium-Energy Concentrator Spectrometer (LECS and MECS, see Parmar et al. 1997 and Boella et al. 1997b, respectively). They have circular fields of view with diameters of 37′ and 56′ and effective bandpasses of 0.1-10.5 and 1.6-10.5 keV, respectively. The other two, non-imaging, NFI instruments are the Phoswich Detector System (PDS) which covers to 300 keV (Frontera et al. 1997) and the High-Pressure Gas Scintillation Proportional Counter (HP-GSPC) which covers 4 to 120 keV (Manzo et al. 1997).
A target-of-opportunity observation (TOO) was performed with the NFI on September 6.26-6.79, 1998. The net exposure times are 11.8 ks for LECS, 22.9 ks for MECS, 10.5 ks for HP-GSPC and 10.4 ks for PDS. GRS 1747-312 was strongly detected in all instruments. The LECS and MECS images show only one bright source (Fig. 3), the position as determined from the MECS image is consistent with that from WFC. We applied extraction radii of 8′ and 4′ for photons from LECS and MECS images, encircling at least % of the power of the instrumental point spread function, to obtain light curves and spectra. Long archival exposures on empty sky fields were used to define the background in the same extraction regions. These are standard data sets made available especially for the purpose of background determination. All spectra were rebinned so as to sample the spectral full-width at half-maximum resolution by three bins and to accumulate at least 20 photons per bin. The latter will ensure the applicability of fitting procedures. A systematic error of 1% was added to each channel of the rebinned LECS and MECS spectra, to account for residual systematic uncertainties in the detector calibrations (e.g., Guainazzi et al. 1998). The bandpasses were limited to 0.8–4.0 keV (LECS), 2.2–10.5 keV (MECS), 4.0–25.0 keV (HP-GSPC) and 15–100 keV (PDS) to avoid photon energies where either the spectral calibration of the instruments is not complete or no flux was measured above the statistical noise. In spectral modeling, an allowance was made to leave free the relative normalization of the spectra from LECS, PDS and HP-GSPC to that of the MECS spectrum, to accommodate cross-calibration uncertainties in this respect. Publicly available instrument response functions and software were used (version November 1998).
For the non-imaging PDS and HP-GSPC, source confusion may be an issue, particularly in the densely populated Galactic center field. We verified whether any other point sources were active inside the field of view (11 FWHM for the HP GSPC and 13 FWHM for the PDS). For these instruments 5 pointings are relevant: one on-source pointing and two off-source pointings per instrument. For our observation, the off-source pointings were at +/–35 and +/–30 from the on-source pointings for the PDS and HP GSPC respectively (i.e., +/– in the direction of the satellite positive and negative Y-axis). We used near-to-simultaneous WFC images to provide information on what sources were active inside the field of view. For the on-source pointing, the nearest active point source turned out to be at a distance of 14. This is outside the field of view of both instruments . For the two off-source pointings of the PDS, we find that the nearest active source is at 26. For the off-source pointings of the HP-GSPC, the nearest active source is at 25. We conclude that source confusion is no issue in our observation.


4.2 Detection of an eclipse
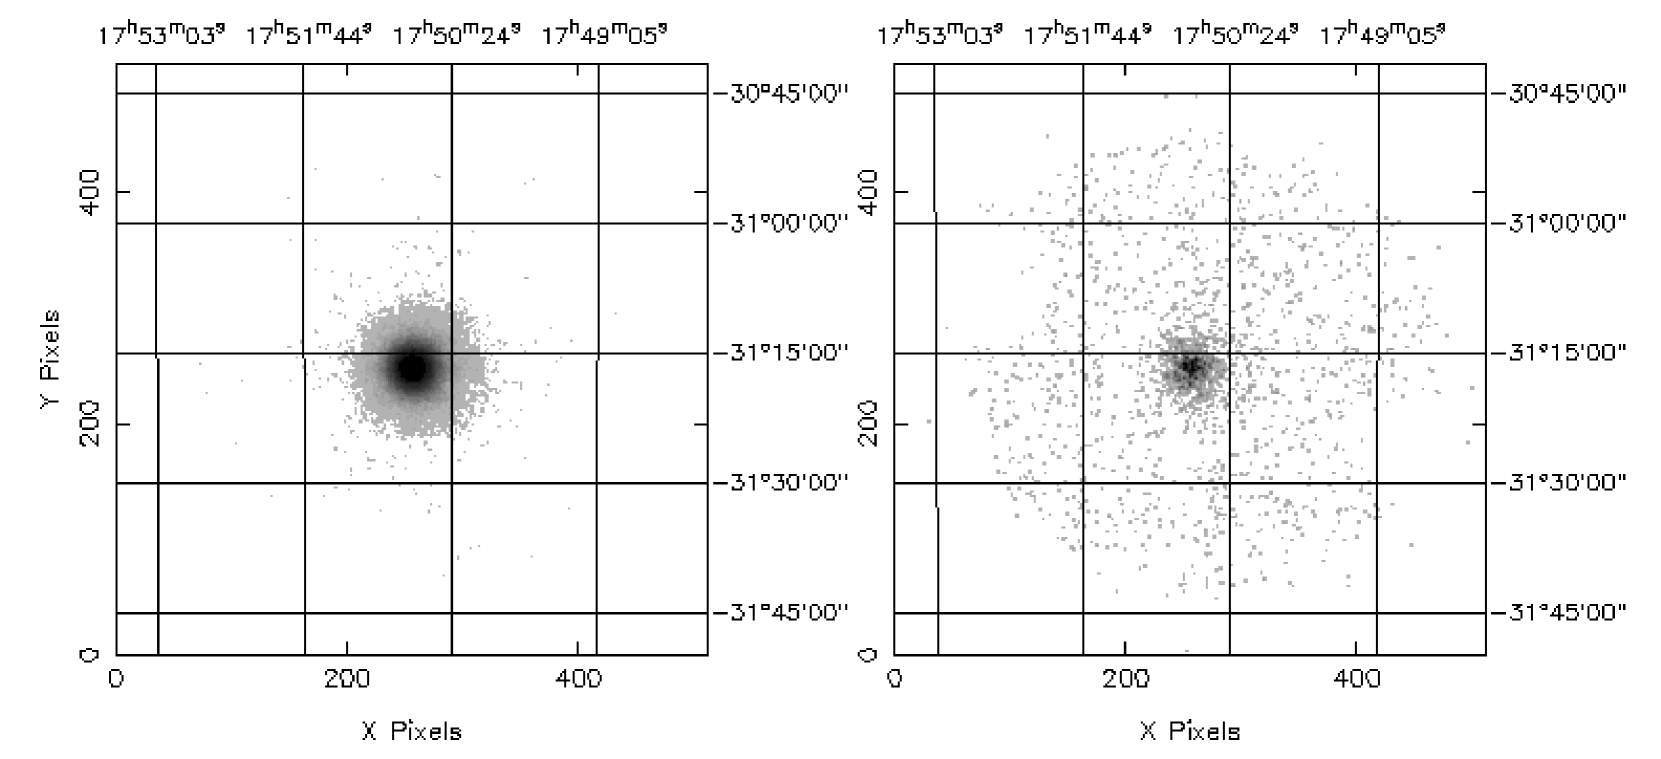
Fig. 4 shows the light curve in various bandpasses from the four NFI. Within the observation, the source shows a moderate intensity increase of about 10% from beginning to end, and one deep drop starting between 23.4 and 26.2 ks after the start of the observation. The drop lasts between 2.2 and 5.0 ks. A zoomed-in light curve (Fig. 5, including all LECS and MECS data to increase the sensitivity) shows that the emergence from the drop is not discrete but lasts about 35 s. For the remainder, the drop is flat for over 2200 s. This strongly suggests the drop to be caused by an eclipse by a companion star.
The eclipse is not complete as evidenced by the MECS image accumulated during times of minimum intensity (see Fig. 3). To reliably establish that the faint source is the same as the bright one and to accurately determine the intensity of the faint source, we have carried out a maximum likelihood analysis of the 2.2-10.5 keV MECS photons inside and outside the eclipse. In this analysis, point sources are searched for on top of a flat background. It renders quantitative information on the source flux and detection significance (e.g., Kuiper et al. 1998). The image accumulation times are 26.200 to 28.415 ks after the start of the observation for the eclipse and 0.0 to 23.400 plus 32.380 to 46.780 ks for outside the eclipse. In both images we found evidence for only a single point source. Fig. 6 shows the location confidence contours of these sources. The best-fit positions are only 4″ apart and consistent with each other. Therefore, we reject the possibility that the source during the eclipse is other than outside the eclipse. The 2.2-10.5 keV count rate during the eclipse is c s-1. This is consistent with what we found following the standard analysis (i.e., the rate then is c s-1 which is 3% lower than the aforementioned value as may be expected to be lost in the wings of the point spread function beyond the 4′ accumulation radius). This, furthermore, shows that the data analysis is not adversely affected by diffuse emission (from, for example, the Galactic ridge).
The maximum likelihood analysis results in a position of R.A. = 17h50m45.7s, Decl. = -31∘16′46.7″ (Eq. 2000.0, 1 systematic error radius 50″). This position is 13″ (nominally) from the position of GRS 1747-312 (Verbunt et al. 1995).
4.3 Spectrum
| Model | high-energy cut off power law |
|---|---|
| ( for and | |
| for ) | |
| + black body | |
| bb | keV |
| bb | km |
| keV | |
| keV | |
| 1.27 (109 dof) | |
| without bb | 1.45 (111 dof) |
| Model | bremsstrahlung + black body |
| bb | keV |
| bb | km |
| brems | keV |
| 1.42 (111 dof) | |
| without bb | 3.48 (113 dof) |
| Model | Comptonized + black body |
| bb | keV |
| bb | km |
| Wien | keV |
| Plasma | keV |
| Plasma optical | for disk geometry |
| depth | for spherical geometry |
| Comptonization | 0.5 for disk geometry |
| parameter | 2.3 for spherical geometry |
| 1.21 (109 dof) | |
| Flux (2-10 keV) | erg s-1cm-2 |
| unabsorbed | erg s-1cm-2 |
| Flux (0.1-200 keV) | erg s-1cm-2 |
| unabsorbed | erg s-1cm-2 |
| without bb | 1.87 (116 dof) |

4.3.1 Outside eclipse
The spectrum outside the eclipse (Fig. 7) can be satisfactory described with various continuum models. In Table 1, we present the results of three models that are commonly employed in the study of LMXBs. In all models, there is the need for a broad but local component at around 1.6-2.0 keV. We modeled this with a black body model but it can just as well be modeled differently like for instance with a number of narrow lines (e.g., emission lines from Si XIII and XIV) or one very broad Gaussian line.
Because of the spectral ambiguity, we defer a scientific analysis and merely use the parameterizations in Table 1 to determine fluxes and compare the spectrum with that of other X-ray binaries.
Independent of the model, the average 0.1-200.0 keV flux is erg s-1cm-2 (uncorrected for absorption). The column density is between 1.0 and 1.4 cm-2. This range is consistent with the value resulting from the interstellar reddening to Terzan 6: for (Barbuy et al. 1997) with an estimated error of 0.1, and cm-2 (according to the conversion of to by Predehl & Schmitt 1995). The broad component at 1.6-2.0 keV, which we modeled by black body radiation, affects the determination of somewhat but we estimate that this is limited to cm-2.
4.3.2 During eclipse
Only the LECS and MECS provide data during the eclipse that are of sufficient quality to allow a meaningful analysis. Formally, the spectrum is consistent in shape with that outside the eclipse ( for 28 dof). Nevertheless, the spectrum has the appearance of being somewhat softer. If, in the Comptonized model, k is allowed to vary during the fit, it converges to a value of keV ( for 27 dof). The F-test predicts a probability of less than 0.02 for a chance occurrence of the improvement in . The same kind of improvement can be obtained when leaving free the optical depth instead of the plasma temperature, so we conclude that the nature of the softening is unclear. The 2-10 keV flux is erg s-1cm-2 (2-10 keV) or 4% of that outside the eclipse.
4.3.3 During egress
Figs. 4 and 5 show that there appear to be two different stages of egress: the fast 35 s rise and a shoulder of a few hundred seconds. We generated separate spectra for these two time intervals and fitted them with the Comptonization model while keeping all parameters values fixed to those found for the out-of-eclipse spectrum (Table 1) except . We used only LECS and MECS data because we are primarily interested in whether changes during egress. From this we find that during the quick rise cm-2 and during the shoulder cm-2. However, if we leave free in addition the normalizations of the Comptonized spectrum, the sensitivity to measuring is completely lost. We conclude that we are unable to measure absorption effects during egress in a model-independent way.
5 Timing analysis of eclipses seen with WFC


The WFC observations have much longer coverage than the NFI TOO and in principle enable the measurement of the orbital period of the binary through the detection of more eclipses. Investigating the WFC data at a time resolution near to the duration of the NFI-observed eclipse is not easy for GRS 1747-312 because its peak flux is close to the detection limit for such a duration. In one day of observations, the signal-to-noise ratio is at maximum about 27 so that the 3 detection limit is reached when the exposure time is of order 500 s. For a LMXB the orbital period has a 90% probability of being lower than 48 hr (based on the census of White et al. 1995). We are fortunate with the 1996 WFC data because these include a continuous sequence of observations covering GRS 1747-312 at various off-axis angles for a duration of 9.2 days (except for discontinuities due to earth eclipses and passes over the South Atlantic Geomagnetic Anomaly).
We generated a light curve with a time resolution of 25 s from data where the source was significantly detected in a complete observation period. This is sufficient resolution to resolve a typical eclipse. The times were corrected to that for the solar system barycenter. The total exposure time, corrected for times when the earth blocks the field of view and the SAGA is passed, is 550 ks. Naturally, the 25 s data points are not significant. However, if they are folded with a period of a day and with a phase resolution of 1/256, each light curve point represent 1.7 ks worth of data and is expected to be be about 6 sigma. The total time span of the light curve is 752 d (or 2.06 yr).
Fig. 8 presents the Fourier power spectrum of the light curve between 0 and 10-4 Hz. There is a strong signal at a frequency of about Hz which has a number of higher harmonics. Surprisingly, the harmonic at Hz is stronger and more narrowly peaked. We evaluated folded light curves for 1.1, 2.25 and 4.5 Hz, and find that the one for 2.25 Hz is the one with the deepest single eclipse. The folded light curve for 4.5 Hz results in a single eclipse which is only half as deep as the one at 2.25 Hz and the equivalent period is, therefore, discarded as a possible orbital period. To determine the period more accurately, we applied a folding technique to search for the period with a resolution of 0.05 s. The periodogram is given in Fig. 9. This shows a broad peak with narrow spikes on top of that. The narrow spikes are uniformly spaced. The spacing is determined by the number of periods that are covered by the time span. It represents the uncertainty of the synchronization after large data gaps. We regard this as the principal uncertainty in the period determination. The two largest spikes are approximately equal in value and are at periods of 44463.4 and 44494.45 s. From this we determine the period to be one of these two values, with the larger one being the most likely period because it gives the deepest eclipse. In conclusion, the period is determined to be: s or hr. The time of mid egress interpolated from the WFC results to closest to the NFI observation is MJD 51062.593682. This is only 235 s from the actual measured epoch of MJD 51062.590967. Thus, the WFC and the NFI data are consistent in this respect.
Fig. 10 shows the folded light curve at s. From this we determine the eclipse duration to be ks. The WFC data covers (part of) 26 eclipses over 4 outbursts.

6 Variability measurements with RossiXTE-PCA
RossiXTE TOO pointed observations of GRS 1747-312 were carried out on two separate occasions, the first on September 13, 1998, from 08:16:17 to 09:11:00 UTC, the second on May 12, 1999, from 22:08:12 to 23:05:58 UTC. The flux levels during both of these observations were comparable. We obtained high time resolution PCA data in order to search for periodic pulsations as well as investigate the broadband X-ray variability of the source in an attempt to constrain the nature of the compact object.
From the two pointed observations we obtained about 6.4 ks of useful data. We calculated fast-Fourier-transform power spectra in order to search for pulsations in the 10 - 1200 Hz range. We find no significant periods in this range with an upper limit on any pulsed amplitude of 1 % (rms). We combined data from both intervals to investigate the broadband variability. Fig. 11 shows the resulting power spectrum normalized in units of (rms)2 / Hz, after an estimate of the Poisson noise level has been subtracted. We first fit a simple power law model including a constant offset to account for incomplete removal of the Poisson level. The power law model alone did not provide an adequate description of the power spectrum, mostly due to a broad excess of power between 0.02 and 1 Hz. We modeled this additional component with an exponential term. The resulting fit is acceptable, with for 19 degrees of freedom. The amplitudes (rms) in the power law and exponential components, integrated from to 100 Hz, are and , respectively. We also searched for kHz quasi-periodic oscillations (QPO) but found no significant features in the 200 - 1200 Hz range.
The X-ray variability revealed by GRS 1747-312 is qualitatively very similar to that seen in other X-ray binaries (see for example Wijnands & van der Klis 1999), showing a broad excess (sometimes clearly a QPO other times properly called a ’bump’) superposed on a broad band power law component. Unfortunately, this behavior is exhibited by both black hole as well as neutron star systems, so it is not possible to distinguish the nature of the compact source based on the broad band X-ray variability alone. Longer observations will be required to make more sensitive measurements to search for neutron star signatures such as kHz QPO.
We note that no eclipse was seen with the PCA, either during the TOO discussed in this section, or during the monitoring observations (see Fig. 2).
7 Discussion
Despite the lack of an optical identification, GRS 1747-312 is very likely a transient LMXB because it is located in a globular cluster. This is also supported by the 12.360 hr orbital period. The eclipse provides us with further constraints on the binary orbit. If one assumes that 1) the eclipse is caused by only the companion star; 2) the mass of the companion star is less than 0.8 M⊙ (as is expected for a main-sequence or (sub)giant star in a globular cluster); 3) the mass of the compact object is larger than 1.4 M⊙ (i.e., it must be heavier than or equal to that of a neutron star); and 4) Roche geometry applies to the binary, then the calculations by Horne (1985) imply that the inclination angle is larger than 74°.
The egress out of eclipse to 90% of the out-of-eclipse level is 35 s. This duration is determined by the size of the emission region being eclipsed and the sharpness of the edge of the eclipsing object. Enhancements in during egress would point to absorption effects in the atmosphere of the companion star. Unfortunately, we are not able to measure that. We can only determine upper limits to the transparent part of the companion’s atmosphere and the size of the emission region. The upper limit on the relative thickness of the transparent part of the atmosphere is 2.7% of the stellar radius. The emission region should be smaller than km (as derived if one applies Kepler’s law under the assumption that the combined mass of both binary components is 2 M⊙).
By analogy to other eclipsing LMXBs (e.g. EXO 0748–676, Parmar et al. 1986), it is a good hypothesis to attribute the 4% residual emission during the eclipse to photons scattered into the line of sight by an accretion disk corona (ADC), plus perhaps a contribution of interstellar dust grains below 2 keV. The emission being eclipsed would then result from a much more confined region, very likely the inner accretion disk. The flux contribution of the ADC outside the eclipse would be less than 8%. Any modulation introduced by the partial obscuration of the ADC outside the eclipse may, therefore, be masked by other variability of this transient source. Possibly, the slow part of the egress as seen with the NFI may be explained by this.
| Name | No. | Exposure |
|---|---|---|
| bursts | time∗ | |
| detected | (Ms) | |
| Terzan 1 | 0 | 2.6 |
| Terzan 2 | 14 | 2.5 |
| Terzan 5 | 0 | 2.6 |
| Terzan 6 | 0 | 2.6 |
| Liller 1 | 27 | 2.5 |
| NGC 1851 | 0 | 1.6 |
| NGC 6440 | 3 | 2.5 |
| NGC 6441 | 0 | 2.5 |
| NGC 6624 | 24 | 2.5 |
| NGC 6652 | 3 | 2.4 |
| NGC 6712 | 0 | 1.2 |
| NGC 7078 | 0 | 0.6 |
∗For transients such as Terzan 6 and NGC 6440, the exposure time includes times when the source was not active. Terzan 6 was active during 0.55 Ms.
If compared to other LMXBs with relatively faint peak fluxes, the NFI spectrum appears rather soft though not exceptionally so. In terms of as measured with the same NFI instrumentation, it is for instance softer than SAX J1748.9-2021 (15.5 keV, In ’t Zand et al. 1999a), 1E 1724-307 (27 keV, Guainazzi et al. 1998), GS 1826-238 (14.7 keV, In ’t Zand et al. 1999b). On the other hand, 4U 1820-30 has a softer spectrum with keV (Guainazzi 1999). All these sources have periods during which they burst, though possibly not always during the times when NFI spectra was taken.
One wonders why this bright globular cluster X-ray source remains, out of 12 cases, the only one without X-ray bursts. This relates to the question whether the compact object is a black hole candidate or a neutron star. If bursts would have been detected, that would have identified for certain a neutron star. We believe the lack of bursts is a matter of coincidence and does not help to make a statement about the compact object. To prove this point we tabulate in Table 2 the 12 globular clusters that are known to harbor bright X-ray sources, and the number of bursts that were detected from each one with the WFCs. It is remarkable that, despite the extensive nature of the monitoring campaign of the WFCs and the first-time detection of bursts from two of these, NGC 6652 (In ’t Zand et al. 1998) and NGC 6440 (In ’t Zand et al. 1999a), no bursts were detected from 4 established globular-cluster bursters in the Galactic center field and 3 outside that field. Apparently, chances are still high that bursts are missed from established bursters. We argue that this may very well also apply to Terzan 6.
The five likely outbursts reported in the present paper have wait times of 381, 172, 178, and 256 days. These numbers are uncertain because, except for the last outburst, our data do not have enough coverage to accurately determine the time of the onsets and to bridge large data gaps due to visibility constraints for WFC observations. However, one can conclude that there is a hint of a quasi periodicity of 0.5 to 0.7 years. This is a value not unlike that seen in other LMXBs. Future continued bulge scan observations with the PCA will take away data gaps and enable a better measurement of recurrence time, peak flux and decay time and correlations between these.
The shape of the light curve of the last outburst has a fast rise and exponential decay. This class of outburst profiles is quite ordinary among bright X-ray novae, accounting for about 30% of all cases (see review by Chen et al. 1997). The decay time constant of 18 d is common as well. The only difference is the peak flux which is more than an order of magnitude below that of bright X-ray novae. The low peak flux does not seem to be chance coincidence (i.e., some bright recurrent X-ray novae have low-luminosity outbursts as well), its magnitude has been similar on five or six different occasions. The highest peak flux was measured with the PCA. If one assumes that the NFI-measured spectrum applies then (this is not unreasonable since the NFI observation was close to the peak flux in another outburst), the unabsorbed 0.1-200 keV peak luminosity is erg s-1 (for a distance of 7 kpc).
Despite the high inclination angle, we failed to detect dipping activity. However, the lack of dips could be due to the insufficient sensitivity and coverage of the data.
8 Summary and conclusions
We found GRS 1747-312 to be an eclipsing LMXB with an orbital period of 12.360 hr. The eclipse duration is 0.720.06 hr. This translates to a lower limit on the inclination angle of 74°, for a compact object mass of at least 1.4 M⊙. Furthermore, GRS 1747-312 is a transient source with an unabsorbed 0.1-200 keV peak luminosity of erg s-1 and a relatively short recurrence time of half a year. The short recurrence time provides ample opportunity to study the source in the future. It is not yet clear what nature the compact object is.
Further longer observations are planned of this system in future outbursts to 1) search for X-ray bursts to be able to establish the compact object as a neutron star (the bursts may be weak if only the scattered emission is visible to us); 2) diagnose further the residual emission during the eclipse; 3) accurately determine the orbital period through more detailed eclipse timing, which may also enable studies of the orbital period evolution; 4) measure the spectral evolution during an entire outburst to find clues regarding to the faint nature of the source; and 5) search for dips to constrain the inclination angle further.
Acknowledgements.
Wouter Hartmann is thanked for help with the software. This research has made use of SAXDAS linearized and cleaned event files (Rev. 1.1) produced at the BeppoSAX Science Data Center. BeppoSAX is a joint Italian and Dutch program.References
- Barbuy et al. (1997) Barbuy B., Ortolani S., Bica E. 1997, A&AS 122, 483
- Boella et al. (1997a) Boella G., Butler R.C., Perola G.C., et al. 1997a, A&AS 122, 299
- Boella et al. (1997b) Boella G., Chiappetti L., Conti G., et al. 1997b, A&AS 122, 327
- Chen et al. (1997) Chen W., Shrader C., Livio M. 1997, ApJ 491, 312
- Frontera et al. (1997) Frontera F., Costa E., Dal Fiume D., et al. 1997, A&AS 122, 357
- ddd1 (1998) Guainazzi M., Parmar A.N., Segreto A., et al. 1998, A&A 339, 802
- gua99 (1999) Guainazzi M. 1999, in proc. 3rd INTEGRAL workshop ”The Extreme Universe”, eds. A. Bazzano, G.C. Palumbo, C. Winkler, Gordon & Breach publishing, in press
- ddd2 (1998) Heise J. 1998, in proc. ”The Active X-ray Sky”, eds. L. Scarsi, H. Bradt, P. Giommi, F. Fiore, Elsevier Publishing, Nucl. Ph. B 69, 186
- dddd (1985) Horne K. 1985, MNRAS 213, 129
- ilo93 (1993) Ilovaisky S.A., Auxiere M., Koch-Miramond L., Chevalier C., Cordoni J.-P., Crowe R.A. 1993, A&A 270, 139
- ddd3 (1998) In ’t Zand J.J.M., Verbunt F., Heise, J., et al. 1998, A&A 329, L37
- zand99a (1999a) In ’t Zand J.J.M., Verbunt F., Strohmayer T.E., et al. 1999a, A&A 345, 100
- zand99b (1999b) In ’t Zand J.J.M., Heise J., Kuulkers E., et al. 1999b, A&A 347, 891
- Jager et al. (1997) Jager R., Mels W.A., Brinkman A.C., et al., 1997, A&AS 125, 557
- Kuiper (1998) Kuiper L., Hermsen W., Bennett K. et al. 1998, A&A 337, 421
- Manzo (1997) Manzo G., Giarusso S., Santangelo A., et al. 1997, A&AS 122, 341
- Parmar (1986) Parmar A.N., White N.E., Giommi P., Gottwald M. 1986, ApJ 308, 199
- Parmar (1997) Parmar A.N., Martins D.D.E., Bavdaz M., et al. 1997, A&AS 122, 309
- Pavlinsky et al. (1994) Pavlinsky M.N., Grebenev S., Sunyaev R.A. 1994, ApJ 425, 110
- Predehl & Schmitt (1995) Predehl P., Schmitt J.H.M.M. 1995, A&A 293, 889
- Predehl et al. (1991) Predehl P., Hasinger G., Verbunt F. 1991, A&A 246, L21
- Rappaport et al. (1994) Rappaport S., Dewey D., Levine A., Macri L. 1994, ApJ 423, 633
- Terzan (1968) Terzan A. 1968, C.R. Acad. Sci. Ser. B 267, 1245
- Stella (1987) Stella L., White N.E., Priedhorsky W. 1987, ApJ 312, L17
- Trager, King, Djorgovski (1995) Trager S.C., King I.R., Djorgovski S. 1995, AJ 109, 218
- ube99 (1999) Ubertini P., Bazzano A., Cocchi M., et al. 1999, in proc. 3rd INTEGRAL workshop ”The Extreme Universe”, eds. A. Bazzano, G.C. Palumbo & C. Winkler, Gordon & Breach publishing, in press
- Verbunt et al. (1995) Verbunt F., Bunk W., Hasinger G., Johnston H.M. 1995, A&A 300, 732
- White, Nagase, Parmar (1995) White N.E., Nagase F., Parmar A.N., 1995, in ”X-ray Binaries”, W.H.G. Lewin, J. van Paradijs, E.P.J. van den Heuvel (eds.), Cambridge University Press, Cambridge, p. 1
- Wijnands & Van der Klis (1999a) Wijnands R., van der Klis M. 1999, ApJ 514, 939