Identification of a Likely Radio Counterpart
of the Rapid
Burster
Abstract
We have identified a likely radio counterpart to the low-mass X-ray binary MXB 1730335 (the Rapid Burster). The counterpart has shown 8.4 GHz radio on/off behavior correlated with the X-ray on/off behavior as observed by the RXTE/ASM during six VLA observations. The probability of an unrelated, randomly varying background source duplicating this behavior is 1–3% depending on the correlation time scale. The location of the radio source is RA ; Dec 33°23′198 (J2000), 01. We do not detect 8.4 GHz radio emission coincident with type II (accretion-driven) X-ray bursts. The ratio of radio to X-ray emission during such bursts is constrained to be below the ratio observed during X-ray persistent emission at the 2.9 level. Synchrotron bubble models of the radio emission can provide a reasonable fit to the full data set, collected over several outbursts, assuming that the radio evolution is the same from outburst to outburst, but given the physical constraints the emission is more likely to be due to hour-long radio flares such as have been observed from the X-ray binary GRS 1915+105.
1 Introduction
Discovered in 1976 Lewin et al. (1976), the Rapid Burster (MXB 1730335, hereafter “RB”) is located in the highly reddened globular cluster Liller 1 Liller (1977), which has a distance modulus of 14.680.23, corresponding to 8.61.1 kpc, determined by main-sequence fitting Frogel et al. (1995). Liller 1 has a small optical core radius (about 65).
Radio observations of transient X-ray binaries have found several to be radio transients as well (see Hjellming & Han (1995) for a review), both black hole candidates (A062000, GS 2000+25, GS 2023+33, GS 112468) and neutron stars (Aql X-1, Cir X-1, Cen X-4). The outbursts of X-ray transients are due to a sudden turn-on of accretion onto the compact object in a binary lasting from days to months Tanaka & Lewin (1995); Chen et al. (1997). The radio spectral and temporal behavior in some of these objects is described by a synchrotron bubble model Van der Laan (1966) which indicates that there are plasma outflows associated with the X-ray outburst. In particular, the black hole candidate and superluminal jet source GRS 1915+105 has been seen to exhibit correlated behavior at X-ray, infrared and radio wavelengths Fender et al. (1997); Mirabel et al. (1998); Eikenberry et al. (1998a, b); Fender & Pooley (1998) that is readily understood in terms of the synchrotron emission of expanding plasmoids that have been ejected from the inner regions of the system Fender et al. (1997); Mirabel et al. (1998); Fender & Pooley (1998).
Despite its frequent X-ray outbursts (average interval, days; Guerriero et al. (1999)), several previous studies have not detected radio emission from the RB Johnson et al. (1978); Lawrence et al. (1983); Grindlay & Seaquist (1986); Johnston et al. (1991); Fruchter & Goss (1995). Improvements in radio sensitivity since some of those studies were performed made the detection of a RB radio counterpart at previously unattainable flux levels practical. Furthermore, the advent of the RXTE All-Sky Monitor made it possible to correlate radio observations with a well sampled X-ray light curve. We therefore undertook a search for a radio counterpart of the Rapid Burster in X-ray outburst. Since the type II X-ray bursts of the Rapid Burster are thought to be caused by the same phenomenon (spasmodic accretion) as the X-ray outbursts van Paradijs (1996), one might expect that they are accompanied by simultaneous radio emission. The observations reported here marginally exclude (at the 2.9 level) simultaneous radio burst emission from the likely radio counterpart.
1.1 X-ray behavior
The RB is a transient X-ray source which has been observed during the past few years to go into outburst approximately every 220 days for a period of 30 days Guerriero et al. (1999). It is the only low-mass X-ray binary (LMXB) which produces two different types of X-ray bursts Hoffman et al. (1978). Type I bursts, which are observed from 40 other LMXBs, are due to thermonuclear flashes on the surface of an accreting neutron star. Type II bursts, which have been observed from only one other LMXB (GRO J174428; Kouveliotou et al. (1996); Lewin et al. (1996)), are sudden releases of gravitational potential energy resulting from accretion instabilities. For a detailed review of type I and type II bursts, see Lewin, van Paradijs and Taam Lewin et al. (1993, 1995a).
The RB does not fit easily into the “Z/Atoll” paradigm of LMXBs Rutledge et al. (1995), in which the correlated X-ray fast-timing and spectral behavior of LMXBs divides the population into two classes Hasinger & van der Klis (1989); van der Klis (1995). However, the RB is known to exhibit periods of behavior characteristic of an Atoll source. During an outburst in 1983, the RB exhibited strong persistent emission (PE) and type I bursts with no type II bursts – behavior typical of the Atoll sources Barr et al. (1987). This behavior has also been seen in outbursts observed more recently with RXTE. For the first 17 days of these outbursts, strong PE is accompanied only by type I X-ray bursts. Type II bursting behavior begins after this period and continues while the PE decreases (details of these observations are given in Guerriero et al. (1999)).
In spite of 20 years of theoretical modeling, no satisfactory model exists for the disk instability which drives the type II bursts (for a review, see Lewin et al. (1995a)). Models which require weak magnetic fields ( G) were effectively excluded with the discovery of GRO J174428, which contains a pulsar with a magnetic field of G Finger et al. (1996); Cui (1997), and also exhibits type II bursts Kouveliotou et al. (1996); Lewin et al. (1996).
1.2 Previous Radio Observations
There have been several radio studies of fields of view containing Liller 1, some with the goal of identifying a radio counterpart of the Rapid Burster. Some have focussed on finding radio variability in hopes of catching bursts in the radio correlated with type II X-ray bursts while others have sought persistent radio sources. We summarize the most stringent limits on the flux density of a persistent radio source in Table 1; additional, less stringent limits are summarized by Lawrence et al. Lawrence et al. (1983).
| Reference | Frequency | Measurement | Epoch | Rapid Burster | Note |
|---|---|---|---|---|---|
| (GHz) | (Jy) | State | |||
| Fruchter & Goss (1995) | 0.33 | 90001000 | 1-3 Aug 1990 | Unknown | VLA DnC |
| 1.5 | 280 50 | 25 May 1993 | Unknown | VLA CnB | |
| 4.5 | 95 14 | Jul 1990-Jan 1991 | Unknown | 11 Obs.; VLA C, B | |
| Johnston et al. (1991) | 1.5 | 180 (4) | 9-14 Apr 1990 | Unknown | VLA A |
| Grindlay & Seaquist (1986) | 4.5 | 380 (3) | 21-22 Jun 1982 | Unknown | VLA A |
| Johnson et al. (1978) | 2.7 | (32) | 23, 24, 27 Apr 1977 | Bursting | NRAO Greenbank |
| 8.1 | (53) | 23, 24, 27 Apr 1977 | Bursting | ||
| Lawrence et al. (1983) | 15.5 | 93 (3) | 20 Apr 1980 | Not Bursting | Haystack Obs. |
| 14.5 | 294 (3) | 17 Apr-28 Jul 1980 | Not Bursting | U of Michigan | |
| 8 | 636 (3) | 17 Apr-28 Jul 1980 | Not Bursting | ||
| 5 | 60 (3) | 31 Jul - 4 Aug 1980 | Not Bursting | Parkes, CSIRO |
Note. — Additional observational limits on variable radio emission may be found in Lawrence et al. (1983); periods when the RB was “not bursting” may have had persistent emission, which was difficult to distinguish from the nearby source MXB 172834.
Fruchter & Goss (Fruchter & Goss, 1995, hereafter, FG) discovered a radio source in three bands (0.33, 1.5, and 4.5GHz), with a spectral slope of . They observe the flux density of this source at 1.5 GHz above the upper limit derived from an observation at another time Johnston et al. (1991). FG interpret this discrepancy as the result of beam dilution in the Johnston et al. observations (05 beam obtained with the VLA in A-array) over-resolving a large population of radio pulsars in Liller 1. Thus, the interpretation of this radio source was as an integration over a population of radio pulsars in Liller 1. To date, no radio pulsations have been detected from the direction of Liller 1 (R. Manchester, private communication).
Prior to the present work, there have been two studies which produced limits on radio emission simultaneous with type II X-ray bursts of the RB. Johnson et al. Johnson et al. (1978) observed simultaneously in the radio and X-ray bands during a period when a total of 64 type II bursts were observed in the X-ray, and placed upper limits on the simultaneous flux density of radio bursts (at 2.7 and 8.1 GHz) of 20 mJy. Rao & Venugopal Rao & Venugopal (1980) observed at 0.33 GHz during two X-ray bursts and placed an upper limit of 0.2 Jy on the radio flux density during the bursts.
There are claims of radio burst detections from the RB without simultaneous X-ray observations (Calla et al. (1979, 1980a, 1980b); and Calla, private communication in Johnson et al. (1978)). Calla et al. report observing approximately 14 radio bursts on nine different days with peak flux densities of 400–600 Jy at 4.1 GHz and durations of 10–500 s. This phenomenon has not, however, been confirmed at other observatories and the reported flux densities are substantially above the limits placed by Johnson et al. Johnson et al. (1978) during their simultaneous X-ray/radio observations. If the reported radio bursts are real, they do not appear to be correlated with type II X-ray bursts Lawrence et al. (1983). Using the 16.7 ksec of observations at 8.4 GHz obtained in the course of this work, we find a 3 upper limit of 250 mJy on the flux density of our likely radio counterpart during any single 3.3 sec integration. Thus we see no evidence for radio flares of the type reported by Calla et al. during either the X-ray active or quiescent periods.
1.3 Objectives
The goals of the present work are, first, to search for a radio counterpart of the Rapid Burster, detectable either in X-ray outburst or in quiescence; and second, to determine if the radio emission can be tied to the active accretion during an outburst.
In Section 2 we describe the radio and X-ray observations, and present some general results. In Section 3, we present the results of our analyses of the radio observations in the context of the “standard model” of radio emission from X-ray transients: the synchrotron bubble model. We evaluate the likelihood of the counterpart identification in Section 4, discuss the results of these observations in Section 5, and list our conclusions in Section 6.
2 Observations
X-ray observations were made with two instruments on the Rossi X-ray Timing Explorer (RXTE; Bradt et al. (1993)): the All-Sky Monitor (ASM; Levine et al. (1996)) and the Proportional Counter Array (PCA; Zhang et al. (1993); Jahoda et al. (1996)). The ASM consists of three 1.5–12 keV X-ray proportional counters with coded-aperture masks. It obtains observations of approximately 80% of the sky every 90 minutes and is sensitive to persistent X-ray sources down to 5 mCrab ( detection) in a typical day’s cumulative exposure Remillard & Levine (1997). The standard data products of the ASM include the daily-average count rate of a known catalogue of X-ray sources including the RB111see http://space.mit.edu/derekfox/xte/ASM.html. A summary of our radio observations and the contemporaneous ASM X-ray flux measurements is shown in Table 2.
| Date | Observatory | RXTE/ASM 1-day Avg | RXTE/PCA | ||
|---|---|---|---|---|---|
| (UT) | (configuration) | (GHz) | (Jy) | (c/s) | (c/s) |
| 1996 Oct 14 | VLA (DA) | 8.4 | 4530 | 0.150.31 | – |
| 1996 Nov 06.8 | VLA (A) | 8.4 | 370 45 | 9.8 0.8 | 2830150 |
| 1996 Nov 11.9 | VLA (A) | 4.9 | 190 45 | 10.2 1.5 | 1660100 |
| ” | ” | 8.4 | 310 35 | ” | ” |
| 1997 Jun 29.3 | VLA (C) | 4.9 | 210 70 | 17.80.6 | 3680200 |
| ” | ” | 8.4 | 31045 | ” | ” |
| 1997 Jul 24.1 | VLA (CS) | 8.4 | 4130 | 0.800.73 | 210100 |
| 1998 Jan 30.8 | SCUBA | 350 | 3000 | 20.40.4 | – |
| 1998 Jan 31.1 | ATCA (6A) | 4.8 | 390 | 16.60.9 | – |
| ” | ” | 8.6 | 360 | ” | – |
| 1998 Feb 08.1 | ATCA (6A) | 4.8 | 480 | 6.880.31 | – |
| ” | ” | 8.6 | 930 | ” | – |
| 1998 Feb 19.6 | VLA (DA) | 8.4 | 1330 | 2.720.35 | 360120 |
| Simultaneous Radio/X-ray Observations of Type II Bursts | |||||
| B1997 Jul 24.1 | VLA (CS) | 8.4 | – | 3240100 | |
| B1998 Feb 19.6aafootnotemark: | VLA (DA) | 8.4 | 42120 | – | 3550100 |
| B1998 Feb 19.6bbfootnotemark: | VLA (DA) | 8.4 | 74 82 | – | 2350100 |
aUsing 3.33 sec bins with
1700 c/s average PCA countrate.
bUsing 3.33 sec bins with 300
c/s average PCA countrate.
Note. — Upper limits are 3
The PCA is a collimated array of gas-filled proportional counters, sensitive in the 2–60 keV energy range, with a FOV of and a geometric area of . In total, five simultaneous PCA and radio observations were performed; they are discussed in detail below. When the PCA is pointed directly at the RB, there is a nearby () persistent X-ray source (4U 172834) which contributes to the measured X-ray flux. During part of these observations, the PCA is pointed offset from the RB at a reduced collimator efficiency, excluding 4U 172834 entirely from the field of view. The uncertainty in the aspect correction of the PCA dominates our uncertainty in the RB count rates, which throughout this paper are given as the count rate for the RB only (aspect corrected, background subtracted, with the count rate from 4U 172834 – assumed constant over the 1-hr observation – subtracted).
The radio observations were performed at three different observatories. The Very Large Array (VLA)222The VLA is part of the National Radio Astronomy Observatory, which is operated by Associated Universities, Inc., under cooperative agreement with the National Science Foundation. observed every outburst discussed in this work and made the first detection of the radio counterpart reported here. VLA observations were obtained in two closely spaced bands, each of 50 MHz nominal bandwidth. Each band was observed in both right-circular and left-circular polarization making the total observed bandwidth 100 MHz for each polarization. The complex antenna gains were set using observations of a nearby compact radio source (1744312) and the flux density scale was determined using observations of 3C 286.
The Rapid Burster was observed on two occasions with the Australia Telescope Compact Array (ATCA)333The Australia Telescope is funded by the Commonwealth of Australia for operation as a National Facility managed by the CSIRO.. The complex antenna gains were set using observations of the nearby phase calibrator, PKS B1657261. The observations were made simultaneously in two orthogonal linear polarizations at 4800 and 8640 MHz with a bandwidth of 128 MHz at each frequency. For both observations the array was in the extended 6A configuration with baselines in the range 337–5939 m.
The Sub-millimeter Common User Bolometer Array (SCUBA; Cunningham et al. (1994)) on the James Clerk Maxwell Telescope (JCMT)444The James Clerk Maxwell Telescope is operated by The Joint Astronomy Centre on behalf of the Particle Physics and Astronomy Research Council of the United Kingdom, the Netherlands Organisation for Scientific Research, and the National Research Council of Canada. observed on 30 January 1998 UT using the 850 m system in photometry mode.
To date, there have been five outbursts of the RB observed with RXTE/ASM. The progression of four of these outbursts, including the evolution of the RB’s bursting behavior, is described elsewhere Guerriero et al. (1999). During three of these outbursts, we performed radio observations with the VLA, ATCA, or SCUBA, the results of which are listed in Table 2. We describe the observations in detail in the following sections.
2.1 November 1996 Outburst
Radio observations with the VLA in A-configuration were made at 8.4 GHz while the RB was in X-ray quiescence on 1996 October 14. These produced low upper limits in both the radio (4530 Jy) and X-ray (0.150.31 ASM c/s) bands (errors are ; 73 ASM c/s 1 Crab).
On 1996 October 29, the RB was detected by the ASM to have begun an X-ray outburst, reaching peak intensity at 1996 October 30 14:30 UT (1 hr). VLA observations, with simultaneous RXTE/PCA observations took place 7.2 days after the time of X-ray peak flux (1996 November 6.8 UT), at which time a radio source which was not present in the October 14 observation was detected with a flux density of 37045 Jy(8.4 GHz). The new source was consistent with a point source but the low signal-to-noise ratio limits the upper limit on the size to 05 in both dimensions. The source is located at RA 17h33m24s.61; Dec 33d23m19s.8 (J2000), 01 (see Figure 1; the positions of radio source detections described below are consistent with this position).

During the 3.6 ksec PCA observation, one type I X-ray burst was observed along with strong persistent emission (PE; 22010 mCrab; throughout this work, 1 Crab=13,000 PCA c/s) but there were no type II X-ray bursts. For the RB, we find an approximate conversion between PCA count rate and X-ray flux to be 3 erg cm-2 s-1 per PCA cps (2-20 keV).
A second simultaneous VLA/PCA observation took place 12.3 days after the X-ray maximum of the outburst (on 96 November 11.88 UT) at 4.89 and 8.44 GHz; the radio point source had flux densities of 19045 and 31035 Jy(respectively). During this observation, one type I X-ray burst was observed with persistent emission of 1288 mCrab and no type II X-ray bursts.
2.2 June-July 1997 Outburst
The RB began the following X-ray outburst on 1997 June 25, reaching a peak flux at 1997 June 26 10:30 UT (2 hr). Simultaneous VLA/PCA observations took place 2.9 days after X-ray maximum while the VLA was in C-array. The radio object was present at both 4.89 GHz and 8.44 GHz, with flux densities of 21070 and 31045 Jy respectively. During this observation, the PE observed by the PCA was 28015 mCrab and there were two type I X-ray bursts but no type II X-ray bursts.
On 1997 July 24.08 UT, a second simultaneous VLA/PCA observation took place, 27.6 days after X-ray maximum. The VLA was in CS-array and the radio point source was not detected at 4130 Jy (8.44 GHz). The PE was very weak (8 mCrab); over the whole observation, the average intensity (bursts+PE) was 210100 PCA c/s (16 mCrab). A total of seven type II X-ray bursts were observed with the PCA with an average intensity of 2350100 PCA c/s (180 mCrab) during the bursts, and a mean duration of 12 seconds. Of these, six had simultaneous coverage at VLA at 8.44 GHz. The radio data corresponding to these six bursts were extracted to determine if there is detectable radio emission during the brightest bursts (3240100 PCA c/s). We find an upper limit on the radio emission during these type II X-ray bursts of 690 Jy().
2.3 January-February 1998 Outburst
The next RB outburst began on 1998 January 27, peaking in X-ray intensity at 1998 January 29 12:30 UT (4 hours). During PCA observations 1.2 days after X-ray maximum (1998 January 30 19:19–21:09 UT), strong PE (4000100 c/s) was observed along with two type I X-ray bursts but no type II X-ray bursts. Observations at the JCMT were carried out 1.3 days after the X-ray maximum using the SCUBA system at 350 GHz and failed to detect the proposed radio counterpart with a 3 upper limit of 3 mJy.
Beginning 1.6 days after the X-ray maximum, the ATCA observed for a 3-hour period (1:37-4:46 UT, on 1998 January 31) at 4.8 and 8.64 GHz. These observations produced flux density upper limits of 390 and 360 Jy respectively (3). Between 1:33-4:28 UT on 1998 February 8, 9.6 days after the X-ray maximum, observations at the ATCA produced upper limits of 480 Jy (4.80 GHz) and 930 Jy (8.6 GHz).
On 1998 February 19, 20.1 days after the X-ray maximum, we performed a 7.8 ksec PCA observation during which a total of 91 type II bursts were observed. Simultaneous VLA observations occurred during the second half of this period and 39 type II bursts were observed simultaneously by the PCA and the VLA at 8.44 GHz. These bursts had average peak count rates of 6000 c/s (due only to type II burst emission, excluding background and PE of 250 PCA c/s) and durations of 10 seconds. Integrated over the full radio observation, the 3 upper limit on radio emission from a point source at the position of the proposed radio counterpart was 90 Jy (8.4 GHz). This observation is the only radio observation in the present work during which a large number of type II X-ray bursts were observed. Therefore, we can use it to explore the relationship between the type II X-ray bursts and the radio emission.
In order to compare the X-ray flux to the radio flux density, we re-bin the PCA data to correspond to the 3.33 s integration periods of the VLA data. To optimize the signal-to-noise ratio for the detection of radio bursts under the assumption that the radio flux density is proportional to the X-ray flux, we use only time bins with average count rates 1700 c/s. During these time bins, the radio emission is constrained to be 360 Jy () at 8.4 GHz, while the average X-ray count rate was 3550100 c/s.
One can decrease the noise level in the radio data by simply increasing the integration time. However, if the radio flux density is strictly proportional to the X-ray flux, the signal-to-noise ratio will decrease. Using the radio data observed when the type II burst X-ray flux was 300 c/s yields a three-sigma upper limit of 255 Jy on the radio emission during bursts while the average X-ray type II burst intensity was 2340120 c/s.
2.4 Relationship between X-ray and Radio Intensity
In Figure 2, we show the 8.4 GHz VLA flux densities measured during three consecutive outbursts of the RB compared with the RXTE ASM X-ray intensity measurements.

The radio outbursts and quiescent periods correspond well with the X-ray state of the RB, indicating a possible relationship between the radio and X-ray sources.
For the ASM, the best-fit linear relation between the 8.4 GHz flux density measured at the VLA and the ASM X-ray flux (forcing the line through the origin) gives . However, this is a very poor fit, with a reduced (for 6 degrees of freedom). For the PCA data, the relation is , again with a very poor fit ( for 4 degrees of freedom). These data and the linear fits are shown in Figure 3.

It seems also plausible (observationally, if not theoretically) that the radio source is “on” at a constant flux density (of 32525 Jy at 8.4 GHz) whenever the X-ray source is above a threshold of 3 ASM c/s (500 PCA c/s). In Figure 3 panel (a), we also show the 3 upper limits for the excess radio emission correlated with the average type II burst intensity. The two most constraining upper limits (which were drawn from the same data; see Section 2.3) are still marginally consistent with the radio detections during periods of X-ray persistent emission of comparable X-ray intensity. The most constraining simultaneous radio emission limit during the type II bursts is discrepant at the 2.9 level.
3 Analysis of Radio Observations Using the Synchrotron Bubble Model
One possible description of our radio flux density measurements involves a synchrotron bubble model Van der Laan (1966); Hjellming & Han (1995). In this model, the physical source of the radiation is a dense, expanding bubble of plasma. The relativistic electrons in the plasma (assumed to have a more or less isotropic velocity distribution and a power-law energy distribution) emit synchrotron radiation as their trajectories are deflected by interactions with ambient or entangled magnetic fields. The resulting radio spectrum is strongly peaked with a power law form at frequencies (much) below or above the peak frequency. This peak frequency decreases as the bubble expands in a well-determined fashion: , where is the peak frequency, is the normalized radius of the bubble, and is the power-law index of the electron energy distribution, Van der Laan (1966).
A synchrotron bubble’s time dependent radio emission is completely determined if we set the time, , and the flux density at spectral peak, , when the spectral peak reaches some nominal frequency (which we will take to be the VLA X-band, 8.44 GHz). Furthermore, one must define the functional form of the bubble’s radial expansion in time. Here we adopt the convention of previous authors Van der Laan (1966); Hjellming & Han (1995) and assume a power-law form for this expansion: .
The initial hypothesis that we wish to investigate is whether our radio flux measurements may be explained by the evolution of a single synchrotron bubble initiated at the start of each X-ray outburst. We perform this analysis for two primary reasons: first, models of this nature, with time scales of the order of those observed in the radio emission, have proven successful in modeling the radio outbursts of other X-ray binaries Han (1993); Hjellming & Han (1995); second, even if the model is not successful, we expect it to give insight into the physical processes responsible for the radio emission we observe.
We determine the X-ray outburst start times by fitting the RXTE ASM light-curve to a functional form consisting of an onset time, a linear rise in intensity, a peak intensity time, and an exponential decay – similar to the form used by Guerriero et al. Guerriero et al. (1999), except that we do not include the secondary flares which are found by those authors in two of the outbursts. The results of our fits are consistent with those of Guerriero et al., and parameter uncertainties are probably dominated by the systematics associated with this simplified outburst intensity model. Based on these fits, we determine the time after outburst onset for each of the radio observations.
We have performed fits to our radio observations using the synchrotron bubble model of Van der Laan (1966) Eqs. 11 & 12; note however that his Eq. 11 is incorrectly typeset and should read
| (1) |
where the variables are as defined in that work. For purposes of this analysis, we assume that the observed RB outbursts generate synchrotron bubbles with identical physical properties and time evolution. The data are not sufficient to adequately constrain all four independent parameters so we have fixed the expansion index at three canonical values: corresponding to free expansion with constant velocity, corresponding to energy-conserving expansion into an ambient medium (as in the Sedov phase of a supernova remnant), and resulting from a momentum-conserving (but not adiabatic) expansion into an ambient medium Hjellming & Han (1995). Application of the geometric corrections to the van der Laan model suggested by Hjellming and Johnston Hjellming & Johnston (1988) altered the fit parameters slightly but did not significantly improve the fits or change the character of the solutions (the light curves changed by less than 10%). Therefore, we quote results from the simpler model. The resulting synchrotron bubble parameters are given in Table 3
| Expansion index | Normalization (at 8.44 GHz) | Electron energy index | ||
|---|---|---|---|---|
| (fixed) | Fit | , Jy | , days | |
| 1 | 4.4 | 37. | 27.9 | 1.07aafootnotemark: |
| 2.5 | 2.3 | 342. | 10.0 | 2.6 |
| 4 | 1.7 | 438. | 8.5 | 9.0 |
aFixing drove the fits to , the minimum physical value. in this model with 90% confidence.
and the models are compared to the observations in Figure 4.
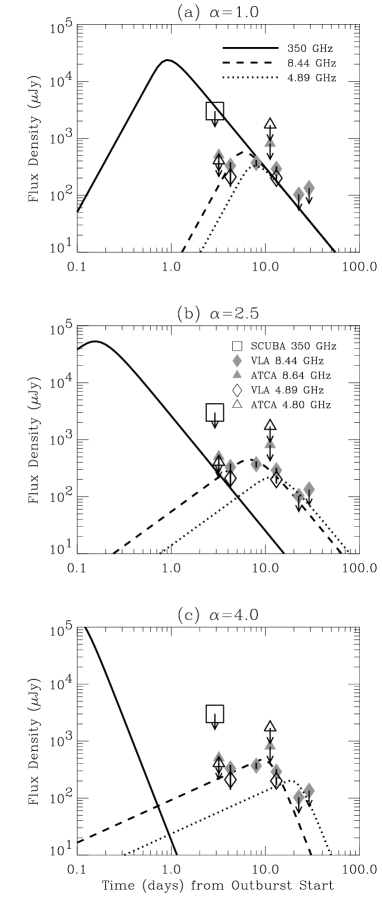
As indicated in Table 3, the models provide reasonable, but statistically unacceptable, fits to the data ( 1.7–4.4, for nine degrees of freedom). Given our many simplifying assumptions, particularly the assumption that all outbursts are identical, this is perhaps not surprising. We note that the free expansion () model fit is significantly worse than the other two and violates the upper limit imposed by the 1998 January 30 SCUBA observation (Figure 4a); for these reasons we prefer the models which assume a deceleration of the bubble’s expansion by an ambient medium.
Even these models, however, are in the end physically unacceptable, as may be determined by looking at the underlying physical parameters. We can express in terms of the ambient magnetic field density, , and the angular extent of the source, , at time , as follows:
| (2) |
where is the power-law index of the electron energy distribution (2.6 for the adiabatic model and 9.0 for the momentum-conserving model), and is a known function that varies from 4.1 to 1.04 as increases from 1 to 10:
| (3) |
where is the Euler gamma function.
Under the adiabatic assumption, the 8.44 GHz flux density of the source when the spectral peak reaches that frequency is Jy, whereas under the momentum-conserving assumption it is 44050 Jy. Thus the indications are that at , under both models, for fields of the order of a milligauss (with a weak dependence on the actual field strength). At the distance of the RB (8.6 kpc) that corresponds to a linear size of light-seconds, and expansion velocities at time of order 1 km sec-1, much too slow for the expanding hot plasma that the model requires. We are forced to conclude that more complicated models are required to accurately describe the observations (see Section 5).
4 Evaluation of Counterpart Likelihood
4.1 Positional Coincidence
First, we consider the probability that an unrelated radio source lies close to the RB on the sky. Micro-jansky source counts at 8.44 GHz by Windhorst et al. Windhorst et al. (1993) find a source density of for flux densities above 300 Jy. Therefore, the probability of an unrelated source brighter than 300 Jy falling within 86 of the X-ray position of the RB is . It should be noted that the Jy sources are typically associated with faint blue galaxies Fomalont et al. (1991) and that the survey fields are not representative of the rich environment of a globular cluster near the galactic center. Because the Jy source population in an environments comparable to Liller 1 is unknown, we do not use the probability computed above in our evaluation of the counterpart likelihood which is based exclusively on the correlation between the radio and X-ray lightcurves.
The best X-ray position for the RB Grindlay et al. (1984) places the radio source 86 away from the RB with X-ray and radio uncertainties of 16 and 01, respectively. Taken at face value, this is significant at the 5.4 level, not including the systematic uncertainty in the radio to optical (i.e. Einstein star tracker) reference frame shift. This makes the radio source identification with the RB seem less likely. However, further investigation reveals that the quoted Gaussian errors are an inadequate description of the true error distribution.
The Einstein position for the Rapid Burster was determined from a single pointing (four Einstein HRI pointings at Liller 1 were made, but only one found the RB in outburst). The 16 uncertainty in this position is estimated from the dispersion of the errors in the single-pointing Einstein positions of X-ray sources with known optical counterparts Grindlay et al. (1984). An important cross-check of the requisite star-tracker calibration (which dealt with a number of complex systematic effects; Grindlay (1981)) was provided by the Einstein globular cluster X-ray source program, which performed multiple pointings at each of eight globular clusters (GlCls) with known bright X-ray sources in order to determine the positions of these sources to better than 16 accuracy Grindlay (1981); Grindlay et al. (1984). These eight clusters were NGC 104 (47 Tuc), NGC 1851, Terzan 2, Liller 1, NGC 6441, NGC 6624, NGC 6712, and NGC 7078 (M15).
If the star-tracker calibration was successful in accounting for all significant sources of systematic error, then we would expect the resulting sample standard deviations, in the positions of the GlCl X-ray sources as derived from the multiple pointings at each, to cluster strongly around . Examining the quoted uncertainties of Grindlay et al. Grindlay et al. (1984), however, we find that the actual values deviate from 16 by up to a factor of two — for the X-ray source in NGC 6712 (5 pointings), while for the X-ray source in Terzan 2 (4 pointings). A test shows that in NGC 6712, is too small at the 98% confidence level and that for Terzan 2, is too large with 99.95% confidence. Together, these deviations are unlikely to be statistical and they represent two out of the seven clusters examined (recall that Liller 1 had only one pointing with a detection, so its value is undetermined).
We conclude that there are probably remaining unaccounted-for systematic effects in the Einstein aspect solutions. These effects average into the quoted 16 error over many pointings, but caused substantial non-Gaussian excursions within the context of the GlCl X-ray source program. Since the multiple pointings at each cluster were typically executed over a time span of weeks to months, the unaccounted-for systematics are not likely to be temporal in nature, but rather to relate to position on the sky. They may relate, for example, to the density of suitable stars within the star-tracker fields. In this connection it is worth noting that Terzan 2 and Liller 1 are the two sample GlCls nearest the Galactic Center, and are only 3° apart on the sky.
4.2 Significance of the X-ray – Radio Correlation
The probability that the observed radio/X-ray behavior is produced by an unrelated background radio source depends on the model for the variability behavior of that source. We consider first a source model in which the background radio source varies randomly with a duty cycle, , and has a short auto-correlation time-scale allowing us to consider each of our measurements to be statistically independent.
We take the radio source to be “on” or “off” when our 1 radio sensitivity is 70 Jy and the source is or is not detected, respectively, at the level. Moreover, we define the Rapid Burster to be “on” or “off” (for these purposes) when its one-day average RXTE ASM count rate is greater or less than 4 cts/sec (see Figure 3 and Section 2.4). Based on these assumptions, the probability of an unrelated variable background radio source mimicking the X-ray on/off state of the RB is the product of the normalized probability distribution for obtaining the number of radio “on” and “off” observations for a given , and the probability distribution of observing the radio and X-ray sources to be “on” and “off” simultaneously for a given , integrated over all values of :
| (4) |
where is the total number of times the radio source is observed “on”, is the total number of times the radio source is observed “off”, is the number of times the radio source and X-ray source are observed on simultaneously, and is the number of times the radio source and X-ray source are observed off simultaneously. We have assumed a uniform prior distribution for itself. For our observations (cf. Table 2), , , , , which yields a probability of 1.2% for an unrelated radio source mimicking the observed on-off behavior of the RB. This indicates that it is unlikely that the observed radio/X-ray correlation is produced by a randomly varying background radio source.
More complex models for the radio source might postulate that it occasionally turns “on” and remains so for days (auto-correlation time scale). We can estimate the probability of a chance correlation of such a source with the Rapid Burster, without performing involved Monte Carlo simulations, by making use of the framework developed above. If we speculate that is such that the two detections during Nov 1996 (separated by 5 days) are perfectly correlated and all other observations are uncorrelated, then we have 5 coincident X-ray/radio observations (, ), and the probability of a chance correlation is 2.6%. Note that if the auto-correlation time scale is shorter than 5 days then all six observations are statistically independent as above. Note also that the auto-correlation time scale cannot be much longer than 5 days, because as it approaches 20 days it approaches the observed radio on/off time (that is, the initial non-detection followed by a detection during Nov 1996, and the detection followed by a non-detection in June/July 1997).
One might reasonably be concerned about the possibility of an unrelated radio source that turns “on” suddenly and remains so for an extended period of time. The radio data do not exclude the possibility that such a source was present and remained “on” during the unsampled period between the Nov 1996 and June/July 1997 outbursts of the RB. In this case, we have only three independent measurements of coincidence with the RB. However, the radio source is observed to make the transition from “off” to “on” (and the reverse) in 25 d. The radio data show one “turn-on” and one “turn-off” both of which are well sampled and coincident with the X-ray behavior of the RB. If an unrelated radio source turns “on” every 300 d, then the probability of the “turn-on” coincidence observed in Nov 1996 is 8%. The slow decay of the RB X-ray outburst makes a “turn-off” coincidence somewhat more probable. If we cannot distinguish “turn-offs” that are separated by d, then the probability of the observed coincidence in the June/July 1997 outburst is 15%. If the two events are independent, the probability of this type of source mimicking the observed RB X-ray turn-on/off behavior is 1%.
The population of Jy radio transients and their outburst properties are not well studied. The probability of an unrelated, variable radio source having the time-dependent characteristics above and lying this close to the RB is somewhat less than unity although we have neglected this in the above calculations. It seems reasonable to assume the most conservative of the above approaches as the upper limit; we therefore find that the upper limit on the probability of a flaring background radio source mimicking the X-ray behavior of the RB is 3%.
4.3 Possible Relationship Between the FG Radio Object and the Present Object
The relationship between the variable radio source we observe and the steep spectrum source () observed by FG is not clear. To within the astrometric uncertainty (15, 3), the two sources are at the same position on the sky. If FG’s interpretation of their source is correct and it represents the integrated emission of a population of radio pulsars, then it seems likely that their radio position is the center of the GC. (The 2′′ separation between the FG radio source and the optical center of Liller 1 is consistent with the 1′′ uncertainty in the absolute optical astrometry; see Figure 1). For a 65 core-radius GC Kleinmann et al. (1976); Picard & Johnston (1995), the 15 radio error circle represents 12% of the optical light of the GC. Thus, it is not unlikely that (if the RB is associated with the GC) the radio counterpart to the Rapid Burster would also lie close to the center of the GC.
The three flux-density measurements of the FG source were made over three different (sometimes overlapping) epochs. Combining the three measurements into a single spectrum (which was found to be steep) assumes that the source is not variable. The conflicting 1.5 GHz measurements of FG and Johnston et al. may indicate variability of a factor of two or more (2) between April 1990 and May 1993. The X-ray state of the Rapid Burster during these observations is unknown, and it may be that it was X-ray active during FG’s 1.5 GHz observation, providing the additional radio flux above that expected for an underlying population of radio pulsars in Liller 1. The relationship between the FG radio source and the RB could be illuminated by radio measurements of the same epoch at 0.33, 1.5 and 4.5 GHz, taken both while the RB is in X-ray outburst and in quiescence.
4.4 Conclusion – A Likely Radio Counterpart
The probability that a serendipitously located variable radio source would mimic the Rapid Burster X-ray state as has been observed is small (1–3%), but not dismissably so. The number and distribution of faint, variable radio sources toward the Galactic Center is not well known. There has been at least one other recent instance where a radio source, variable on a time-scale of days, was discovered from a bright X-ray source (although the X-ray flux was not correlated; Frail et al. (1996a, b)). In addition, globular clusters are known to harbor both millisecond radio pulsars and accreting X-ray sources, so the appearance of an unrelated variable radio source in Liller 1 must be considered more likely than for a random field. Other than the correlated radio and X-ray states and the marginal consistency of the radio spectrum with synchrotron-bubble models, we have not observed any radio behavior which would tie this object uniquely to the Rapid Burster.
The apparent positional discrepancy between the radio source and RB is likely explained by the non-Gaussian distribution of the X-ray position error as discussed above and acknowledged by Grindlay et al. Grindlay et al. (1984) and Grindlay Grindlay (1998). Proper motion of the RB will probably contribute only negligibly to the discrepancy, given the association with Liller 1, even though an interval of 20 years separates the Einstein and radio observations (a proper motion of 05 per year is required). Improvement upon the X-ray localization will be obtained during an approved AXAF observation, which should determine the X-ray position to 05, thus confirming or excluding this radio counterpart.
At present, we identify this radio source as a likely radio counterpart of the Rapid Burster. Apart from the AXAF observation, the case could be strengthened by observing bursts from this location (either in radio or IR), by continued observations in X-ray and radio of correlated on/off behavior, by observation of larger swings in the X-ray and radio fluxes which would permit a definite X-ray/radio correlation to emerge, or by discovering other radio behavior which is correlated with X-ray behavior of the Rapid Burster (such as short time-scale variability). For example, a program of 12 short VLA observations reaching a noise level of 45 Jy/beam taken at two-week intervals and correlated with contemporaneous RXTE ASM observations would reduce the probability of an unrelated source mimicking the RB to 0.03%, even if the RB remains quiescent in X-rays and there are no radio detections.
5 Discussion of the Radio Observations
The radio observations of the proposed radio counterpart on 1996 November 11.88 determine that the radio spectral slope is flat to inverted with =0.90.3 ().
The JCMT/SCUBA observation at 350 GHz is, to date, the earliest radio observation relative to the beginning of an X-ray outburst. A few hours prior to this observation, a PCA observation measured the RB PE to be 4000100 c/s. Using the measured radio spectral slope (=0.90.3) and the PCA/radio conversion at 8.4 GHz, the extrapolated radio spectrum gives a 350 GHz flux density of 4.5–41 mJy (with uncertainty dominated by the spectral slope). This is well above the 3 mJy upper limit obtained at the JCMT indicating that the radio emission is not a simple power-law spectrum, proportional in intensity to the instantaneous X-ray intensity. This non-detection is also the crucial observation in ruling out one class of synchrotron bubble models (see Section 3).
Synchrotron bubble behavior, associated with the outburst of an X-ray transient, has been observed on many occasions; Hjellming & Han Hjellming & Han (1995) show radio data and fits for A062000, Cen X-4, GS 2000+25, Aql X-1, GS 2023+338 (V404 Cyg), and GRS 1124683 (see also Han (1993)). In that respect the detection of radio emission from the Rapid Burster during its outbursts is not particularly surprising.
The physical parameters derived from our model fits, however, indicate expansion velocities of 1 km sec-1 about 10 d after the outburst start which is well below the physical lower limit set by the sound speed of the hot plasma, km sec-1 (where is the temperature of the plasma in Kelvin, 107 in SS 433 – Hjellming & Johnston (1988)).
Our assumption of a generic bubble event accompanying each outburst is therefore likely to be flawed and we must consider more complex models. For example, radio emission over the course of an outburst may result from the summed emission of a succession of synchrotron bubbles, each of which expands at high speed and therefore brightens and fades (at a given frequency) much more quickly than the emission at large. If the flux levels that we see are produced by plasma, then the expected rise times for the synchrotron bubbles are 1 hour. Alternatively, each of our radio detections may simply have caught a single fast bubble in the midst of its expansion; in that case, the timing of our detections would indicate how the rate of these bubble ejections changes over the course of an outburst. Relevant to both of these possibilities, it is worth noting that the radio flares from GRS 1915+105 have rise and decay times of 1 hour Mirabel et al. (1998); Fender & Pooley (1998).
We are therefore motivated to consider whether the type II X-ray bursts of the Rapid Burster might produce individual synchrotron bubbles, with associated infrared and radio emission. The synchrotron bubbles of GRS 1915+105 have been shown to be related to active accretion, as determined by simultaneous X-ray observations Mirabel et al. (1998); Eikenberry et al. (1998a). Scaling down the brightness of the infrared emission seen in that source by the factor of ten difference in X-ray flux between it and the RB suggests that there may be mJy infrared flares () during RB type II X-ray bursts, if synchrotron bubbles are indeed being formed. We are currently pursuing short time-resolution IR observations of the RB during its next outburst to test this hypothesis; naturally, observation of any bursting counterpart to the RB will confirm or reject the VLA counterpart proposed here.
The radio detections we report here could not themselves have been produced by the type II X-ray bursts; the radio detections were made prior to day 12 of each outburst, while the type II X-ray bursts were not observed until after day 14 in every case.
The observations of 1997 July 24 were carried out when the VLA was in its new CS (C-short) configuration. The combination of the array configuration with low-elevation observing yielded many short projected baselines with lengths all the way down to the antenna separation (25 m). Heavily tapered maps of these data reveal an extended source with peak flux density of approximately 3 mJy (at 8.44 GHz) that is at least as large as the primary beam. The axis of symmetry of the extended source lies at its closest point approximately north-east from the RB, which corresponds to 2.5 pc at the 8.6 kpc distance of the RB. The source is probably unrelated to the RB but its presence is an important consideration for future observations that include short interferometric baselines.
6 Conclusions
We have detected a likely radio counterpart for the Rapid Burster, with radio emission correlated with the X-ray outbursts. The likelihood of unrelated variable radio source duplicating the observed correlation between the X-ray flux and radio flux density is low (1–3%), but not dismissably so. There is an apparent discrepancy between the X-ray position of the RB and the radio counterpart but it is likely due to the non-Gaussian distribution of the X-ray position errors. Confirmation of the counterpart from additional observations – an already approved AXAF observation, further radio observations while the RXTE ASM is still operational, or possibly infrared observations while the RB is in outburst – is required. The time and spectral evolution of the radio source, while not physically interpretable as a full-outburst synchrotron-bubble (as seen in some other transient X-ray binaries), may be due to hour-long radio flares such as have been seen from the superluminal-jet source GRS 1915+105.
Our lower-limit on the time delay between X-ray emission and radio emission from the type II bursts (1 sec) is consistent with the delay expected from a synchrotron bubble. Our observation of a persistent radio source 5 days after the start of active accretion (i.e. an outburst) sets an upper limit for the radio vs. X-ray time delay. The correlation of radio flux density with persistent X-ray intensity in this system indicates that the radio flux density is related to active accretion onto the surface of the neutron star – as accretion is responsible for the X-ray outburst. This suggests that excess radio emission may be produced during the type II X-ray bursts, which are themselves accretion driven. However, our observations produce no evidence of simultaneous radio/X-ray bursts, marginally constraining them (2.9) to be below the level that we observe during periods of comparable X-ray flux in persistent emission. This may imply that radio bursts at 8.4 GHz do not occur simultaneously with X-ray type II bursts.
7 Acknowledgements
We are grateful to Evan Smith, Jean Swank, and the XTE Science Operations Facility staff for their efficient processing of the several XTE TOO observations covered in this work. We are also indebted to VLA observers and staff Phillip Hicks, Robert Hjellming, Rick Perley, Michael Rupen, and Ken Sowinski, who graciously gave us time to perform observations of the RB, to Barry Clark who worked on short-notice to help find the time to make observations during critical periods, to Tasso Tzioumis who performed the observations at ATCA, and to Ian Robson who made possible the observations at the JCMT. We are grateful to M. van der Klis and the anonymous referee for their detailed and helpful comments on the manuscript. This work has been supported under NASA Grant NAG5-7481. JvP acknowledges the support of NASA under grant NAG5-7414. RPF was supported during the period of this research initially by ASTRON grant 781-76-017 and subsequently by the EC Marie Curie Fellowship ERBFMBICT 972436. CBM thanks the University of Groningen for its support in the form of a Kapteyn Institute Postdoctoral Fellowship. RER thanks his host J. Trümper of Max-Planck-Institut für Extreterrestrische Physik, where this work began, and his host Lars Bildsten of UC Berkeley, where this work was completed.
References
- Barr et al. (1987) Barr, P., White, N. E., Haberl, F., Stella, L., Pollard, G., Gottwald, M., & Parmar, A. N., 1987, A&A 176, 69
- Bradt et al. (1993) Bradt, H. V., Rothschild, R. E., & Swank, J. H., 1993, Astronomy and Astrophysics Supplement Series 97, 355
- Calla et al. (1980a) Calla, O. P. N., Barathy, S., Snagal, A. K., Bhandar, S. M., Deshpande, M. R., & Vyas, H. O., 1980a, IAU Circ. 3458
- Calla et al. (1979) Calla, O. P. N., Bhandari, S. M., Deshpande, M. R., & Vats Hari, O. M., 1979, IAU Circ. 3347, 1
- Calla et al. (1980b) Calla, O. P. N., Sangal, A. K., & Barathy, S., 1980b, IAU Circ. 3467
- Chen et al. (1997) Chen, W., Shrader, C. R., & Livio, M., 1997, ApJ 491, 312
- Cui (1997) Cui, W., 1997, ApJ 482, L163
- Cunningham et al. (1994) Cunningham, C. R., Gear, W. K., Duncan, W. D., Hastings, P. R., & Holland, W. S., 1994, Proc. SPIE 2198, 638
- Eikenberry et al. (1998a) Eikenberry, S. S., Matthews, K., Morgan, E. H., Remillard, R. A., & Nelson, R. W., 1998a, ApJ 494, L61
- Eikenberry et al. (1998b) Eikenberry, S. S., Matthews, K., Murphy., T. W., J., Nelson, R. W., Morgan, E. H., Remillard, R. A., & Muno, M., 1998b, ApJ 506, L31
- Fender & Pooley (1998) Fender, R. P. & Pooley, G. G., 1998, MNRAS 300, 573
- Fender et al. (1997) Fender, R. P., Pooley, G. G., Brocksopp, C., & Newell, S. J., 1997, MNRAS 290, L65
- Finger et al. (1996) Finger, M. H., Koh, D. T., Nelson, R. W., Prince, T. A., Vaughan, B. A., & Wilson, R. B., 1996, Nature 381, 291
- Fomalont et al. (1991) Fomalont, E. B., Windhorst, R. A., Kristian, J. A., & Kellerman, K. I., 1991, AJ 102, 1258
- Frail et al. (1996a) Frail, D. A., Kouveliotou, C., van Paradijs, J., & Rutledge, R., 1996a, IAU Circ. 6323, 2
- Frail et al. (1996b) Frail, D. A., Kouveliotou, C., van Paradijs, J., & Rutledge, R., 1996b, IAU Circ. 6307, 1
- Frogel et al. (1995) Frogel, J. A., Kuchinski, L. E., & Tiede, G. P., 1995, AJ 109, 1154
- Fruchter & Goss (1995) Fruchter, A. S. & Goss, W. M., 1995, JRNL. ASTROPHYSICS & ASTRON. V. 16, NO. 2/JUN, P. 245, 1995 16, 245
- Grindlay (1981) Grindlay, J., 1981, in R. Giacconi (ed.), X-ray Astronomy With the Einstein Satellite, p. 79, Dordrecht: Reidel
- Grindlay (1998) Grindlay, J. E., 1998, private communication
- Grindlay et al. (1984) Grindlay, J. E., Hertz, P., Steiner, J. E., Murray, S. S., & Lightman, A. P., 1984, ApJ 282, L13
- Grindlay & Seaquist (1986) Grindlay, J. E. & Seaquist, E. R., 1986, ApJ 310, 172
- Guerriero et al. (1999) Guerriero, R., Fox, D. W., Kommers, J., Lewin, W. H. G., Rutledge, R., Moore, C. B., Morgan, E., van Paradijs, J., van der Klis, M., Bildsten, L., & Dotani, T., 1999, MNRAS, in press
- Han (1993) Han, X. H., 1993, Ph.D. thesis, New Mexico Institute of Mining and Technology
- Hasinger & van der Klis (1989) Hasinger, G. & van der Klis, M., 1989, A&A 225, 79
- Hjellming & Han (1995) Hjellming, R. M. & Han, X., 1995, in Lewin et al. (1995b), p. 308
- Hjellming & Johnston (1988) Hjellming, R. M. & Johnston, K. J., 1988, ApJ 328, 600
- Hoffman et al. (1978) Hoffman, J. A., Marshall, H. L., & Lewin, W. H. G., 1978, Nature 271, 630
- Jahoda et al. (1996) Jahoda, K., Swank, J. H., Giles, A. B., Stark, M. J., Strohmayer, T., Zhang, W., & Morgan, E. H., 1996, Proc. SPIE 2808, 59
- Johnson et al. (1978) Johnson, H. M., Catura, R. C., Lamb, P. A., White, N. E., Sanford, P. W., Hoffman, J. A., Lewin, W. H. G., & Jernigan, J. G., 1978, ApJ 222, 664
- Johnston et al. (1991) Johnston, H. M., Kulkarni, S. R., & Goss, W. M., 1991, ApJ 382, L89
- Kleinmann et al. (1976) Kleinmann, D. E., Kleinmann, S. G., & Wright, E. L., 1976, ApJ 210, L83
- Kouveliotou et al. (1996) Kouveliotou, C., van Paradijs, J., Fishman, G. J., Briggs, M. S., Kommers, J., Harmon, B. A., Meegan, C. A., & Lewin, W. H. G., 1996, Nature 379, 799
- Lawrence et al. (1983) Lawrence, A., Cominsky, L., Lewin, W. H. G., Oda, M., Ogawara, Y., Inoue, H., Koyama, K., Makishima, K., Matsuoka, M., Murakami, T., Ohashi, T., Shibazaki, N., Tanaka, Y., Kondo, I., Hayakawa, S., Kunieda, H., Makino, F., Masai, K., Nagase, F., Tawara, Y., Miyamoto, S., Tsunemi, H., Yamashita, K., Dashido, T., Oka, R., Ohkawa, T., Maruyama, T., Yokoyama, T., Nicholson, G., Balonek, T., Dent, W. A., Glass, I. S., Carter, B. S., Jones, A. W., Selby, M. J., Martinez Roger, C., Sanchez Magro, C., Giles, A. B., Duldig, M., Pramesh Rao, A., Venugopal, V. R., Haynes, R. F., Jauncey, D. L., Okuda, H., Sato, S., Kobayashi, Y., Jugaku, J., Backman, D., Pogge, R., Hodge, P. E., Aller, H. D., & van Paradijs, J., 1983, ApJ 267, 301
- Levine et al. (1996) Levine, A. M., Bradt, H., Cui, W., Jernigan, J. G., Morgan, E. H., Remillard, R., Shirey, R. E., & Smith, D. A., 1996, ApJ 469, L33
- Lewin et al. (1993) Lewin, W., van Paradijs, J., & Taam, R., 1993, Space Sci. Rev. 62, 223
- Lewin et al. (1995a) Lewin, W., van Paradijs, J., & Taam, R., 1995a, in Lewin et al. (1995b), p. 175
- Lewin et al. (1995b) Lewin, W., van Paradijs, J., & van den Heuvel, E. (eds.), 1995b, X-Ray Binaries, Vol. 1, Cambridge University Press
- Lewin et al. (1976) Lewin, W. H. G., Doty, J., Clark, G. W., Rappaport, S. A., Bradt, H. V. D., Doxsey, R., Hearn, D. R., Hoffman, J. A., Jernigan, J. G., Li, F. K., Mayer, W., McClintock, J., Primini, F., & Richardson, J., 1976, ApJ 207, L95
- Lewin et al. (1996) Lewin, W. H. G., Rutledge, R. E., Kommers, J. M., van Paradijs, J., & Kouveliotou, C., 1996, ApJ 462, L39
- Liller (1977) Liller, W., 1977, ApJ 213, L21
- Mirabel et al. (1998) Mirabel, I. F., Dhawan, V., Chaty, S., Rodriguez, L. F., Marti, J., Robinson, C. R., Swank, J., & Geballe, T., 1998, A&A 330, L9
- Picard & Johnston (1995) Picard, A. & Johnston, H., 1995, Astronomy and Astrophysics Supplement Series 112, 89
- Rao & Venugopal (1980) Rao, A. P. & Venugopal, V. R., 1980, ASTRON. SOC. OF INDIA. BULLETIN V. 8, P. 41, 1980 8, 41
- Remillard & Levine (1997) Remillard, R. & Levine, A., 1997, in M. Matsuoka & N. Kawai (eds.), All-Sky X-Ray Observations in the Next Decade, p. 29, Riken: Inst. of Physical and Chemical Research, Japan
- Rutledge et al. (1995) Rutledge, R., Lubin, L., Lewin, W., Vaughan, B., van Paradijs, J., & van der Klis, M., 1995, MNRAS 276, 753
- Tanaka & Lewin (1995) Tanaka, Y. & Lewin, W., 1995, in Lewin et al. (1995b), p. 126
- van der Klis (1995) van der Klis, M., 1995, in Lewin et al. (1995b), p. 252
- Van der Laan (1966) Van der Laan, H., 1966, Nature 211, 1131
- van Paradijs (1996) van Paradijs, J., 1996, ApJ 464, L139
- Windhorst et al. (1993) Windhorst, R. A., Fomalont, E. B., Partridge, R. B., & Lowenthal, J. D., 1993, ApJ 405, 498
- Zhang et al. (1993) Zhang, W., Giles, A. B., Jahoda, K., Soong, Y., Swank, J. H., & Morgan, E. H., 1993, Proc. SPIE 2006, 324