The Optical Gravitational Lensing Experiment.
Investigating the
Influence of Blending on the Cepheid Distance Scale with Cepheids in
the Large Magellanic Cloud111Based on observations obtained
with the 1.3 m Warsaw Telescope at the Las Campanas Observatory of the
Carnegie Institution of Washington
Abstract
We investigate the influence of blending on the Cepheid distance scale. Blending leads to systematically low distances to galaxies observed with HST, and therefore to systematically high estimates of the Hubble constant . We select a sample of 43 long-period, large-amplitude Cepheids in the Large Magellanic Cloud, from the catalog recently released by the Optical Gravitational Lensing Experiment. We then model the effects of blending, as observed by HST at large distances, by adding the -bands contributions from nearby bright stars. We find that the derived distance modulus would be too short, compared to the true value, by mag at distance of and by mag at distance of . This has direct and important implications for the Cepheid distances to galaxies observed by the HST Key Project on the Extragalactic Distance Scale and other teams: half of the KP sample is likely to exhibit a blending bias greater than mag.
1 Introduction
As the number of extragalactic Cepheids discovered with HST continues to increase and the value of is sought from distances based on these variables (Gibson et al. 1999, Saha et al. 1999), it becomes even more important to understand various possible systematic errors which could affect the extragalactic distance scale. Currently, the most important systematic is a bias in the distance to the Large Magellanic Cloud (LMC), which provides the zero-point calibration for the Cepheid distance scale. The LMC distance is very likely 15% shorter than usually assumed (e.g. Udalski et al. 1999a; Stanek et al. 1999), but it still might be considered uncertain at the % level (e.g. Jha et al. 1999). Another possible systematic, the metallicity dependence of the Cepheid Period-Luminosity (PL) relation, is also very much an open issue, with the empirical determinations ranging from 0 to (Freedman & Madore 1990; Sasselov et al. 1997; Kochanek 1997; Kennicutt et al. 1998, Udalski et al. 1999a).
In this paper we investigate a much neglected systematic, that of the influence of blended stellar images on the derived Cepheid distances. Although Cepheids are very bright, at a period of , their images when viewed in distant galaxies are likely to be blended with other nearby, relatively bright stars. Recently Mochejska et al. (1999) showed that a significant fraction of Cepheids discovered in M31 by the DIRECT project (e.g. Kaluzny et al. 1998; Stanek et al. 1998) were resolved into several blended stars when viewed on the HST images. The average FWHM on the DIRECT project ground-based images of M31 is about , or , which corresponds to the HST-WFPC2 resolution of for a galaxy at a distance of . Any luminous star (or several of them) in a volume of that cross section through a galaxy could be indistinguishable from the Cepheid and would contribute to its measured flux.
In this paper we investigate the effects of stellar blending on the Cepheid distance scale by studying Cepheids and their close neighbors observed in the LMC by the Optical Gravitational Lensing Experiment (OGLE: Udalski, Kubiak & Szymański 1997). The catalog of LMC Cepheids has been recently released by Udalski et al. (1999b). As the LMC is times closer to us than galaxies observed by HST, ground-based resolution of allows us to probe linear scales as small as in that galaxy.
We describe the OGLE data used in this paper in Section 2. In Section 3 we apply these data to simulate the blending of Cepheids at various distances. In Section 4 we discuss the implications of our results for the Cepheid distance scale. In Section 5 we propose further possible studies to learn more about the effects of blending.
2 The Data
The data used in this paper came from two catalogs produced by the OGLE project. The first one, with 1333 Cepheids detected in the 4.5 square degree area of central parts of the LMC, has just been released (Udalski et al. 1999b) and it is available from the OGLE Internet archive at http://www.astrouw.edu.pl/~ftp/ogle/. It contains about photometric measurements for the variables, along with their derived periods, photometry, astrometry and classification.
The second catalog, that of photometry for many millions of LMC stars observed by the OGLE project, will be released soon (Udalski et al. 1999c, in preparation). Its construction will be analogous to the SMC maps (Udalski et al. 1998). A typical accuracy of the photometric zero points of the LMC photometric data is about mag for all -bands and the catalog reaches mag.
As our goal was to estimate the influence of blending on the Cepheid distance scale, we selected for further investigations only 54 longest period (), fundamental-mode Cepheids. We further required their -band total amplitude of variations to exceed mag, which corresponds to amplitude of mag in the -band. This is to reflect the fact that in distant galaxies a typical photometric error of prevents discovery of low amplitude Cepheids. We used the -band amplitude criterion because OGLE observes mostly in the -band. The amplitude cutoff reduced the OGLE LMC sample to 47 Cepheids. Finally, we have excluded four highly reddened Cepheids, which left us with 43 variables. It should be noted that because of the CCD saturation limits in the OGLE data the longest period Cepheid in our sample has . This sample will be used to investigate the effects of blending on the Cepheid distance scale.
3 Cepheids and Their Neighbors
The LMC is located at about , or , from us (for simplicity, in the rest of this paper we use the distance scale as adopted by the HST Key Project on the Extragalactic Distance Scale, hereafter: KP). We define two distances for which we simulate the blending using the LMC data: (), somewhat shorter than the median distance of for the KP sample (see Table 1 in Ferrarese et al. 1999), and (), roughly corresponding to the most distant galaxies in which Cepheids were detected with HST (Gibson et al. 1999). The FWHM of HST-WFPC2 is , which at and corresponds physically to area of radius and at the LMC distance.
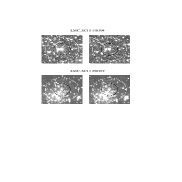
In Figure 1 we show two OGLE LMC Cepheids and their neighbors in the -band (left panels) and the -band (right panels). The images are in size. Also shown are two circles corresponding to the FWHM of HST-WFPC2 camera at and , i.e. and in radius. The two Cepheids were chosen to represent two different situations: the one shown in the top panels, LMC_SC15 118594, has only one bright and nearby, red neighbor at from the Cepheid, and several other, fainter neighbors further away. The second one shown in the bottom panels, LMC_SC11 250872, is located in a very dense stellar region and it is probably a member of a small star cluster. Part of the cluster light would be included in HST-WFPC2 measurements of the Cepheid if the LMC were at while at almost entire cluster light would be included. As discussed later in the paper, large amount of blended light would most probably cause LMC_SC11 250872 to elude detection when observed at large distances.
The OGLE photometric catalog of stars in the LMC extends about six magnitudes, or 0.4% in flux (see Figure 4 of Udalski et al. 1999b) below the bright sample of Cepheids selected in the previous Section. We want to define a criterion to separate stars which will contribute to the flux of a Cepheid when blended together, from those which would contribute only to the background light in the host galaxy. We use a lower limit of 5% of the mean flux of the Cepheid for a star to be included as a blend, but will discuss different values later in the paper.

We use this 5% cutoff in evaluating the sum (Mochejska et al. 1999) of all flux contributions in filter normalized to the flux of the Cepheid:
| (1) |
where is the flux of the i-th companion, the mean intensity flux of the OGLE LMC Cepheid and the total number of companions within either and in radius. In Figure 2 we show the cumulative probability distribution of flux contribution from companions (left panels) and (right panels) within a radius of and of LMC Cepheids. For the smaller radius of 20-25% of our sample is not blended and the contribution of blue blends is somewhat stronger than that of red blends. For the larger radius of all 43 Cepheids are blended to some extent and the contribution of red blends is now more significant than that of blue blends. In the next Section we attempt to use our data to quantify the effects of blending on the Cepheid distance scale.
4 Blending and the Cepheid Distance Scale
We adopt the KP procedure for deriving distances, as given by prescription in Madore & Freedman (1991). LMC is assumed to be at distance modulus of , with LMC Cepheids reddened by mag. When we apply this prescription to the data of our 43 OGLE Cepheids, we obtain values of and mag, i.e. somewhat discrepant, but basically indicating fairly good agreement in photometry. The scatter around the fitted P-L relations (with their slopes fixed to that of the KP prescription) is mag in the -band and mag in the -band.
As the next step we add contributions from the nearby stars to each Cepheid (applying the 5% cutoff discussed in the previous section) in the and band separately and we repeat the distance derivation procedure. To take into account the fact that a heavily blended Cepheids would elude detection, we require that their blended -band total amplitude of variations exceeds mag. The results for simulated distances of and are shown in Figure 3. This Figure shows a number of interesting features and deserves detailed discussion.

For the simulated distance of , the sample of Cepheids is reduced to 35 and the derived distance modulus is smaller than the “true” (unblended) value of by mag. The reddening estimate is mag, smaller than for the unblended sample because of the slightly larger contribution of blue blends, as discussed in the previous Section. The scatter around the fitted P-L relations increases to mag in the -band and mag in the -band. This is because while there are now Cepheids in the sample with fairly substantial blending, it still contains Cepheids with no blending (see Figure 2).
The situation becomes quite dramatic at the simulated distance of (right panel of Figure 3). There are only 13 Cepheids left with -band amplitude larger than mag, with the shorter period (and therefore fainter) Cepheids preferentially removed. The derived distance modulus is smaller than the “true” value by mag, with the reddening estimate mag. What is very interesting is that the scatter around the fitted P-L relations now decreases to mag in the -band and mag in the -band. This is because the sample of Cepheids, while much smaller, is now more homogeneous when it comes to blending. All Cepheids are to some extent blended (see Figure 2), with strongly blended cases removed by the high amplitude requirement.

Since there is such a dramatic difference in blending between the two distances simulated so far, we decided to investigate the blending for a larger number of distances. The results are shown in Figure 4, where blending difference between the true and measured distance modulus is shown as a function of simulated distance. Also shown is the histogram of distances for 24 galaxies for which Cepheid distances with HST were measured or re-measured by the KP (Ferrarese et al. 1999).
The 5% cutoff which we employed to define blended stars is somewhat arbitrary and in reality is most likely a function of data reduction procedure, signal-to-noise in the images etc. We decided to investigate the dependence of blending effects on the cutoff value by using two additional cutoffs: 2.5% and 10%. The results are shown with different symbols in Figure 4. Clearly, the exact value of the blending difference between the true and measured distances modulus depends on the applied cutoff, but the overall trend remains the same.
Looking at the histogram of distances in Figure 4 we can see that half of the KP sample is likely to exhibit a blending bias greater than mag, and in some cases it can be as large as mag. Clearly blending influence on the Cepheid distance scale can be potentially very large and cannot be neglected.
5 Further Studies of Blending and Conclusions
The study of Mochejska et al. (1999) showed that a significant fraction of Cepheids discovered in M31 by the DIRECT project were resolved into several blended stars when viewed on the HST images. As we have shown in this paper, modelling of the blending effects using Cepheids in the LMC possibly indicates a large, mag bias when deriving Cepheid distances to galaxies observed with HST. In addition, blending is a factor which always contributes in only one direction, and therefore it will not average out when a large sample of galaxies is considered. The sign of the blending effect on the is opposite to that caused by the lower LMC distance (e.g. Udalski et al. 1999a; Stanek et al. 1999).
We would like to point out that the blending of Cepheids is likely not only to affect the studies of these stars in different galaxies, but might also affect differential studies, such as that of Kennicutt et al. (1998) in the spiral galaxy M101. Their observed effect that metal-rich (and therefore closer to the center of the galaxy) Cepheids appear brighter and closer than metal-poor (and therefore further away from the center) stars could be partially caused by the increased blending closer to the center of the galaxy, although at this point we make no attempt to estimate how much of this effect would be indeed due to blending.
The bar of the LMC, where most of data discussed in this paper were collected by OGLE, seems on average to have higher surface brightness than a typical KP galaxy (Macri et al. 1999). It would be desirable to further establish the importance of blending for the Cepheid distance scale using a variety of methods and data in a number of different galaxies. Mochejska et al. (2000, in preparation) are now studying the HST archival images of a large sample of Cepheids detected in M33 (Macri et al. 2000, in preparation) by the DIRECT project. An approach analogous to that used in this paper will be employed by Stanek & Udalski (1999, in preparation) for a sample of OGLE Cepheids in the Small Magellanic Cloud, which will have the advantage of including Cepheids with periods of up to in a lower surface brightness system (de Vaucouleurs 1957).
Another approach, closer reproducing the procedure employed by the KP when using Cepheids to determine distances, would be to use HST images of relatively nearby galaxies, such as NGC3031 or NGC5253 (Ferrarese et al. 1999), by degrading them in resolution and signal-to-noise as to represent much more distant galaxies. Unfortunately, much of the data for the several closest galaxies have been taken before the refurbishment of HST and are therefore of inferior spatial resolution compared to later WFPC2 data.
All these studies can provide only an approximate answer to the blending problem, as each individual galaxy can in principle be different in its blending properties. One would like to find a way to constrain or eliminate blending in each individual case. As pointed out by Mochejska et al. (1999), one obvious solution to the problem of blending would be to obtain data with better spatial resolution, such as planned for the Next Generation Space Telescope (NGST). While there will be desire to use NGST to observe much more distant galaxies than with HST, it would be of great value to study some of the not-so-distant ones as well. Another possible approach would be to try to circumvent the blending problem by developing and applying a Period-Amplitude-Luminosity (PAL) relation for Cepheids (Paczyński 1999, private communication), together with image subtraction techniques such as that developed by Alard & Lupton (1998).
References
- (1)
- (2) Alard C., & Lupton, R. H. 1998, ApJ, 503, 325
- (3)
- (4) de Vaucouleurs, G. 1957, AJ, 62, 69
- (5)
- (6) Ferrarese, L. et al. 1999, in “ Cosmic Flows Workshop”, eds. S. Courteau, M. Strauss & J. Willick, ASP series (astro-ph/9908192)
- (7)
- (8) Freedman, W. L., & Madore, B. F. 1990, ApJ, 365, 186
- (9)
- (10) Gibson, B., et al. 1999, ApJ, in press (astro-ph/9908149)
- (11)
- (12) Jha, S., et al. 1999, ApJ, in press (astro-ph/9906220)
- (13)
- (14) Kaluzny, J., Stanek, K. Z., Krockenberger, M., Sasselov, D. D., Tonry, J. L., & Mateo, M. 1998, AJ, 115, 1016
- (15)
- (16) Kennicutt, R. C., et al. 1998, ApJ, 498, 181
- (17)
- (18) Kochanek, C. S. 1997, ApJ, 491, 13
- (19)
- (20) Macri, L. M., et al. 1999, ApJ, submitted
- (21)
- (22) Madore, B. F., & Freedman, W. L. 1991, PASP, 103, 933
- (23)
- (24) Mochejska, B. J., Macri, L. M., Sasselov, D. D., & Stanek, K. Z. 1999, AJ, submitted (astro-ph/9908293)
- (25)
- (26) Saha, A., Sandage, A., Tammann, G. A., Labhardt, L., Macchetto, F. D., & Panagia, N. 1999, ApJ, 522, 80
- (27)
- (28) Sasselov, D. D., et al. 1997, A&A, 324, 471
- (29)
- (30) Stanek, K. Z., Kaluzny, J., Krockenberger, M., Sasselov, D. D., Tonry, J. L., & Mateo, M. 1998, AJ, 115, 1894
- (31)
- (32) Stanek, K. Z., Kaluzny, J., Wysocka, A., & Thompson, I., 1999, AJ, submitted (astro-ph/9908041)
- (33)
- (34) Udalski, A., Kubiak, M., & Szymański, M. 1997, AcA, 47, 319
- (35)
- (36) Udalski, A., Szymański, M., Kubiak, M., Pietrzyński, G., Woźniak, P., & Żebruń, K. 1998, AcA, 48, 147
- (37)
- (38) Udalski, A., Szymański, M., Kubiak, M., Pietrzyński, G., Soszyński, I., Woźniak, P., & Żebruń, K. 1999a, AcA, 49, 201 (astro-ph/9907236)
- (39)
- (40) Udalski, A., Soszyński, I., Szymański, M., Kubiak, M., Pietrzyński, G., Woźniak, P., & Żebruń, K. 1999b, AcA, 49, 223 (astro-ph/9908317)
- (41)