The BeppoSAX view of the hot cluster Abell 2319
Abstract
We present results from a BeppoSAX observation of the rich cluster Abell 2319. The broad band spectrum (2-50 keV) of the cluster can be adequately represented by an optically thin thermal emission model with a temperature of 9.60.3 keV and a metal abundance of in solar units, and with no evidence of a hard X-ray excess in the PDS spectrum. From the upper limit to the hard tail component we derive a lower limit of 0.04 G for the volume-averaged intracluster magnetic field. By performing spatially resolved spectroscopy in the medium energy band (2-10 keV), we find that the projected radial temperature and metal abundance profiles are constant out to a radius of 16′ (1.4 Mpc). A reduction of the temperature of 1/3, when going from the cluster core out to 16′, can be excluded in the present data at the 99 confidence level. From the analysis of the temperature and abundance maps we find evidence of a temperature enhancement and of an abundance decrement in a region localized 6′-8′ NE of the core, where a merger event may be taking place. Finally, the temperature map indicates that the subcluster located NW of the main cluster may be somewhat cooler than the rest of the cluster.
Subject headings:
X-rays: galaxies — Galaxies: clusters: individual (Abell 2319)1. Introduction
Abell 2319 (hereafter A2319) is a rich cluster of galaxies located at a redshift of z=0.056. Dynamical studies in the optical band (see Oegerle et al. 1995, and references therein), have shown that the cluster is actually composed of 2 main clumps. The main cluster and a subcluster localized some 10′ NW of the cD galaxy and behind the main cluster. At radio wavelengths A2319 is permeated by a radio halo (Feretti, Giovannini & Böhringer 1997, hereafter F97), approximatively oriented in the NE-SW direction. In the X-ray band a temperature of 10 keV was measured with the Einstein MPC (David et al. 1993). Analysis of the ROSAT HRI image (F97, Peres et al. 1998) shows that A2319 does not have the strongly peaked radial profile typical of cooling flow clusters. A temperature map of A2319 has been obtained from ASCA data (Markevitch 1996). Recently, Irwin, Bregman & Evrard (1999) have used ROSAT PSPC data to search for temperature gradients for a sample of galaxy clusters including A2319. While the ASCA measurements show a radial temperature gradient (the temperature is about a factor of 2 smaller at about 2 Mpc than at the core), the ROSAT measurement is consistent with a flat temperature profile.
In this Letter we use BeppoSAX data to perform an independent measurement of the temperature map of A2319. We also present the first abundance map of A2319 and the first measurement of the hard (13-50 keV) X-ray spectrum of A2319. The outline of the Letter is as follows. In section 2 we give some information on the BeppoSAX observation of A2319 and on the data preparation. In section 3 we present the analysis of the broad band spectrum (2-50 keV) of A2319. In section 4 we present spatially resolved measurements of the temperature and metal abundance. In section 5 we discuss our results and compare them to previous findings. Throughout this paper we assume Ho=50 km s-1Mpc-1 and qo=0.5.
2. Observation and Data Preparation
The cluster A2319 was observed by the BeppoSAX satellite (Boella et al. 1997a) between the 16th and the 17th of May 1997. We discuss here data from two of the instruments onboard BeppoSAX: the MECS and the PDS. The MECS (Boella et al. 1997b, see Chiappetti et al. 1998 for a particularly attractive interactive presentation) is presently composed of two units, working in the 1–10 keV energy range. At 6 keV, the energy resolution is and the angular resolution is 0.7′ (FWHM). The PDS instrument (Frontera et al. 1997) is a passively collimated detector (about 1.51.5 degrees f.o.v.) working in the 13–200 keV energy range. Standard reduction procedures and screening criteria have been adopted to produce linearized and equalized event files. Both MECS and PDS data preparation and linearization was performed using the Saxdas package under Ftools environment. The effective exposure time of the observation was 3.8104 s (MECS) and 2.0104 s (PDS). The observed countrate for A2319 was 0.9080.006 cts/s for the 2 MECS units and 0.580.04 cts/s for the PDS instrument. All spectral fits have been performed using XSPEC Ver. 10.00. Quoted confidence intervals are 68 for 1 interesting parameter (i.e. ), unless otherwise stated.
3. Broad Band Spectroscopy
We have extracted a MECS spectrum from a circular region of 16′ radius (1.4 Mpc) centered on the emission peak. From the ROSAT PSPC radial profile (see F97), we estimate that about 90 of the total cluster emission falls within this radius. The background subtraction has been performed using spectra extracted from blank sky event files in the same region of the detector as the source. The PDS background-subtracted spectrum has been produced by plain subtraction of the “off-” from the “on-source” spectrum. The spectra from the two instruments have been fitted simultaneously, with an optically thin thermal emission model (MEKAL code in the XSPEC package), absorbed by a galactic line of sight equivalent hydrogen column density, , of 7.85 cm-2. A numerical relative normalization factor among the two instruments has been added to the spectral fit. The reason is two-fold: a) the BeppoSAX instrument response matrices employed in this Letter (September 1997 release) exhibit slight mismatches in the absolute flux calibration; b) the PDS instrument field of view (1.3 degrees FWHM) covers the entire emission from the cluster, while the MECS spectrum includes emission out to 1.4 Mpc from the X-ray peak. Taking into account the mismatch in the absolute flux calibration, the vignetting of the PDS instrument and the fraction of the emission falling outside of the MECS extraction region, we estimate a normalization factor of 0.76. In the fitting procedure we allow the normalization value to vary within 15 from the above value to account for the uncertainty in this parameter. The MEKAL model is found to fit the data adequately ( 183 for 164 d.o.f.). The best fitting values for the temperature and the metal abundance are respectively 9.60.3 keV and 0.250.03, where the latter value is expressed in solar units. The PDS data shows no evidence of a hard X-ray excess. However, we can derive a lower limit to the volume-averaged intracluster magnetic field, B, responsible of the diffuse radio emission located in the central region of the cluster. The radio halo spectrum shows an index 0.92 in the (408-610) MHz frequency range and 2.2 in the range (610-1400) MHz; the radio flux is 1 Jy at 610 MHz (F97). From the PDS data we can place a 90 confidence upper limits of 2.310-11 erg cm-2 s-1 and 2.010-11 erg cm-2 s-1 for a power-law spectrum with energy index 0.92 and 2.2, respectively. Relating the synchrotron radio halo flux to the X-ray flux upper limits, assuming inverse Compton scattering of relativistic electrons with the 3K background photons, we determine lower limits of B of 0.04 G and 0.035 G, respectively. The equipartition magnetic field is estimated to be 0.48 G (F97). We determine also upper limits to the energy density of the emitting electrons of 1.4 erg cm-3 and 9.3 erg cm-3 for and 2.2, respectively, using a size of 0.66 Mpc in radius for the radio halo.
4. Spatially Resolved Spectral Analysis
A proper analysis of extended sources requires that the spectral distortions introduced by the energy dependent PSF be correctly taken into account. In the case of the MECS instrument onboard BeppoSAX the PSF, which is the convolution of the telescope PSF with the detector PSF, is found to vary only weakly with energy (D’Acri, De Grandi & Molendi 1998). This lack of a strong chromatic aberration results from the fact that the telescope PSF degradation with increasing energy is approximatively balanced by the improvement of the detector spatial resolution. Though we expect spectral distortions to be small, we have taken them into account using the Effarea program publicly available within the latest Saxdas release. The Effarea program convolves the ROSAT PSPC surface brightness with an analytic model of the MECS PSF to estimate the spectral distortions. A more extensive description of the method may be found in D’Acri, De Grandi & Molendi (1998). The Effarea program also includes corrections for the energy dependent telescope vignetting, which are not discussed in D’Acri et al. (1998). The Effarea program produces effective area files, which can be used to fit spectra accumulated from annuli or from sectors of annuli.
4.1. Radial Profiles
We have accumulated spectra from 6 concentric annular regions, with inner and outer radii of 0′-2′, 2′-4′, 4′-6′, 6′-8′, 8′-12′ and 12′-16′. The background subtraction has been performed using spectra extracted from blank sky event files in the same region of the detector as the source. For the 5 innermost annuli the energy range considered for spectral fitting was 2-10 keV, while for the outermost annulus, due to the strong contribution of the instrumental background in the 8-10 keV band, the fit was restricted to the 2-8 keV range.
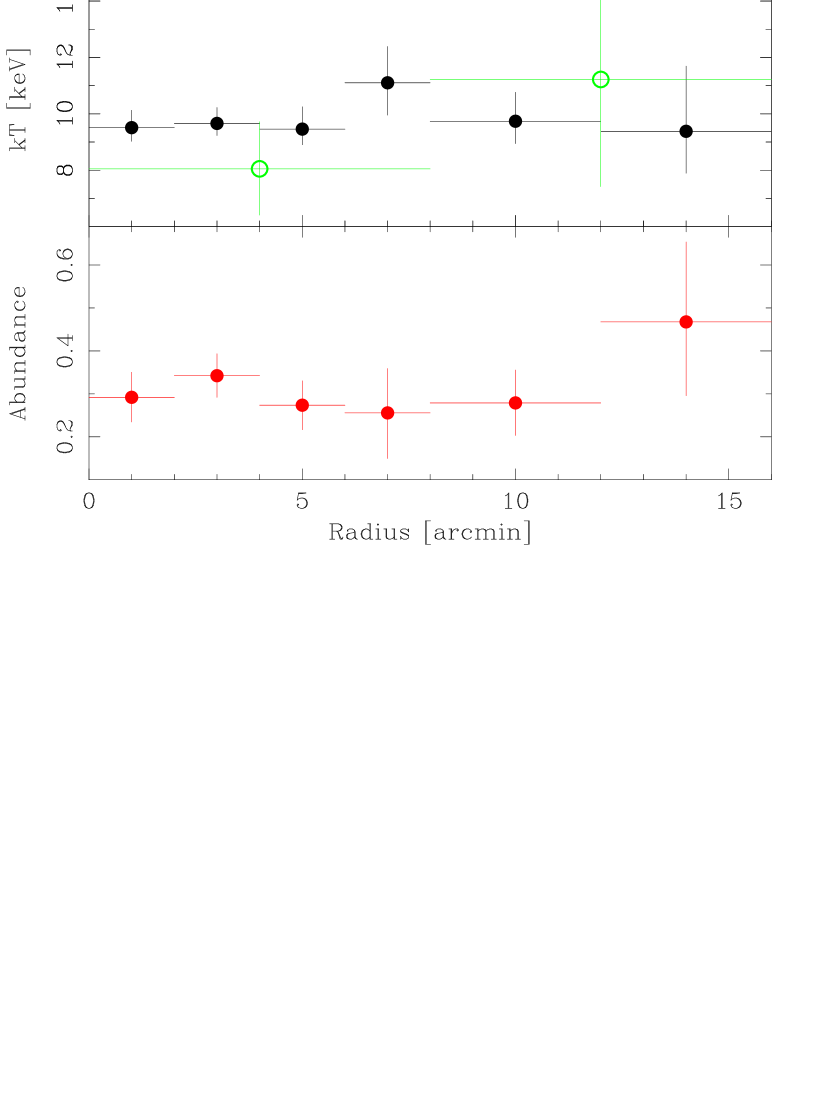
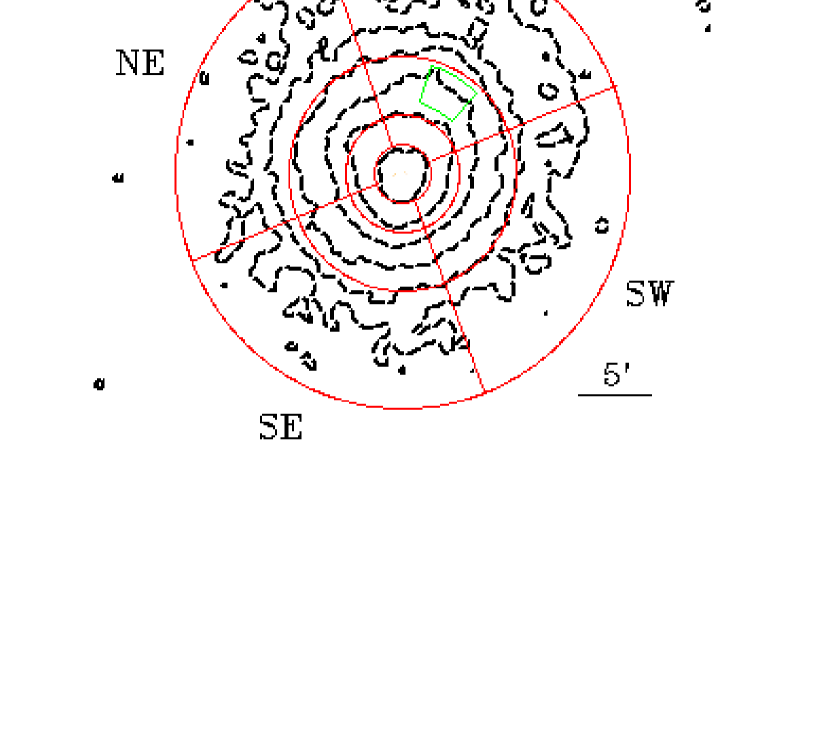
The ROSAT PSPC and HRI images of A2319 (F97) show excess emission, with respect to a radially symmetric profile, in the NW and NE direction. Although the resolution of the MECS image (see figure 2) is considerably poorer than that of the ROSAT images, evidence of the excess is seen also in our data. The excess emission in the NW direction is most likely associated to a subcluster identified from velocity dispersion measurements (Oegerle et al. 1995), while the structure in the NE direction is coincident with diffuse radio emission observed at 20 cm (F97). To avoid possible contaminations to the radially averaged spectra we have excluded data from the NW and NE sectors of the third and fourth annuli. An analysis of the excluded sectors is presented in the next subsection. We have fitted each spectrum with a MEKAL model absorbed by the galactic of 7.85 cm-2. In figure 1 we show the temperature and abundance profiles obtained from the spectral fits. The average temperature and abundance for A2319 are found to be respectively: 9.70.3 keV and 0.300.03, solar units. The temperature profile is flat, with no indication of a temperature decline with increasing radius. A reduction of the temperature of 1/3, when going from the cluster core out to 16′ (1.4 Mpc), can be excluded in the present data at the 99 confidence level. The abundance profile is consistent with being flat, although the large error associated to the outermost annulus prevents us from excluding variations in this region. An abundance enhancement of a factor 2 in the innermost region can be excluded in these data at more than the 99.99 level.
We have used the Fe Kα line as an independent estimator of the ICM temperature. We recall that for temperatures larger than a few keV the Fe line comes mostly from the He-like Fe line at 6.7 keV, and the H-like Fe line at 7.0 keV. As the temperature increases the contribution from the He-like Fe line decreases while the contribution from the H-like Fe line increases, thus the intensity ratio of the He-like Fe line to the H-like Fe line can be used to estimate the temperature. The MECS instrument does not have sufficient spectral resolution to resolve the 2 lines, but it can be used to determine the centroid of the observed line, which depends on the relative contribution of the He-like and H-like lines to the observed line and therefore on the gas temperature. The position of the centroid of the Fe Kα line is essentially unaffected by the spectral distortion introduced by the energy dependent PSF and it depends only weakly on the the adopted continuum model. Thus it allows us to derive an independent and robust estimate of the temperature profile. Considering the limited number of counts available in the line we have performed the analysis on 2 annuli with bounding radii, 0′-8′ and 8′-16′. We have fitted each spectrum with a bremsstrahlung model plus a line, both at a redshift of z=0.056 (ZBREMSS and ZGAUSS models in XSPEC), absorbed by the galactic . A systematic negative shift of 40 eV has been included in the centroid energy to account for a slight misscalibration of the energy pulseheight channel relationship near the Fe line. To convert the energy centroid into a temperature we have derived an energy centroid vs. temperature relationship. This has been done by simulating thermal spectra, using the MEKAL model and the MECS response matrix, and fitting them with the same model, which has been used to fit the real data. In figure 1 we have overlaid the temperatures derived from the centroid analysis on those previously obtained through the thermal continuum fitting. The two measurements of the temperature profile are in agreement with each other. The moderate statistics available in the line does not allow us to place very tight constrains on temperature gradients.
4.2. Maps
We have divided A2319 into 4 sectors: NW, including the subcluster located behind A2319, SW, SE and NE. Each sector has been divided into 3 annuli with bounding radii, 2′-4′, 4′-8′ and 8′-16′. In figure 2 we show the MECS image with the sectors overlaid. The background subtraction has been performed using spectra extracted from blank sky event files in the same region of the detector as the source. We have fitted each spectrum with a MEKAL model absorbed by the galactic .
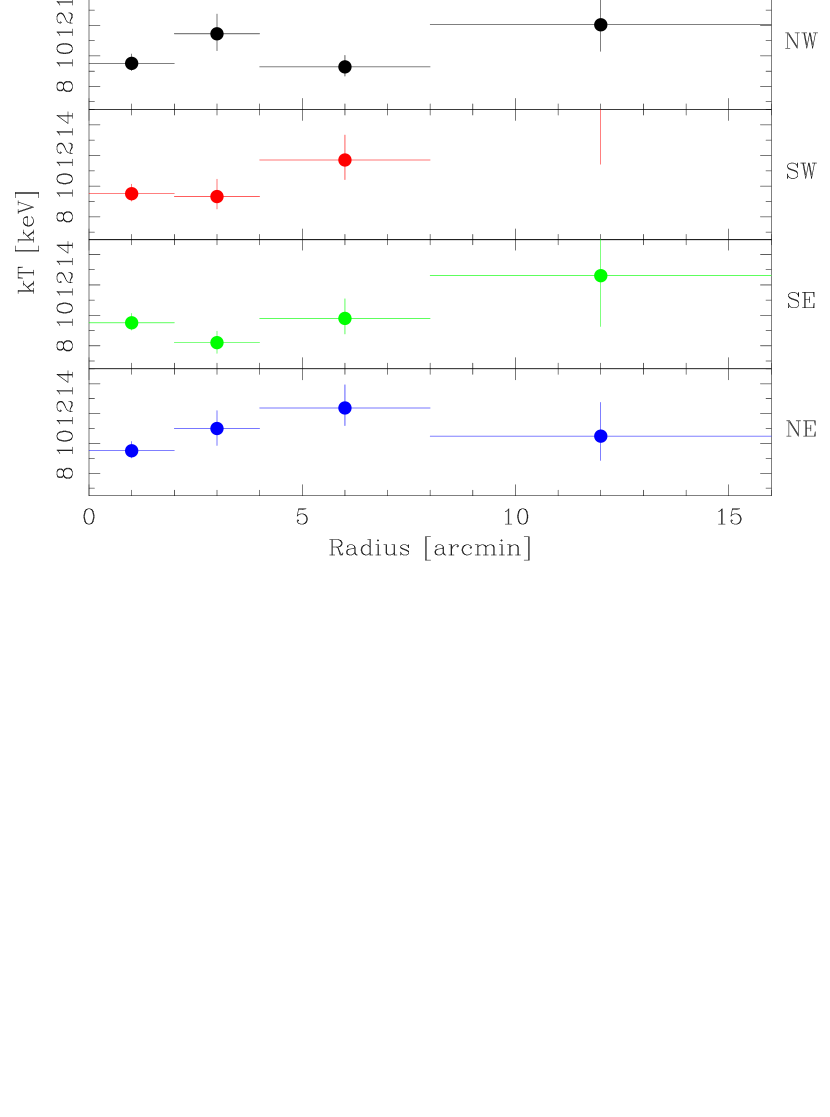
In figure 3 we show the temperature profiles obtained from the spectral fits for each of the 4 sectors. In all the profiles we have included the temperature obtained for the central region with radius 2′. Fitting each radial profile with a constant we derive the following average sector temperatures: 9.80.4 keV for the NW sector, 9.70.5 keV for the SW sector, 9.10.5 keV for the SE sector and 10.10.5 keV for the NE sector. All sector averaged temperatures are consistent with the average temperature for A2319 derived in the previous subsection. The values derived from the fits indicate that all temperature profiles are consistent with being flat. The temperature of the third annulus (bounding radii 4′-8′) of the NE sector is found to be higher than the average cluster temperature at a significance level of . No significant temperature decrement is found in the third annulus (bounding radii 4′-8′) of the NW sector, where the subcluster is localized. Since this region includes the emission of the subcluster as well as a fare amount of emission by A2319, we have accumulated a spectrum from a smaller sector (see figure 2), centered on the subcluster evidenced in figure 2. For this region we find a temperature of 6.9 keV indicating that the subcluster may have a somewhat lower temperature than A2319.
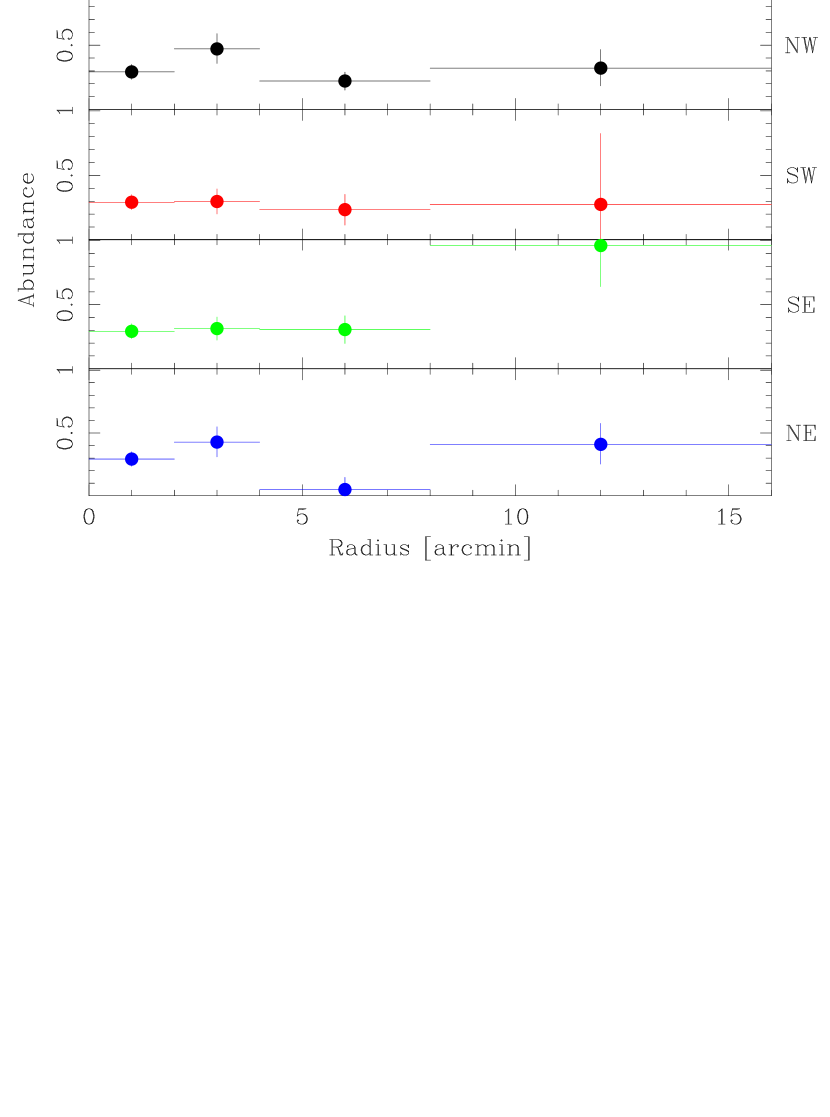
In figure 4 we show the abundance profiles for each of the 4 sectors. In all profiles we have included the abundance obtained for the central region with bounding radius 2′. Fitting each radial profile with a constant we derive the following sector averaged abundances: 0.290.04 for the NW sector, 0.290.05 for the SW sector, 0.300.04 for the SE sector and 0.270.04 for the NE sector. All sector averaged abundances are consistent with the average abundance for A2319 derived in the previous subsection. The values derived from the fits indicate that all abundance profiles are consistent with being constant. The abundance of the third annulus (bounding radii 4′-8′) of the NE sector is found to be smaller than the average cluster abundance at a significance level of . The abundance of the subcluster estimated from the third annulus (bounding radii 4′-8′) of the NW sector 0.220.07, or from the smaller sector, shown in figure 2, 0.280.11, is consistent with the average abundance of A2319.
5. Discussion
Previous measurements of the temperature structure of A2319 have been performed by Markevitch (1996), using ASCA data, and by Irwin et al. (1999), using ROSAT PSPC data. The average temperature, 10.00.7 keV, and abundance 0.30.08, reported by Markevitch are in good agreement with those presented in this work. The temperature profile presented by Markevitch shows that the cluster is isothermal, kT 11 keV, within 10′ (0.9 Mpc) from the core (however a slightly cooler spot associated to the NW structure is found in this region), the temperature in the annulus with bounding radii 10′-20′ (0.9-1.8 Mpc) is smaller kT 8 keV, finally in the outermost bin, 20′-24′ (1.8-2.1 Mpc), the temperature falls to about 4 keV, however the author remarks that this last point should be considered less reliable than the others. The BeppoSAX data shows no evidence of a temperature decline within 16′ (1.4 Mpc) from the cluster core. A reduction of the temperature of 1/3, when going from the cluster core out to 16′, can be excluded at the 99 confidence level. To compare the ASCA measurement with ours, we have converted the 90 confidence errors reported in figure 2 of Markevitch (1996) into 68 confidence errors by dividing them by 1.65 (this is the factor that Markevitch & Vikhlinin 1997 apply to the 68 confidence errors of Briel & Henry 1994 to convert them to 90 errors). When we compare the individual data points covering the same radial range we find that the temperature differences are always significant at less than the 90 level. To compare the profiles we have derived the best fitting linear relationship for the ASCA profile and compared it with our data finding a of 21.9 for 6 d.o.f. (probability of 1.3). We have also compared the best fitting linear relation from our profile to the ASCA profile finding a 12.4 for 3 d.o.f (probability of 6.1). Therefore, it seems that the two profiles are incompatible with one another. Recently Irwin, Bregman & Evrard (1999) have used ROSAT PSPC hardness ratios to measure temperature gradients for a sample of nearby galaxy clusters, which includes A2139. From their analysis they conclude that A2319 is isothermal out to 18′ from the cluster core. From the analysis of the temperature map we find an indication of a smaller than average temperature, 6.9 keV , at the position of the subcluster. A similar result, was also found in Markevitch (1996).
The average abundance of A2319 has been previously measured using ASCA data, by Markevitch (1996), who finds 0.30.08, by Fukazawa et al. (1998), who find 0.170.03 for Fe and 0.460.54 for Si, and by Allen & Fabian (1998), who find 0.330.06. Our measurement, like Markevitch’s, given the adopted spectral ranges (E2.0 keV and E2.5 keV respectively) is essentially an Fe abundance measurement. Our results are in agreement with the measurements by Markevitch (1996) and by Allen & Fabian (1998) and in disagreement with the one presented by Fukazawa et al. (1998). In this Letter we present, for the first time, abundance profiles and maps for A2319. The radial abundance profile is flat. A2319 seems to conforms to the general rule that non-cooling flow clusters do not present abundance enhancements in their core. In the third annulus (bounding radii 4′-8′) of the NE sector we find evidence of a temperature increase and of an abundance decrease, with respect to the average values, both significant at about the 95 level. F97, from the analysis of ROSAT PSPC and HRI images, find evidence of excess emission in this region. The same authors, from the analysis of the 20 cm radio map of A2319, find also evidence of diffuse radio emission in this region. They argue that the presence of the X-ray and radio structure may be the result of an on going merger event in the NE direction. Our measurement of a temperature increase in the region supports their conjecture. Indeed simulations show that clusters undergoing a merger event should experience a temperature enhancement in the merger region (e.g., Schindler & Müller 1993). The detection of an abundance decrease in the same region may indicate that the subcluster merging with A2319 is poor in metals.
References
- (1) Allen, S., W., & Fabian, A., C. 1998, MNRAS, 297, L63
- (2) Boella, G., Butler, R. C., Perola, G. C., Piro, L., Scarsi, L., & Bleeker, J. A. M. 1997a, A&AS, 122, 299
- (3) Boella, G., et al. 1997b, A&AS, 122, 327
- (4) Briel, U. G., & Henry, J. P. 1994, Nature, 372, 439
- (5) Chiappetti, L., et al. 1998 http://sax.ifctr.mi.cnr.it/Sax/Mecs/tour.html
- (6) D’Acri, F., De Grandi, S., & Molendi S. 1998, Nuclear Physics, 69/1-3, 581 (astro-ph/9802070)
- (7) David, L. P., Slyz, A., Jones, C., Forman, W., Vrtilek, S. D., & Arnaud, K. A. 1993, ApJ, 412, 479
- (8) Feretti, L., Giovannini, G., & Böhringer 1997, New Astronomy, 2, 501 (F97)
- (9) Frontera, F., Costa, E., Dal Fiume, D., Feroci, M., Nicastro, L., Orlandini, M., Palazzi, E., & Zavattini G. 1997, A&AS 122, 357
- (10) Fukazawa, Y. et al. 1998, PASJ, 50, 187
- (11) Fusco-Femiano, R., Dal Fiume, D., Feretti, L., Giovannini, G., Grandi, P., Matt, G., Molendi, S., & Santangelo, A. 1999 ApJL, 513, 21
- (12) Irwin, J. A., Bregman J. N., & Evrard A. E. 1999, ApJ in press, (astro-ph/9901406)
- (13) Markevitch, M. 1996, ApJL, 465, 1
- (14) Markevitch, M., & Vikhlinin, A. 1997, ApJ, 474, 84
- (15) Oegerle, W. R., Hill, J. M., & Fitchett, M. J. 1995, AJ, 110, 32
- (16) Peres, C. B., Fabian, A. C., Edge, A. C., Allen, S. W., Johnstone, R. M., & White, D. A. 1998, MNRAS, 298, 416
- (17) Schindler, S., & Müller, E. 1993, A&A, 272, 137