Periodic Microvariation of B416, a New LBV in M33
Abstract
We report optical photometric and spectroscopic observations of the M33 star B416, establishing it as the fifth identified LBV in that galaxy. The B magnitude of the star varies with a period of 826 and an amplitude of 0.03 magnitude. The red end of the optical spectrum does not seem to partake in these oscillations, which we identify as the microvariations, known to persist in LBV stars. B416 is the first LBV with such oscillations that are strictly periodic and coherent over at least 10 years. The brightness of the star is also varying on a longer (years) time scale, again mainly in its blue light. The spectrum has most of the characteristics of an LBV in quiescence, showing Balmer, He i, Fe ii and [Fe ii] emission lines. The flux and profile of some of these lines are varying but the scarcity of the observations prevents us from establishing their characteristic time scale. B416 is at the centre of an H ii region, another indication of the relatively young age of this stellar system.
keywords:
stars: variables: other – stars: emission-line – stars: individual: B416 – galaxies: individual: M331 Introduction
1.1 The M33 survey
During the years 1986 and 1987 the local group galaxy M33 was monitored nightly at the Tel-Aviv University Wise Observatory (WO) for two months in each year. This program was intended to search for potential SS433 candidates in M33, since this almost face on nearby galaxy is a most promising case for locating such a unique system outside the Milky Way. The survey comprised 15 star fields in M33, with each one containing one or more extremely bright blue and red giants selected from the luminous star survey performed earlier by Humphreys & Sandage (1980). Our primary goal was to find luminous stars in M33 that show large variability in their light curves. We chose to check for periodic variations all stars that had a standard deviation larger than 0.03 mag in their measured magnitudes. Periodic oscillations might hint at binarity and would make such a luminous star an SS433 candidate which could be confirmed by a search for ”moving lines” in its spectrum [Margon et al. 1979].
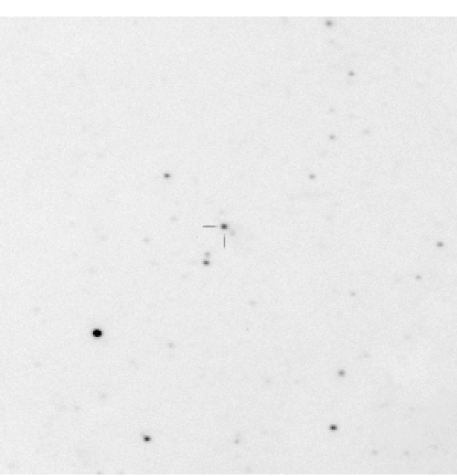
The reduction procedure of the survey images (described briefly in § 2.1) yielded 12 objects with measurable light variations. For one of these objects a period of 8 days was found [Shemmer & Leibowitz 1998]. This object was identified as B416, a blue giant in the M33 survey of bright blue and red stars [Humphreys & Sandage 1980], as an H emitter in M33, no. 24, 130e of field l in Calzetti et al. (1995), who also give the 1950.0 coordinates of the star as RA: 01:31:17.370 DEC: +30:26:26.26. We reobserved the star in 1997/98, photometrically and spectroscopically, in order to reconfirm its periodic variability and to check the possibility regarding it as an SS433 candidate. The collection of photometric and spectroscopic data does not support the SS433 hypothesis. It led us instead, to accept the identification of the star as an LBV, and to interpret all our results in the light of this identification.
1.2 B416
B416 has been recognized as a bright blue star in several surveys in the past, but no variability of it has been so far reported. Humphreys & Sandage (1980) list it as a bright blue star with mV=16.3 and BV=0.29 while according to Calzetti et al. (1995) the star’s magnitude is mV=16.76 and it is among the stronger H emitters in M33 with an EW(H) of 109.1Å. According to Massey et al. (1996), B416 is also one of the brightest UV sources in M33, listed there as UIT301 and is classified as one of five new LBV candidates in that galaxy. The following photometric properties of B416 are also given there: mV=16.29, BV=0.11, M8.8 and UB=0.82, indicating again a very luminous object. The different magnitude estimates given to B416 by different authors might hint on its variability. The discrepancy between the BV colours may be related to genuine colour variations (see § 3). It may also be due to differences in the assumed colour correction that should be applied to this star, since the reddening across M33 is not uniform [Massey et al. 1995].
2 Observations and Reductions
2.1 Photometry
Photometry of B416 was performed with the 1m telescope of the WO. The survey observations in 1986 & 1987 used the RCA pixel thinned CCD camera and were performed with no filter (Clear). Following the discovery of periodicity in the light curve of B416, we renewed in 1997 the nightly monitoring program of its field, this time using the Tektronix pixel back-illuminated CCD camera, described in Kaspi et al. (1995). Observations in the 1997-98 season were carried out in B & V filters as well as in Clear and the latest observational season in 1998-99 used mainly U,B,V,R,I filters and few Clear observations. The I filter used at the WO is somewhat redder than the standard Johnson bandpass, because its red end is determined by the CCD camera cut-off, which has a longer tail toward lower frequencies. In order to look for shorter time scale variations (i.e. minutes or hours) we devoted three nights to conducting continuous time series measurements of B416. On the first night, 1997 November 26, we took 46 Clear frames during 3 hours and on the next two nights, 1998 December 6 and 7 we took 63 images spanning 8 hours and 48 images spanning 6 hours respectively, using filters B,R & I sequentially for both nights. The total number of data points taken in each filter every season appears in Table 1. Several attempts were made to calibrate the magnitude of B416. They all failed due to unfortunate non photometric sky conditions. Throughout this work we therefore use instrumental, relative magnitudes, which are far less sensitive to these conditions.
| Season/Filter | Clear | U | B | V | R | I |
| 1986 | 25 | – | – | – | – | – |
| 1987 | 43 | – | – | – | – | – |
| 1997-98 | 96 | – | 29 | 30 | – | – |
| 1998-99 | 8 | 30 | 76 | 40 | 77 | 72 |
Aperture photometry measurements on the biased and flat field corrected CCD frames were carried out using the NOAO IRAF111IRAF (Image Reduction and Analysis Facility) is distributed by the National Optical Astronomy Observatories, which are operated by AURA, Inc., under cooperative agreement with the National Science Foundation. daophot package [Stetson 1987]. A final set of data files was later obtained using the WO daostat reduction program, which determined the object star magnitude, uncertain to within 15 mmag, relative to a set of standard stars in its field (see Netzer et al. (1996) for a full description of the reduction process). Such a set was created for each filter. The 1986 data, that were acquired during the initializing run of the first CCD camera of the WO, turned out to be too noisy for our time series analysis (uncertainty in magnitude of over 30 mmag) and were left out of our further analysis.
2.2 Spectroscopy
Spectroscopy of B416 was carried out in the 1998-99 season in order to look for SS433-like features in the spectrum of the star. The observations were done at the WO and at the Apache Point Observatory (APO) in New Mexico using the 3.5m telescope. Spectra were taken on seven nights at the WO and on three nights at the APO. The WO images were taken with the Faint Object Spectroscopic Camera (FOSC) attached to the Tektronix CCD described above using a 10″ wide blue sensitive long-slit and a 600 lines/mm grating [Kaspi et al. 1995]. Each night four images of B416 were taken, two at PA=45° and two at PA=135° in order to gather more information on the morphology of the nebula surrounding the star. B416 lies at the detection limit of our spectrograph, which is 16 mag. We therefore took two images of the star for each PA, each exposed for 1 hour, thus totaling in 4 hours of observation each night. Since our FOSC imager setup has a resolution of 2″ per pixel, we were not able to resolve B416 from its SE neighbouring star B417 (UIT299 in Massey et al. 1996) and from the surrounding nebulosity. The APO observations were performed on 1998 August 31, November 24 and December 14 UT using the double imaging spectrograph (DIS) attached to the 3.5m telescope. Blue and red sensitive chips were used each night where the blue chip is a 512x512 UV coated Tek CCD and the red is an 800x800 TI CCD. The slit was 1.5″ wide oriented in an EW direction and the gratings were 830.8 (1200) lines/mm in blue (red). These observations were made during times of fairly good seeing (1.5, 1.2 and 1.7 arcsec chronologically on each of the 3 nights) so that B416 is well resolved from its neighbour B417. Some blend with nebular emission from foreground, background and nearby nebulosity is of course unavoidable.
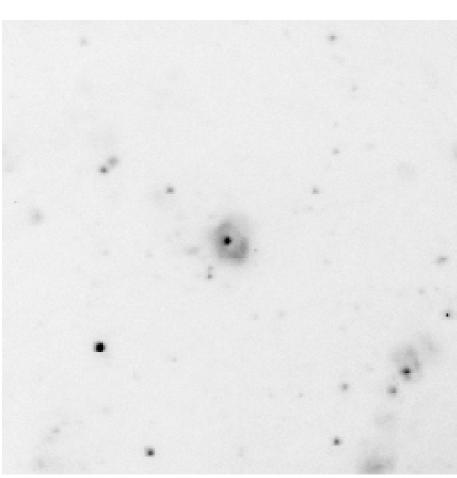
Reduction of all spectra was conducted using the IRAF specred package. Since no spectroscopic standards were observed at the WO when the spectra were taken, the spectrum was flux calibrated using the WO standard coefficients, which generally do not change significantly from night to night. The spectra extend from 3600 to 7200Å with a dispersion of 3.8Å per pixel (about 8Å resolution). The APO spectra on the other hand were taken along with spectroscopic standards and were therefore flux calibrated accordingly. The APO images of the spectrum came in pairs of red and blue bands, where the blue images extend from 4200 to 5000Å with a dispersion of 1.6Å per pixel (about 3Å resolution) and the red images extend from 5800 to 6800Å with a dispersion of 1.3Å per pixel (about 2.5Å resolution). In both bands we were able to spatially resolve some of the nebulosity around the star (this was impossible with the images taken at WO), and were therefore able to extract also the spectrum of the line-of-sight nebulosity in the following way: the images of B416 were reduced once using a sky background that was subtracted from the star’s aperture and once using the background that was selected as the mean spatial extension of the nebula seen in the images. We therefore obtained two types of spectra for each band: one including the light from the starthe line-of-sight nebulosity and another including the star’s light only (assuming a spatially homogeneous nebula around the star). Subtracting the latter spectra from the first resulted in a spectrum of the line-of-sight nebula alone. The fact that the nebula surrounding B416 is in fact not homogeneous but instead has a ring-like structure can be seen in Fig. 2. All spectra were cleaned of cosmic rays and bad pixels.
3 Data Analysis
3.1 The LC and periodicity
3.1.1 Periodic Variation
The normalised power spectrum (PS) [Scargle 1982] of the BVRI data is plotted in Fig. 3. The B & V PS imply a period of 826009, which can also be seen in R & I, but with a very low power. This period is also seen in the Clear PS, although due to some high noise in this data set, a higher peak in the PS is seen for 814003 [Shemmer & Leibowitz 1998]. This peak is however still consistent with the above period within the uncertainty limits. The scarcity of the U data (only 30 data points) made it unusable for period searching. The 826003 period in the last two seasons is within 2 of the 8602 period found for Clear in 1987 [Shemmer & Leibowitz 1998] thus indicating that the period remained stable during the past decade. We remark that when calculating the PSa, for each of the 3 nights that were used to look for shorter periodicities, we utilized only one data point randomly selected, in order to keep even weights in the data.

The reliability of the period in B, V and Clear was checked by splitting each data set into two seasonal subsets and verifying that the same period (within the uncertainty limits, described below) appears in every subset. We checked the significance of the period by a Bootstrap technique [Efron & Tibshirani 1993] on a sample of 1000 artificial LCs constructed by randomly permutating the magnitudes of each subset. The reality of the periodicity found in the B, V and Clear filters was found to be significant at a 99% confidence level. The uncertainty in the value of the period was determined again by the Bootstrap technique, this time by a least square fitting of a sine function to the data, subtracting it from the LC and then randomly adding the residuals to the sine data values. Next we found the peak frequency of 1000 artificial LCs so created. In the histogram of the distribution of the peak frequencies we determined the interval that contains 980 results. This is given above as a 98% significant interval around the period value.
In order to check whether B416 varies on a time scale shorter than days, we analysed the data collected during the three nights of continuous monitoring. All three nights did not show any periodicity nor any significant variability, i.e. above 15 mmag.
3.1.2 Long Term Variations
When we compare the magnitude of B416 in Clear between 1987 and 1997, we discover that in 1997 the star was fainter by 0.170.03 mag than in 1987. This comparison was done using three standard stars in the field of B416, which did not vary by more than 0.02 mag during the past 11 years. We also measured the mean flux centred at the 6100 continuum of our APO spectra and used it to calibrate the star’s V magnitude using the value of Fλ at that wavelength given by Calzetti et al. (1995); we obtained a V magnitude of 16.70.1 mag for B416, which is consistent with the value 16.76 (see §3.3) they give based on their observations of M33 during the 1986 & 1987 seasons. It therefore seems that the red continuum of B416 remained essentially constant between the epochs of 1987 and 1998. The fading in Clear is accordingly due to a fading in the blue band of more than 0.17 mag, since Clear covers the whole range of optical light and our CCD is more sensitive in the red than in the blue band. Another change in the B and V brightness of the star is apparent between the 1997-98 and 1998-99 seasons. In order to amplify the effect we binned the data into 7 bins in each season (roughly one month per bin) and then calculated the mean magnitude of each binned season. Fig. 4 displays the binned B and V LCs. One can see that in B the star brightened by 0.06 mag and in V it brightened by 0.04 mag between the two seasons. In the B case this brightening is significant, since the difference in the mean magnitudes is larger than the combined standard deviation of each season’s mean, while in V, the uncertainty in the magnitude is a little larger than the difference in mean magnitudes. This again manifests the fact that much like the 826 periodic oscillations, the longer term variations are also occuring mainly in the blue end of the spectrum.

3.2 The shape of the periodic modulation
The calculated ephemeris for the B & V filters is:
T(min)HJD E
The set of folded LCs along with a fitted sinusoid are plotted in
Fig. 5 and a plot of a binned B LC along with a two-harmonic
fit is shown in Fig. 6. It is apparent in Fig. 5
that the amplitude of the modulation decreases with
increasing wavelength. In fact the modulation is clearly
recognizable only in B & V, while in R & I the magnitude is practically
constant. This fact also follows from the PS of each filter’s data set
(Fig. 3). Since B & V are varying in phase, the modulation
of the BV colour has only a small amplitude.
In Figure 6 one can see that the folded B LC, the filter in which the signal is strongest, is not a perfect sinusoid. This pattern of a flat-top LC is also apparent in the folded V and Clear LCs, although not as vivid as in B. In order to verify the significance of the distorted sinusoid, we calculated the phase of each filter’s second harmonic. They all fell within 0.13 of the cycle of one another. For random deviation from a sine function, the probability of obtaining such a crowding of the phase values is 1.7%. Thus the non harmonic structure of the periodic LC seems to be systematic and significant.


3.3 Spectroscopy
3.3.1 The spectra of B416
We did not perform any spectral measurements on the WO spectra and restricted ourselves only to line identification and general properties of the spectrum due to the poor resolution, S/N ratio and inability to resolve B416 from B417 and the nebulosity. The APO spectra on the other hand were clean of large light contributions from external sources (except for several faint stars around B416) and we were able to separate B416 from the surrounding nebula. The three sets of APO spectra were analysed using the IRAF splot task to measure line and continuum properties. The relatively high resolution of these spectra enabled us to deblend sets of nearby lines and to detect variations in line profiles. Table 2 lists the mean measured properties of some of the major identified lines in the spectra, which are presented in Figures 7& 8. The line properties such as flux, EW etc. were averaged among the three spectra and the errors in the measured properties represent the STD of the mean. In this sense an error larger than about 10% (a rough estimation of the uncertainty in flux calibration) in a measured property in one of the major strong lines of the star indicates a possible variation between the three epochs. In the nebular lines the errors are much larger due to lower fluxes and differences in the subtraction parameters used to extract the line-of-sight nebula between the three epochs (see § 2.2).
The spectrum of B416 in general resembles that of a blue hypergiant, or more specifically an LBV in quiescence, as suggested in Massey et al. (1996). It shows mainly Balmer, He i, Fe ii and [Fe ii] emission (B416 is also identified in Corral (1996) as object S145 where it is classified as a compact H ii region). The main spectral feature is the strong H emission, which can be evaluated from Table 2 as having the luminosity of 1700 L☉ (using a distance of 800kpc to M33) and an EW of -1062 Å, which is consistent with the -109.1 Å value measured for this star by Calzetti et al. (1995). The measured wavelengths of the centroids of the main emission lines do not vary by more than 0.5 Å (smaller than our resolution) from night to night and remain blueshifted by about 200 km/sec, which is characteristic of the systemic velocity of M33. The structure of the Balmer and some of the He i emission lines has a rather complex form and might decompose into a narrow component sitting on top of a broad emission [Smith et al. 1997]. In particular the Hα and Hβ lines have wings with width of the order of 1000 km/s, whereas the half width at half maximum of these lines is of the order of 150 km/sec.
In Figure 7 one can see that the red-band continuum remained practically constant during the three observations, while in Figure 8 the blue-band continuum shows a tendency of increasing flux towards shorter wavelengths, chronologically from August to December 1998. Also apparent in Figures 7& 8 and in Table 2 is the fact that the Balmer emission remains constant to within 10% accuracy in flux and profile, while the He i emission lines vary in flux and shape. In the November spectrum we see the development of P Cygni profiles in the He i emission lines, which is especially pronounced in the He i 4471 line. These P Cygni profiles in the He i lines indicate velocities of 300 km/sec as measured from the peak of emission to the minimum of the P Cygni trough. Another feature apparent in the November spectrum is the strengthening of Fe ii and [Fe ii] lines compared with the August and December spectra; especially pronounced is the Fe ii 4556 line, which increased its flux manifold.


| Line | Source | Flux (x erg ) | EW (Å) |
|---|---|---|---|
| H4340 | star | 7.90.4 | -5.00.8 |
| nebula | 0.90.3 | ||
| Hei4471 | star | 1.80.4 | -1.20.3 |
| Hei4713 | star | 1.00.3 | -0.70.2 |
| H4861 | star | 252 | -17.50.4 |
| nebula | 2.40.9 | ||
| Hei4922 | star | 1.40.2 | -1.00.1 |
| Oiii4959 | nebula | 0.220.02 | |
| Oiii5007 | nebula | 0.790.04 | |
| Hei5876 | star | 4.61.5 | -62 |
| Nii6548 | nebula | 0.200.04 | |
| H6563 | star | 872 | -1062 |
| nebula | 3.30.4 | ||
| Nii6584 | nebula | 0.740.01 | |
| Hei6678 | star | 1.700.03 | -31 |
| Sii6717 | nebula | 0.50.2 | |
| Sii6731 | nebula | 0.400.07 |
3.3.2 Variations in the continuum
Our next goal was to see whether our spectral data portrays the observed photometric variability described in §3.1. The red continuum indeed shows no variation, which is in agreement with the very low amplitude observed for the R and I LCs. As mentioned in §3.3.1, the blue continuum tends to increase from August to December. These continuum variations seem not to be related to the 826 periodicity, since according to the ephemeris (§3.2) the calculated phases for the times of the APO spectra are: 0.58, 0.85 and 0.27 for the August, November and December images respectively. This should imply a near-maximum light for August and a near-minimum light for November, contrary to what is seen in Fig. 8. Instead we recall the fact that the LC of B416 displayed a gradual increase in magnitude (§3.1.2) during the latest season. This light increase was more prominent in B than in V and is also seen in the spectra by the blue tail that grows gradually from August to December 1998. Therefore we suggest that our spectra display continuum variations mainly due to the long-term variability of the star.
3.3.3 Variations in the lines
Variations in emission lines are clearly seen for the He i, Fe ii and [Fe ii] lines (§3.3.1). Four of the He i lines (ruling out the He i5876, recorded in the Red branch of our spectrometer, which is noisier than the Blue one) also show the development of P Cygni profiles in the November spectrum (close to minimum phase) as described in §3.3.1. Due to the minor contribution of the emission lines to the total flux, it is very unlikely that the emission variation in the He and Fe lines alone is the source for the light variation. Since we have only three spectra spread over some 100 days, it is difficult to learn whether these variations are related to the short- or long-term variations or any combination of the two.
3.3.4 The nebula
B416 is surrounded by nebulosity as can be seen clearly in Figure 2. This nebulosity is No. 77 in the catalogue of Courtès & Cruvellier (1965) of H ii regions in M33 and is a relatively bright H ii region in that galaxy. Boulesteix et al. (1974) describe this H ii region as having a physical size of about 105 82 pc (equivalent to the angular size of 27 21 arcseconds on the sky) and a distance of about 1.2 kpc from the centre of M33. The ring-shape structure of this H ii region around B416 is also seen in the spatial axis of the spectra and might hint at a connection with the star. It therefore suggests that B416 is a comparatively young system. The spectra of the line-of-sight nebula (as described in §2.2) show the characteristic nebular lines, i.e. Balmer, [O iii], [S ii] and [N ii] emission. Measured fluxes of the nebular lines are listed in Table 2. As in the case of B416, the lines remain fixed at a blueshifted system of 200 km/sec. The nebular lines are very narrow and have practically no recognizable Doppler broadening in our resolution. Due to the absence of [O iii] 4363 and [N ii] 5755 lines from the spectrum, we are not able to make a definite estimation of the temperature in the nebula. However, the absence of the first line suggests low temperatures. On the other hand the two [S ii] 6717,6731 lines enable us to estimate the electron density in the nebula in the regular manner, using the data presented in Table 2. The ratio [S ii] 6717/6731 estimated as 1.3, implies an electron density of Ne 100 . We also extracted the ratio (the absence of [N ii] 5755 does not change the ratio much due to its relatively low contribution) and obtain a value of 1, which is characteristic of an H ii region rather than a circumstellar LBV shell [Pasquali et al. 1998].
The Balmer decrement of the nebular emission lines can be used, in principle, for estimating the interstellar extinction in the direction to B416. The H ratio has in our spectra a mean value of 1.5. There is however a very large uncertainty in this value, due to the fact that in our measurements of the two lines, two different CCD chips are employed and the flux of both lines is very low. The H ratio takes the value 0.4. Although the uncertainty in this value is also large, it seems to indicate a rather low extinction towards the H ii region. This is consistent with the general low value of the foreground extinction in the direction of M33 [Massey et al. 1995].
4 Discussion
In this section we discuss the implications of the observational results presented in this work on our understanding of the nature of B416, on its proper evolutionary status and on some of its observational properties.
4.1 The nature of the periodicity
One of the most common astronomical clocks that produce observed coherent periodic variations is the orbital revolution of a stellar binary system. In fact, the structure of the periodic component in the LC of B416, presented in Fig. 6 is reminiscent of an eclipsing binary light curve. This possibility is however severely constrained by the photometric properties of B416 that we found, namely, the colour-dependence of the periodic variation and the 7% change in total flux between minimum and maximum phase. From the values given in §1.2 it is apparent that the system’s luminosity is at least 3x10⁵L☉, hence the dip in the LC corresponds to about 2x10⁴L☉. Two leading eclipsing models are considered: (1) a small blue star with luminosity of 2x10⁴L☉ being occulted by the brighter primary; (2) a rather faint star (less than 2x10⁴L☉) that can cover in its inferior conjunction an area of roughly 7% of the surface of the primary. Both models fail primarily on the basis of not being able to explain the colour-dependent variation. Spectroscopically, there are no detectable Doppler shifts larger than 20 km/sec in the lines and no absorption lines or bands are observed, which might account for a companion. These spectral properties also set serious limitations on the mass and luminosity of the companion. For example, if we assume that the mass of the primary is of the order of 20M☉ and that the inclination angle of the system is 90° then a velocity of less than 20 km/sec corresponds to a mass of less than 1.5M☉ for the companion, which in turn cannot account for the observed dip in brightness if it is a main sequence star. On the other hand, we can assume that the companion may be a compact object, surrounded by an accretion disc which contributes the 104L☉ energy and therefore its occultation can be the source of variation. Such an energy output by an accretion disc is not observed even for high mass X-ray binaries. A white dwarf or a neutron star companion hypothesis can be rejected also on the grounds of evolution, since we hardly expect to find an evolved star inside a young H ii region orbiting a very young and massive system like B416. Even if the progenitor of the evolved star lost most of its mass to the primary, it is unlikely that several 10M☉ were transfered within the lifetime of the surrounding nebula. The likelihood of a neutron star or a black hole, two possible relics of a supernova, to be a companion of B416 is also small since there is no observational indication, photometrically or spectroscopically of the presence of a SNR in the area. We therefore regard binarity as a highly unlikely cause of the observed periodic light variation.
4.2 Single star interpretation (LBV?)
Rejecting binarity as the source for the periodic variation does not mean however, that B416 is not a binary or even a multiple system, since it may be a non-eclipsing, low inclination binary system. We proceed, however, with our classification of B416, considering it as a single star. This is justified because it appears that the observed high luminosity and most of the stellar spectral features are indeed contributed by one star alone. In order to do so we list here the observed major spectroscopic and photometric properties of B416:
-
(1).
M
-
(2).
BV 0
-
(3).
UB 0.8
-
(4).
L
-
(5).
Large amplitude light variations on long time scales
-
(6).
Light variations (0.1 mag) on a short time scale
-
(7).
Amplitude of light variations increases bluewards
-
(8).
Spectrum shows H i, He i, Fe ii and [Fe ii] emission
-
(9).
Spectral variations in both continuum and lines
-
(10).
P Cygni profiles exhibiting velocities of 300 km/sec
The first property listed above is taken from Massey et al. (1996), who also give the apparent V magnitude of B416 as 16.29 (consistent with the value given by Humphreys & Sandage (1980), see §1.2). Taking into account the estimated extinction due to the foreground reddening of M33 AV=0.22 and a distance modulus of =24.5 [van den Bergh 1991], we obtain an estimated absolute magnitude of M8.43. This value is different by some 0.4 magnitudes from the value given by Massey et al. (1996). The source of the difference is probably in a different distance modulus and/or a different extinction value that they used. If we assume even smaller or no extinction at all towards B416, as we found for the surrounding nebula in §3.3.4, the value of MV may increase up to M8.21. But even this number indicates a very luminous star. While the photometric characteristics refer to an A-type supergiant, the spectrum does not resemble that of an A-type star, nor that of any O- or B-type stars, particularly since it does not show any absorption features. The spectrum of B416 also does not resemble that of a WR star nor of an Ofpe/WN9 star (reclassified as WN9-11 stars by Smith, Crowther and Prinja (1994)), mainly due to the absence of He ii and N iii lines. The spectrum of B416 rather indicates relatively low temperatures, consistent with the measured intrinsic zero BV colour. Given its comparatively high luminosity, its variational properties and the peculiar spectral features as listed above, we are bound to classify B416 as an LBV.
It was already mentioned in §1.2 that on the basis of total luminosity, colour and spectrum alone, B416 can in fact be classified only as an LBV candidate, in quiescence. According to our study, B416 indeed shows spectral resemblance with the spectrum given by Massey et al. (1996), who also emphasizes the fact that spectroscopically B416 and the other four newly found LBV candidates in M33, all resemble each other and also the star Var C, the well known LBV in M33. The spectrum of B416 taken by Massey et al. (1996), which shows the characteristic LBV quiescence spectrum, was taken in 1995 (just three years before ours) and the relatively high UV flux they measure for the star further confirms the warm phase scenario [Humphreys and Davidson 1994]. The appearance of prominent He i emission lines in our spectra is consistent with this warmer phase of B416, i.e. visual minimum state. Our classification receives yet another support from the latest work on the discovery of LBV candidates in M31 [King et al. 1998]. All five candidates discovered in that galaxy show remarkable spectral similarity to B416. In particular we mention the observed properties of B416 that can be deduced from Table 2 and §3.3 above, such as the [S ii]/H ratio, the H luminosity (which is believed to be contributed mainly by the stellar wind), EW(H) and the terminal velocity. All these are quite in agreement with the values given in that work for the LBV candidates in M31.
As an LBV, B416 is certainly among the faintest members of this class of stars. We may sub-classify it as an R 71 type LBV [Bohannan 1997] and locate it at the bottom of the S-Dor instability strip in the HR diagram, among R 71 of the LMC, R 40 of the SMC and HR Car of our own galaxy [Humphreys and Davidson 1994]. This suggested location on the HR diagram implies that at its current minimum state, the effective temperature of B416 is of the order of T12,000 K. As mentioned above, however, we are aware of the fact that classification cannot be made on spectroscopic grounds alone, even when it comes to such rare objects as LBVs.
In order to be fully entitled as an LBV, a star has to change its magnitude considerably, by some 0.5 to 2 magnitudes, on a time scale of years or decades [Bohannan 1997]. B416 was not observed or reported to have large light variations spanning years or decades, and in this sense it could undermine our classification. If, however, an amplitude-luminosity relation exists for LBVs, as suggested by Humphreys and Davidson (1994), then B416 has potentially quite a small amplitude for such long-term variations. These variations, commonly referred to as S-Dor (SD) phases [Sterken et al. 1997], might be very small for B416. They might well have been overlooked in the past, since little or any photometric data, beside those in this work, exist for the star. It may well also be that the 0.17 magnitude difference in Clear that we measured between 1987 and 1997 is indicative of a small scale SD phase of B416, as expected in low luminosity LBVs. On the other hand, this difference in magnitude can be just a fraction of a larger amplitude SD phase, that might have occured between those two years or even before 1987. We therefore believe that it is suitable to classify B416 as a true LBV.
4.3 Periodic microvariations in B416
In the previous section we argued that according to our observations and the available archived data, it is very likely that B416 is a relatively faint LBV with a mass of the order of 20M☉ [Humphreys and Davidson 1994]. From here it is a straightforward step to describe the small amplitude light variations that we observe as the microvariations of this LBV star. The period 8 day is well within the range of quasi-periods measured in known LBVs (see Breysacher 1997 and Lamers et al. 1998). These microvariations, also observed in Cygni type supergiants, are mainly irregular or quasi-periodic [Lamers et al. 1998] and are attributed to pulsational instabilities of the LBV (or blue supergiant) due to the increase of luminosity up to and near the Eddington luminosity. The observed microvariations in B416 increase in amplitude with decreasing wavelength. This behaviour is observed in LBVs in quiescence, since during that stage of the SD phase the star is more compact and hot, giving it a blue colour [Lamers et al. 1998]. Periodic microvariations were recently reported in the LBV HD 5980 [Breysacher 1997]. This detection was based on observations that were carried out during one observational season (between 1995 and 1996). Our data indicate periodic microvariations of B416, which are coherent and stable over a whole decade.
5 Summary
We conclude that B416 is an LBV of the rather fainter sub-class R 71. It should therefore be added to the list of 32 known LBVs [Bohannan 1997] as the fifth known LBV in M33 and could be placed near R 71 on the HR diagram. The detected periodic light variation is evidence for periodic and stable microvariations found for the first time in an LBV. A continued photometric followup of this interesting star is required in order to look for the anticipated SD phase and to keep an eye on the clock of the microvariations. A dense spectroscopic monitoring is also required in order to correlate the spectra with the microvariations, while high resolution spectroscopy might detect the LBV circumstellar nebula, which is expected around LBVs due to a large amount of mass loss [Humphreys and Davidson 1994].
Acknowledgments
We would like to thank Noah Brosch who helped in the coordination of the initial 1986/87 Wise Observatory photometric survey of luminous stars in M33, and Anna Heller who participated in it and performed most of its data reduction. We acknowledge the assistance of Gaghik Tovmassian and Camron Hastings in obtaining some of the APO spectra. We also thank Shai Kaspi and Liliana Formiggini for their assistance in the photometric and spectroscopic reduction procedures. We are grateful to WO staff members Ezra Mashal, Friedel Loinger, Sami Ben-Gigi and John Dan for their crucial contribution to this project. This research has made use of the SIMBAD database, operated at CDS, France. Astronomy at the WO is supported by grants from the Israel Science Foundation. We would like to thank the referee for his useful comments.
References
- [Bohannan 1997] Bohannan B., 1997, Luminous Blue Variables: Massive Stars in Transition, ASP conf. V. 120, Ed. Nota A., and Lamers H.
- [Boulesteix et al. 1974] Boulesteix J., Courtes G., Laval A., Monnet G., and Petit H., 1974, A&A, 37, 33
- [Breysacher 1997] Breysacher J., 1997, Luminous Blue Variables: Massive Stars in Transition, ASP conf. V. 120, Ed. Nota A., and Lamers H.
- [Calzetti et al. 1995] Calzetti D., Kinney A.L., Ford H., Doggett J., Long K.S., 1995, AJ, 110, 2739
- [Corral 1996] Corral L.J., 1996, AJ, 112, 1450
- [Courtès & Cruvellier 1965] Courtès G., and Cruvellier P., 1965, Ann. Astrophys, 28, 4, 683
- [Efron & Tibshirani 1993] Efron B., and Tibshirani R.J., 1993, An Introduction to the Bootstrap, Chapman & Hall
- [Humphreys and Davidson 1994] Humphreys R.M., and Davidson K., 1994, PASP, 106, 1025
- [Humphreys & Sandage 1980] Humphreys R.M., Sandage A., 1980, ApJS, 44, 319
- [Kaspi et al. 1995] Kaspi S., Ibbetson P. A., Mashal E., Brosch N., Wise Observatory Manual, Wise Observatory Technical Report 95/6
- [King et al. 1998] King N.L., Walterbos R.A.M, and Braun R., 1998, ApJ, 507, 210
- [Lamers et al. 1998] Lamers H.J.G.L.M., Bastiaanse M.V., Aerts C., and Spoon H.W.W., 1998, A&A, 335, 605
- [Margon et al. 1979] Margon, B., Ford, H. C., Grandi, S. A., and Remington, P. S. S., 1979, ApJL, 233, 63
- [Massey et al. 1995] Massey P., Armandroff T.E., Pyke R., Patel K., Wilson C.D., 1995, AJ, 110, 2715
- [Massey et al. 1996] Massey P., Bianchi L., Hutchings J.B., Stecher T. P., 1996, ApJ, 469, 629
- [Netzer et al. 1996] Netzer H. et al., 1996, MNRAS, 279, 429
- [Osterbrock 1989] Osterbrock D.E., 1989, Astrophysics of Gaseous Nebulae and Active Galactic Nuclei, University Science Books
- [Pasquali et al. 1998] Pasquali A., Nota A., and Clampin M., 1998, ESO preprint, 1309
- [Scargle 1982] Scargle J.D., 1982, ApJ, 263, 835
- [Shemmer & Leibowitz 1998] Shemmer O., Leibowitz E.M., 1998, IBVS, 4595
- [Smith et al. 1994] Smith L.J., Crowther P.A., and Prinja R.K., 1994, A&A, 281, 833
- [Smith et al. 1997] Smith L.J., Stroud M.P., Esteban C., and Vilchez J.M., 1997, MNRAS, 290, 265
- [Sterken et al. 1997] Sterken C., van Genderen A.M, and de Groot M., 1997, Luminous Blue Variables: Massive Stars in Transition, ASP conf. V. 120, Ed. Nota A., and Lamers H.
- [Stetson 1987] Stetson P.B., 1987, PASP, 99, 191
- [van den Bergh 1991] van den Bergh S., 1991, PASP, 103, 609
- [van Genderen et al. 1998] van Genderen A.M, Sterken C., and de Groot M., 1998, A&A, 337, 393