06 (03.11.1; 16.06.1; 19.06.1; 19.37.1; 19.53.1; 19.63.1)
Antonella Vallenari (vallenari@pd.astro.it)
e-mail: vallenari@pd.astro.it,richichi@arcetri.astro.it,carraro,lgirardi@pd.astro.it,
Near-infrared photometry of the young open clusters NGC 1893 and Berkeley 86 ††thanks: Based on observations taken at TIRGO
Abstract
We present photometry in the J and K near-infrared bands for two regions centered on the young open clusters NGC 1893 and Berkeley 86. We study 700 stars down to K = 17 in the field of NGC 1893, and about 2000 stars in the field of Berkeley 86 down to K 16.5, for which near-infrared photometry was insofar not available. Coupling J-K data with UBV photometry taken from literature, we produce reddening corrected colour-magnitude diagrams. We find that our data are consistent with previous determinations: the clusters are roughly coeval with an age between 4 and 6 million years. The mean reddening (measured as E(J-K)) values turn out to be 0.35 and 0.50 for NGC 1893 and Berkeley 86, respectively.
Using colour-colour plots we discuss the presence of candidate pre-main sequence stars showing infrared excess. Candidates are found in both cluster regions, confirming the young age of these clusters.
keywords:
Photometry: infrared – Open Clusters –NGC 1893: individual – Berkeley 86: individual
1 Introduction
Open clusters and associations in the Galactic disk are the best tools
to investigate the distribution of population inside the
disk and the spiral arms.
We have undertaken a
project to obtain deep near-infrared photometry
of Galactic open clusters, aimed at deriving age, age spread, reddening,
distance.
About 10 clusters have already been observed.
In the first paper, the ages of the old open clusters Berkeley 18 and
Berkeley 17
have been derived and compared with the age of the Galactic disk (Carraro
et al 1999).
In this paper we present J and K photometry for two young open
clusters: NGC 1893 and Berkeley 86, whose fundamental properties
are listed in Table 1. Two forthcoming papers will discuss the age of
King 5 and IC 166, NGC 7789 respectively.
NGC 1893 is a very young cluster involved in the bright diffuse
nebulosity IC 410, associated with two pennant nebulae, Shain and Gaze
129 and 130,
and obscured by several conspicuous dust clouds.
UBV photometry of NGC 1893 has been carried out by Cuffey (1973)
and Massey et al (1995).
More than 39 members are
bright early spectral type stars, responsible for the photoionization
of the IC 410 nebula.
Tapia et al (1991, TCER hereafter) perform near-infrared and Strömgren
photometry for 50 stars down to K = 12.00. They
estimate the age of the cluster to be yr, derive
the distance modulus , and the reddening Av=1.68.
Strömgren photometry for 50 stars in the field of NGC 1893
has also been reported by Fitzsimmons (1993), who confirms the
distance and age found by TCER.
Berkeley 86 is another young open cluster, located inside the OB
association Cyg OB 1, and obscured by a foreground dust cloud.
Optical photometry was carried out by Forbes et al (1992) in the UBV
pass-bands, and in the UBVRI bands by Deeg & Ninkov (1996) and Massey et al
(1995).
They find that the cluster has an age of yr, is
moderately reddened (E(B-V) ) and has an initial mass
function close to the Salpeter one. Berkeley 86 hosts the famous eclipsing
binary system V444 Cygni.
Strömgren photometry has also been obtained by Delgado et al (1997)
down to V = 19, who derive a slightly older age ( yr)
and a distance modulus of .
No infrared photometry exists for this cluster.
In this paper we present near-infrared photometry for these two clusters, down to the limiting magnitude of K . In Section 2 we detail the observations and data reduction process. In Section 3 and 4 we discuss in turn for NGC 1893 and Berkeley 86 clusters the derived colour-magnitude diagrams and the detection of pre-main sequence candidates. We summarizes our results in Section 5.
| Cluster | Diameter | Age | AV | Reference | |||
|---|---|---|---|---|---|---|---|
| o | o | () | Myr | ||||
| NGC 1893 | 173.59 | -1.70 | 13 | 4 | 1.68 | 13.18 | Tapia et al (1991) |
| Berkeley 86 | 76.66 | 1.26 | 6 | 5 | 3.1 | 11.1 | Massey et al (1995) |
| 8.5 | Delgado et al (1997) |
2 Observations and data reduction
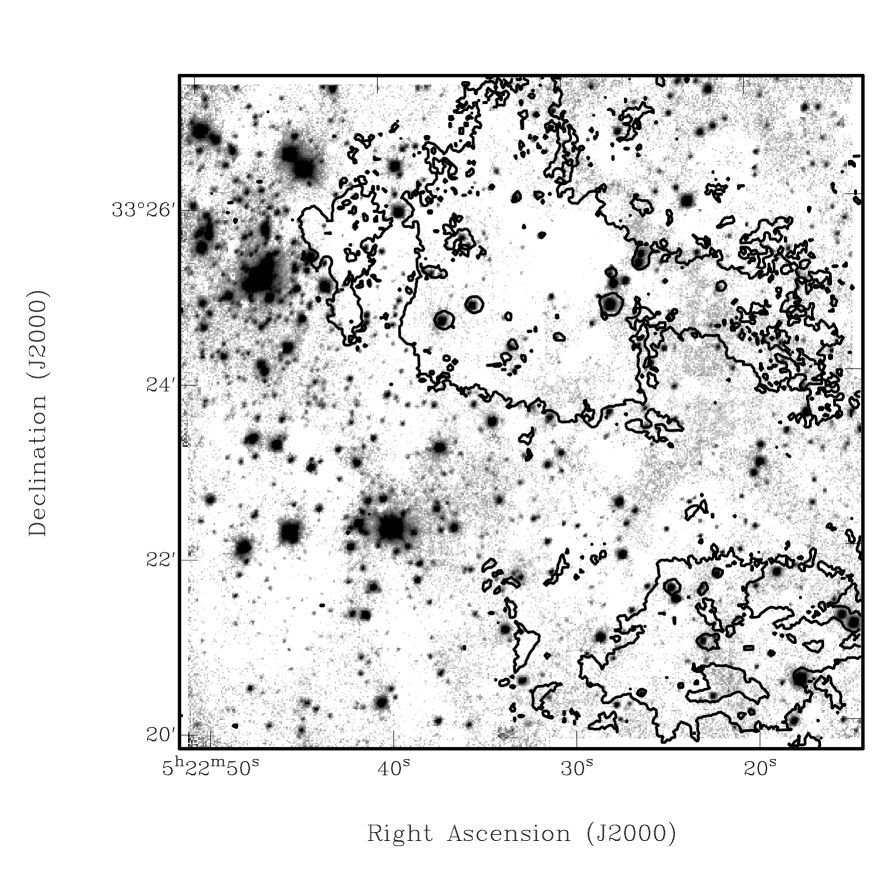
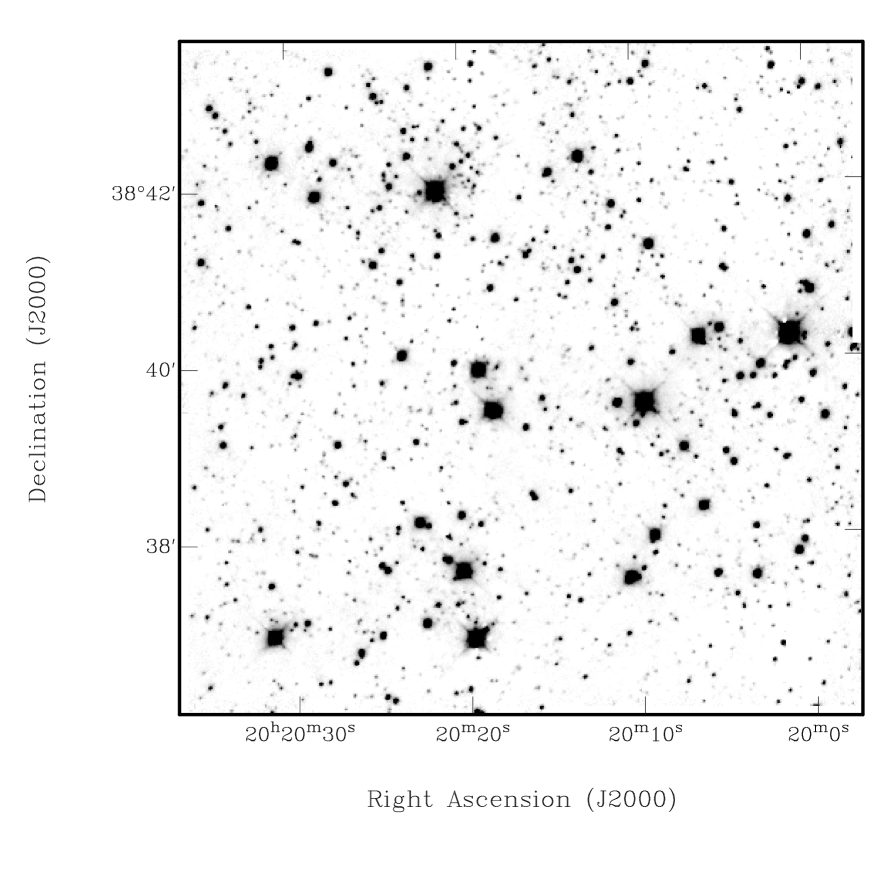
J (1.2 m) and K (2.2 m) photometry of the two clusters was obtained with 1.5m Gornergrat Infrared Telescope (TIRGO) equipped with Arcetri Near Infrared Camera (ARNICA) in October 1997. ARNICA relies on a NICMOS3 256 256 pixel array (gain=20 eADU, read-out noise=50 e- angular scale =1pixel, and 4 4′ field of view). Through each filter 4 partially overlapping images of each cluster were obtained, covering a total field of view of about 8 8 ′ , in short exposures to avoid sky saturation. The observed field of NGC 1893 is covering approximately the SW quadrant of the region studied by Tapia et al (1991). Only about of the total cluster area has been covered by our observations. The field was chosen to study the stellar content of the dark clumps in NGC 1893. The observed field of Berkeley 86 includes the vast majority of this cluster. Berkeley 86 was studied by Deeg & Ninkov (1996) who derive U,B,V,R,I photometry for stars in a slightly smaller field of 66. The log-book of the observations is given in Table 2 were the total exposure times are given. The nights were photometric with a seeing of 1-1.5. Figs. 1 and 2 present the mosaics of the 4 frames obtained per cluster in J passband.
The data are reduced subtracting from each image a linear combination of the corresponding skies and dividing the results by flat fields taken on twilight sky. We make use of the Arnica package (Hunt et al 1994) in IRAF. Daophot II is used to perform photometry.
The conversion of the instrumental magnitude j and k to the standard J, K is made using stellar fields of standard stars taken by Hunt et al (1998) list. We point out that the JHK Tirgo system is found by Hunt et al (1998) to be consistent with the UKIRT system as described by Casali & Hawarden (1992). About 10 standard stars per night have been used. The relations per 1 sec exposure time are:
| (1) |
| (2) |
| Cluster | Date | Exposure Times (sec) | |||
|---|---|---|---|---|---|
| (2000) | (2000) | J | K | ||
| NGC 1893 | 55 22 34 | 33 23 29 | Oct, 22, 1997 | 720 | 660 |
| Berkeley 86 | 20 20 18 | 38 39 27 | Oct, 25, 1997 | 420 | 420 |
| Oct, 26, 1997 | 480 | 420 | |||
with standard deviation of the zero points of 0.03 mag for the J and 0.04 for the K magnitude. This error is only due to the linear interpolation of the standard stars. The calibration uncertainty is dominated by the error due to the correction from aperture photometry to PSF fitting magnitude. Taking it into account, we estimate that the total error on the calibration is about 0.1 mag both in J and K pass-bands. The standard stars used for the calibration do not cover the entire colour range of the data, because of the lack of stars redder than (J-K). From our data, no colour term is found for K mag, whereas we cannot exclude it for the J magnitude. The limiting magnitudes are K 17 and 16.5 for NGC 1893 and Berkeley 86 respectively.
The data tables will be published electronically at the Centre des Donnes Stellaires of Strasbourg.
3 NGC 1893
3.1 The Color-Magnitude Diagrams
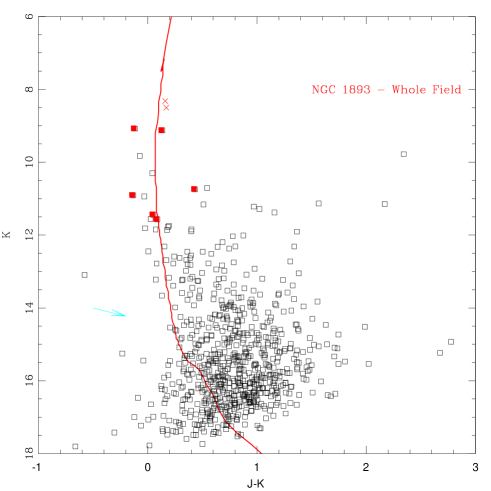
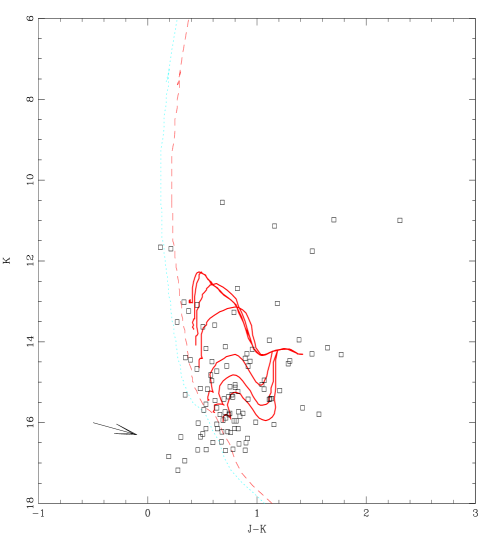
The K-(J-K) CMD for NGC 1893 is shown in Fig.3.
The cluster MS extends vertically between K= and 14, while at
fainter magnitudes it is contaminated by field stars.
We compare our photometry with TCER one. Only 10 bright stars (down to K 13) in common are found.
The comparison between our photometry and TCER photometry gives:
| (3) | |||
| (4) |
To investigate whether this JK CMD is consistent with Tapia et al cluster parameter determination, we assume their determination of reddening and distance and we over-impose on the CMD an isochrone (taken from Padova models, Bertelli et al 1994, Girardi et al 1999) of age of 4 million years (cf Fig.3). Bona fide members brighter than K=9 located outside the observed field, but included in Tapia et al photometry are also taken into account. A good agreement with the CMD is found. A de-reddened CMD will be presented and discussed in the following Section.
3.2 The extinction
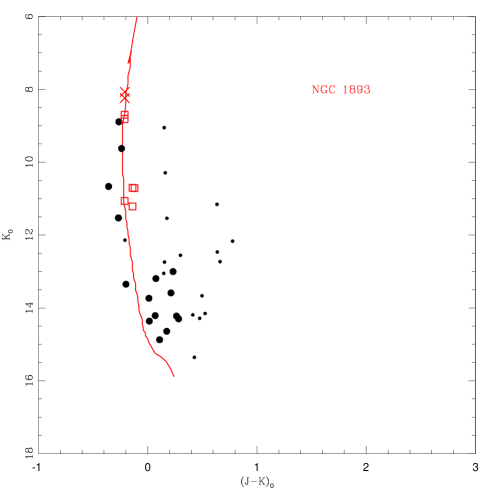
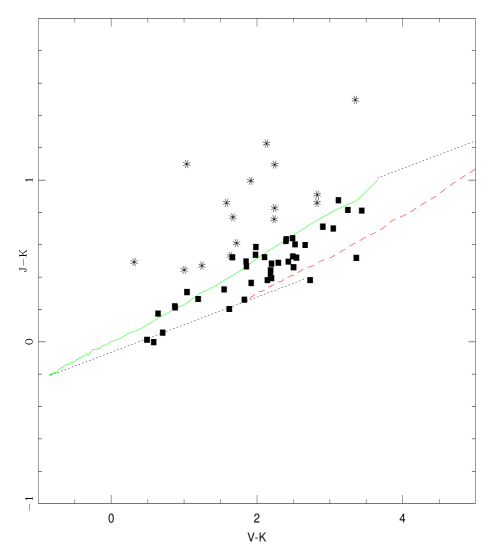
Using the catalog of stars in the BV pass-bands in NGC 1893 given Massey et al. (1995) we identify about 57 stars brighter than V (or K ) in common with our study. From the (V-K)-(J-K) plot shown in Fig 6 we derive the de-reddened CMD for all the 38 stars located at the right of the main sequence loci (see discussion in section 3.3). The resulting CMD is presented in Fig 4. We find an E(J-K) ranging from 0.15 to 0.5 inside the whole region. This is in agreement with Massey et al who find E(B-V) 0.4-0.7 (corresponding to E(J-K) ) for the candidate members. Assuming their determination, we select, as candidate members, objects having E(J-K)= 0.2-0.4. The de-reddened main sequence location is in reasonable agreement with a 4 Myr isochrone. We point out however, that selecting members on the basis of the reddening is probably not very effective in regions where gas and dust are present. The extinction is expected to be extremely variable.
The whole observed region is embedded in a large cloud associated to the cluster (Leisawitz et al 1989) with CO emission. A comparison with a Digitized Sky Survey (DSS) image allows us to identify dark dusty clumps (see Fig.1). We roughly define two main dark regions: and and and . Fig.5 presents the CMD of these dark clump regions where a 4 yr isochrone is plotted. While in the visual pass-bands these clumps are sparsely populated, in the JK CMD they appear to be populated by objects fainter than K . Isochrones fitting to the blue edge of the main sequence allows us to find the minimum reddening inside the region. We derive E(J-K) as high as 0.45-0.55 inside the dark clumps, slightly higher than the mean reddening derived outside the dark clumps.
We compare our determination of the reddening with the maps by Mendez & Van Altena (1998). They find at the distance of 4.3 Kpc, corresponding to the de-reddened distance modulus of 13.20, a value of E(B-V)=0.43 (or E(J-K)=0.26 ), slightly lower than, but in reasonable agreement with the reddening given by NGC 1893.
3.3 Pre-main sequence candidates
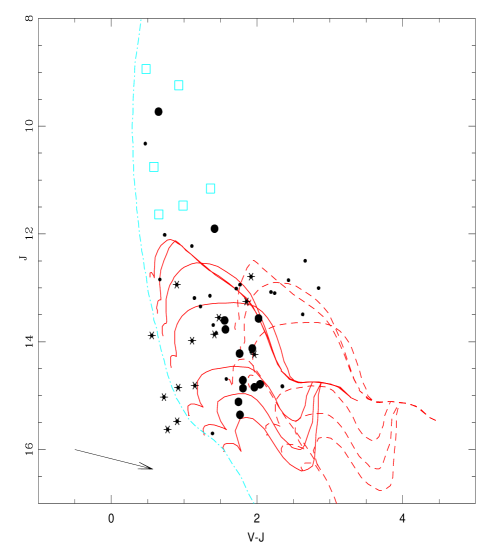
Using BV photometry by Massey et al. (1995) we derive the J-(V-J) CMD presented in Fig 8.
It is not possible to distinguish between pre-main sequence (PMS) stars and field contamination on the basis of the CMD. However, PMS stars often show infrared excesses due to the presence of circumstellar disks/envelopes. Emissions from dust and gas heated by either accretion or photospheric radiation or both, can be evidentiated by combining optical and near-IR photometry (see Hillenbrand et al. 1998). The idea is to select PMS candidates that populate the (V-K)-(J-K) and the (B-V)- (J-K) plots in a region forbidden to normally reddened stars.
Theoretical simulations (Calvet et al. 1991, Meyer et al. 1997, Hillenbrand et al. 1998) show that the effect of circumstellar disks/envelope on the magnitude of the resulting object is maximum in the K band, slightly lower in the J band. B and V colours instead can be considered as purely photospheric, unless an accretion disk is present. In this case, also these latter filters can be affected by a blue excess due to the hot accretion zone (Hartigan et al. 1991). We note that we were not able to apply corrections for reddening for PMS candidates while using this method, since there are no reliable determination of the reddening for these stars. Moreover, the reddening changes quite unpredictably inside the field of view.
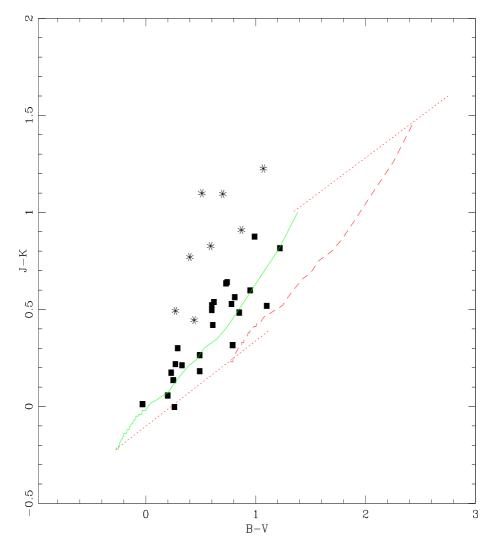
Fig.6 presents the (J-K)-(V-K) diagram for 57 stars in NGC 1893. For 33 of them B magnitudes are available, the corresponding (B-V)-(J-K) diagram is shown Fig. 7. 16 stars are found outside the reddening vectors in the (J-K)-(V-K) plot. To be very conservative, only stars located 0.1 outside the reddening vectors are considered as candidates. Only 8 of them have B known magnitudes and they are located in the (B-V)-(J-K) plot in the region forbidden to normally reddened stars. They can be regarded as pre-main sequence candidates. The location of pre-main sequence stars in the colour-colour diagrams adopted for this method obviously depend on several parameters, including the size and geometry of the disk/envelope, the physical properties of the dust grains, the characteristics of the central star and more. Therefore, the method cannot be used to assess in detail the characteristics of the PMS candidates, but only to draw some global conclusions on statistical basis. Hillebrand et al. (1998) find that the efficiency of the colour-colour plots to detect PMS T Tauri and Herbig Ae/Be stars depends on the adopted colour plot, but is not higher than 70%. Additionally, we note that this method only applies to PMS candidates with a surrounding dust disk or envelope, and will miss all the so-called naked (or weak-line) T Tauri stars. It is not completely clear whether these latter represent an evolutionary phase or an independent phenomenon, but we know that depending on the star-forming region their incidence can be quite important even at ages of a few million years (for instance, in the Taurus-Auriga complex). Therefore, we conclude that a fortiori our estimate of the number of PMS candidates in NGC 1893 is a lower limit.
From the Log T-Log L plane PMS tracks by Bernasconi (1996) we calculate the BVJK magnitudes, using the tables of corrections by Bertelli et al. (1994). The comparison with the observations in the J-(V-J) plane (cf Fig. 8) suggests that the majority of the stars having IR-excess can be PMS objects located close to a reddened 4 Myr isochrone (E(J-K) 0.2-0.4) and having 2-4 and possibly 7 M⊙ masses. If all the stars inside NGC 1893 are born at the same time, we expect that objects more massive than 2-3 M⊙ have already reached the main sequence. Indeed, a star having 7 M⊙ mass needs about 6.3 to reach the main sequence, and a 4 M⊙ mass star needs 1.5 yr. If these candidates are true PMS stars a large spread in age might be present. However, since in these passbands the reddening vector is almost parallel to the x-axis, differential reddening can be responsible for the location of these intermediate mass PMS candidates in the CMD. It cannot be excluded that some of the PMS candidates belong to the field population. Additionally, when combining optical and near-infrared photometry which have not been obtained simultaneously, the expected strong variability of the sources might affect the results. Definitive identification of accreting systems can be obtained only by mean of spectroscopic determination.
As we discussed in the previous section, an optically obscured clump with CO emission is located inside the observed field. Such a region might be the birthplace of young objects. A comparison of the CMD of this region with PMS tracks by Bernasconi (see Fig 5) suggests that at least some of the detected stars can be PMS candidates. Since almost no stars inside this region have BV photometry, the method of the colour-colour plot to detect PMS candidates cannot be applied.
4 Berkeley 86
4.1 The CMD
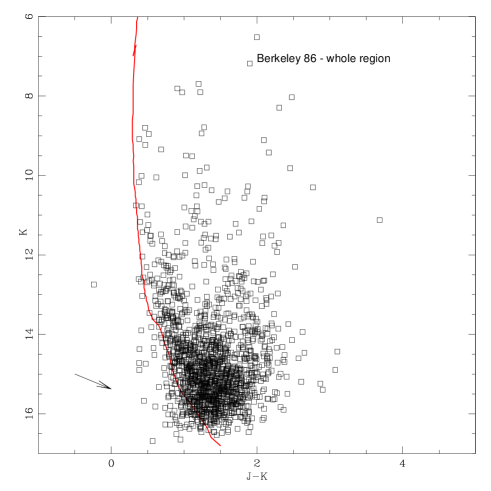
The CMD of the observed region inside Berkeley 86 is shown in Fig.9. The contamination from interlopers is very high. However it is possible to distinguish a vertical MS. With a distance modulus of =11.1 (Massey et al 1995) an isochrone of 6 Myr and E(J-K)=0.5 seems to reproduce the main sequence location.
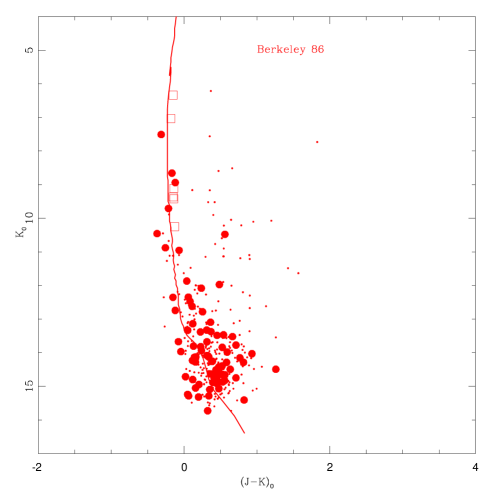
We identify about 340 stars in common with Deeg & Ninkov (1996) photometry for which UBVRI magnitudes are available. Using their estimate of the E(B-V) for each stars we derive the corresponding E(J-K), following the relation E(J-K)/E(B-V)=0.52 (Cardelli et al 1989). The final K-(J-K) CMD reddening corrected is presented in Fig 10. E(J-K) is found ranging from 0.45 to 0.64. The relative frequency of objects inside the field with the E(J-K) is peaked at E(J-K) 0.5. The suspected members are selected on the basis of the reddening, E(J-K) ranging from 0.48 to 0.52, roughly corresponding to 1 in the color excess distribution. As in the case of NGC 1893 we point out that a selection of the members on the basis of the reddening gives only a rough indication in regions where dust and gas are present, since the extinction might be highly variable.
The reddening maps by Mendez & van Altena (1998) give E(B-V)=0.96 or E(J-K) 0.41 at the distance of 1700 pc, where Berkeley 86 is located. The maximum expected reddening inside the region is E(B-V)=2.3 or E(J-K)=0.99. This is in good agreement with our determinations, considering that the mean error on the Mendez & van Altena maps is about E(J-K)=0.16.
4.2 Pre-main sequence candidates
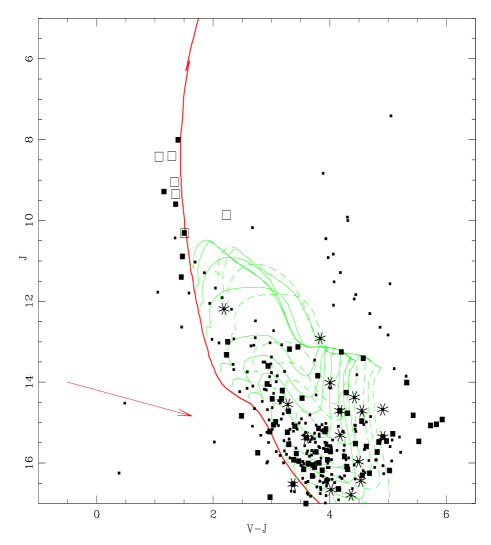
Coupling Deeg & Ninkov photometry with our JK magnitudes, we discuss the presence of candidate pre-main sequence stars. Since I magnitudes are available, we make use of the (V-I)-(I-K) plot. Hillenbrand et al have shown that this color combination is specially effective in identifying stars with infrared excess. Fig.11 presents the (V-I)-(I-K) plot for the stars in common with Deeg & Ninkov (1996). 16 stars seem to be good pre-main sequence candidates. In Fig.12 their location in the J-(V-J) CMD is presented. A comparison with the pre-main sequence tracks shows that the majority of these candidates might have low masses, between 1.7 and 0.8 M⊙. Only two candidates are found in the region occupied by higher mass stars. We cannot exclude however that these stars belong to the background population. Since the time a 1.7 M⊙ star need to reach the main sequence is longer than the age of Berkeley 86 (about 1.5 yr, Bernasconi 1996) no need of a large age spread is found inside the population of Berkeley 86.

5 Conclusions
We have presented J and K near-infrared photometry down to a limiting magnitude of K 17 and 16.5 for the two very young, highly obscured open clusters NGC 1893 and Berkeley 86, respectively. For Berkeley 86 near-infrared photometry was not available before our study, while in the case of NGC 1893 previous near-infrared photometric survey only reached K=13. We confirm previous determinations of the age, distance and reddening of these clusters. Coupling J-K data with Johnson photometry we discuss the presence of stars with IR excess, as pre-main sequence candidates. Several good candidates are identified in both clusters, confirming the young age of these objects. Spectroscopic measurements are requested to definitively identify pre-main sequence objects.
Acknowledgements.
The authors are thankful to the referee C. Dougados for many useful comments. This research has been sponsored by the Italian Ministry of University and Research, and by the Italian Space Agency.References
- [1] Bernasconi P.A., 1996, A&AS 120,57
- [2] Bertelli G., Bressan A., Chiosi C., Fagotto F., Nasi E., 1994, A&AS 106, 275
- [3] Calvet N., Patino A., Magris G.C., D’Alessio P., 1991, ApJ 380, 617
- [4] Casali M.M., Hawarden T.G., 1992 JCMT-UKIRT Newsletter N 4, 33
- [5] Cardelli J.A., Calyton G.C., Mathis J.S., 1989 ApJ 345, 245
- [6] Carraro G., Vallenari A., Girardi L., Richichi A., 1999, A&A 343, 825
- [7] Cuffey J., 1973, AJ 78, 747
- [8] Deeg H.J., Ninkov Z., 1996, A&AS 119, 221
- [9] Delgado, A.J., Alfaro, E.J., Cabrera-Caño J., 1997, AJ 113, 713
- [10] Fitzsimmons A., 1993, A&AS 99, 15
- [11] Forbes D., English E., De Roberts M.M., Dawson P.C., 1992, AJ 103, 916
- [12] Girardi L., Bressan A., Bertelli G., Chiosi C., 1999, in preparation.
- [13] Hillenbrand L,A., Strom S.E., Calvet N., Merrill K.M., Gatley I., Makidon R.B., Meyer M.R., Skrutskie M.F., 1998 AJ 116, 1861
- [14] Hartigan P., Kenyon S.J., Hartmann L., Strom S.E., Edwards S., Welty A., Stauffer J., 1991, ApJ 382, 617
- [15] Hunt L.K., Mannucci F., Testi L., Migliorini S., Stanga R.M., Baffa C., Lisi F., Vanzi L., 1998, AJ 115, 2594
- [16] Hunt, L., Testi, L., Borelli S., Maiolino, R., Moriondo G., 1994, Arcetry Observatory Technical Report N.4/94
- [17] Leisawitz D., Bash F.N., Thaddeus P., 1989, ApJs, 70,731
- [18] Massey P., Johnson K.E., DeGioia-Eastwood K., 1995, ApJ 454, 151
- [19] Meyer M.R., Calvet N., Hillenbrand L.A., 1997, AJ 114,288
- [20] Mendez R., van Altena 1998, A&A 330, 910
- [21] Tapia M., Costero R., Echevarría J., Roth M., 1991, MNRAS 253, 649